Westfield, IN Investment Properties for Sale
Browse homes for sale and investment properties in Westfield, IN. Refine your search by price, property type, or more.
Best cash flowing properties in Westfield, IN
Active
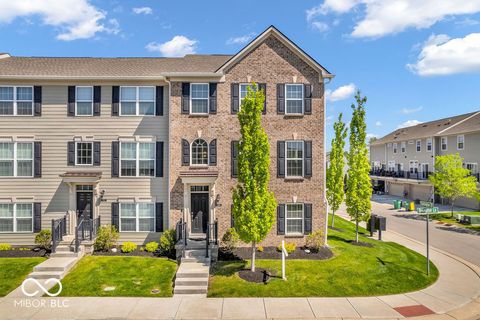
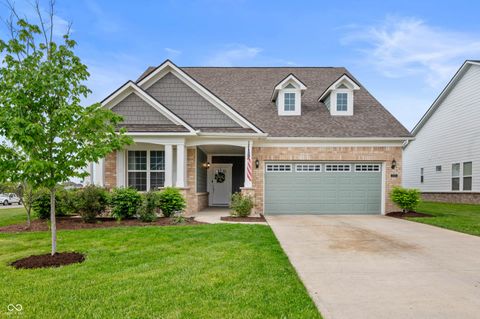
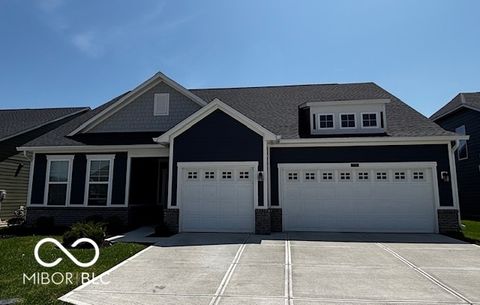
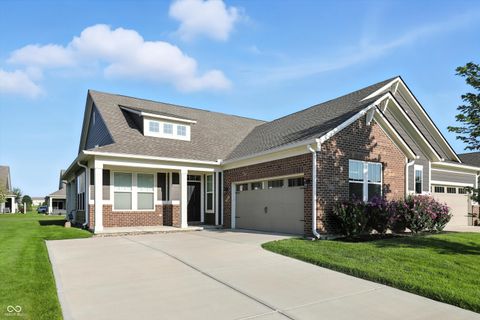
$369,000
3
bds
|
4
ba
|
2,076
sqft
|
built
2018
3546 Brampton Ln, Westfield, IN 46074
$42
Cash flow
0.6%
Cash-on-Cash Return
6.3%
Cap rate
0.8%
Rent to Value Ratio
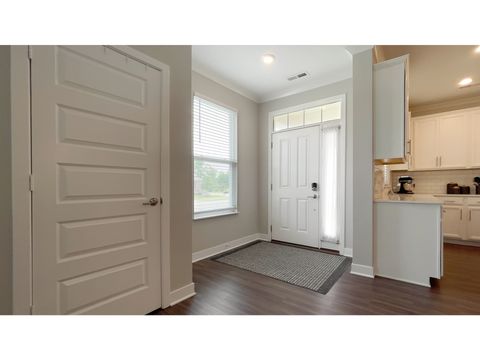
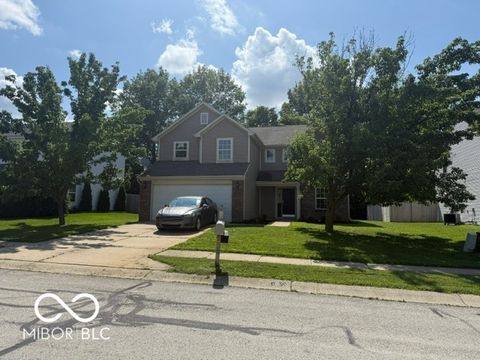
Active
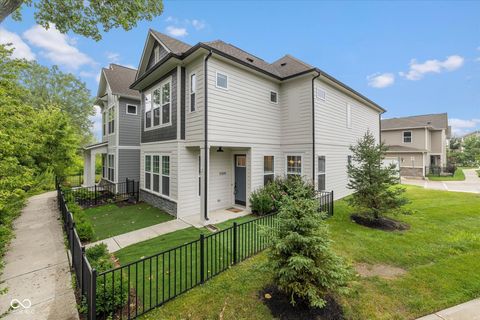
$375,000
3
bds
|
3
ba
|
2,017
sqft
|
built
2021
17399 Dovehouse Ln, Westfield, IN 46074
$-89
Cash flow
-1.2%
Cash-on-Cash Return
5.9%
Cap rate
0.7%
Rent to Value Ratio
36 out of 112 properties for sale in Westfield, IN
Limited Results Shown
Create a free account, or log in to reveal all property listings and enjoy the complete experience.
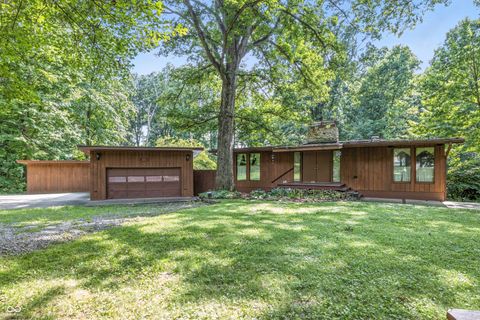
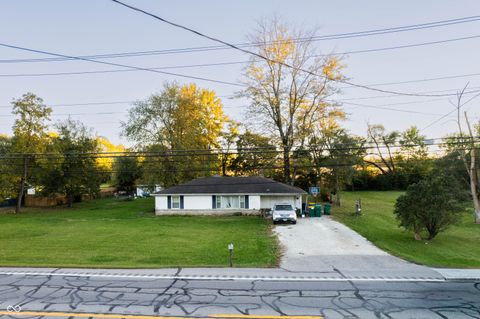
Active
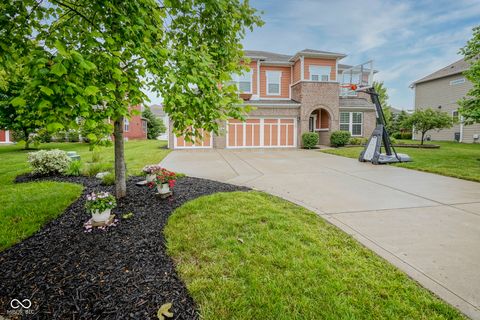
$550,000
3
bds
|
3
ba
|
3,043
sqft
|
built
2014
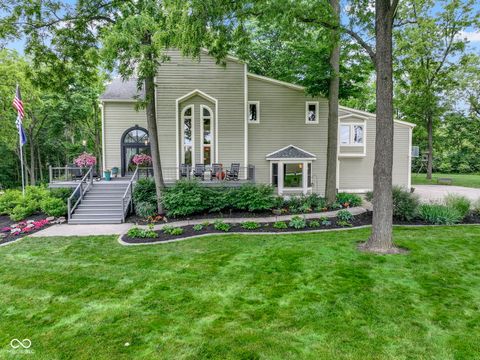
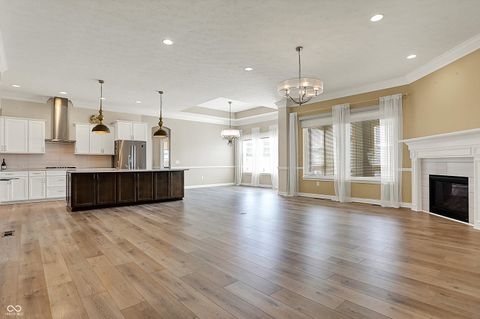
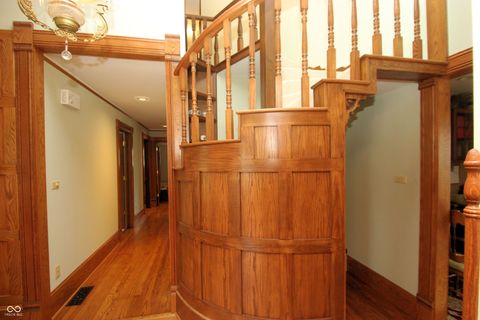
548 Gosford Ct, Westfield, IN 46074
$-761
Cash flow
-7.2%
Cash-on-Cash Return
4.5%
Cap rate
0.6%
Rent to Value Ratio
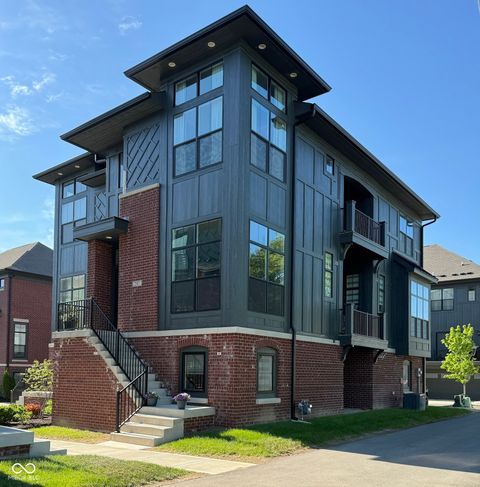
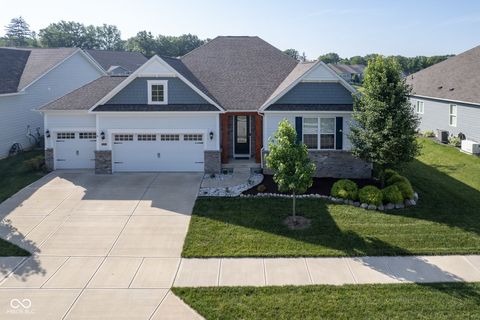
Active
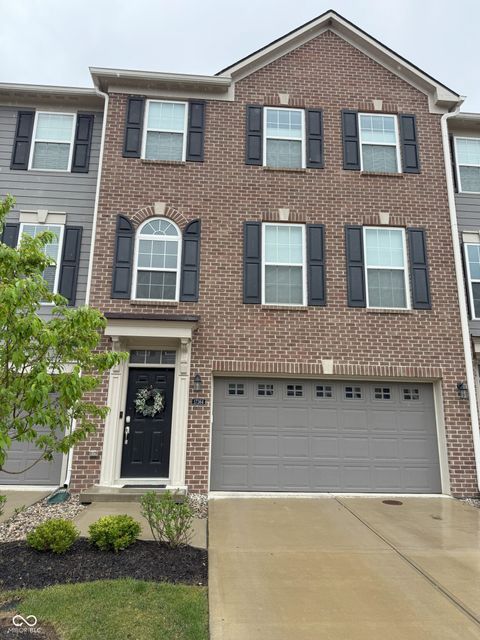
$359,900
3
bds
|
4
ba
|
2,328
sqft
|
built
2020
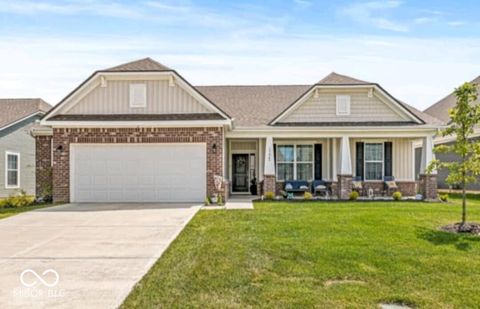
17364 Graley Pl, Westfield, IN 46074
$-200
Cash flow
-2.9%
Cash-on-Cash Return
5.5%
Cap rate
0.7%
Rent to Value Ratio
Active
$550,000
4
bds
|
3
ba
|
2,322
sqft
|
built
2021
16270 Northwind Ct, Westfield, IN 46074
$-891
Cash flow
-8.5%
Cash-on-Cash Return
4.2%
Cap rate
0.5%
Rent to Value Ratio
Active
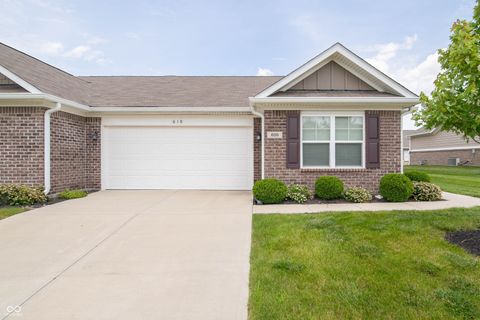
$339,900
3
bds
|
2
ba
|
1,854
sqft
|
built
2019
610 Sawtooth St, Westfield, IN 46074
$-464
Cash flow
-7.1%
Cash-on-Cash Return
4.5%
Cap rate
0.6%
Rent to Value Ratio
Active
$535,000
4
bds
|
3
ba
|
3,310
sqft
|
built
2017
4863 Sherlock Dr, Westfield, IN 46062
$-657
Cash flow
-6.4%
Cash-on-Cash Return
4.7%
Cap rate
0.6%
Rent to Value Ratio
Active
$759,900
5
bds
|
4
ba
|
4,131
sqft
|
built
2022
2105 Granville Dr, Westfield, IN 46074
$-1,335
Cash flow
-9.2%
Cash-on-Cash Return
4.0%
Cap rate
0.5%
Rent to Value Ratio
Active
$749,000
4
bds
|
4
ba
|
3,379
sqft
|
built
2023
17354 Ditch Rd, Westfield, IN 46074
$-732
Cash flow
-5.1%
Cash-on-Cash Return
5.0%
Cap rate
0.6%
Rent to Value Ratio
Active
$390,000
3
bds
|
2
ba
|
1,955
sqft
|
built
2022
17877 Haralson Row, Westfield, IN 46074
$-406
Cash flow
-5.4%
Cash-on-Cash Return
4.9%
Cap rate
0.6%
Rent to Value Ratio
Active
$474,900
4
bds
|
3
ba
|
1,976
sqft
|
built
1960
17128 Towne Rd, Westfield, IN 46074
$-501
Cash flow
-5.5%
Cash-on-Cash Return
4.9%
Cap rate
0.6%
Rent to Value Ratio
Active
$349,999
3
bds
|
3
ba
|
1,600
sqft
|
built
1992
628 Southridge Ct, Westfield, IN 46074
$-344
Cash flow
-5.1%
Cash-on-Cash Return
5.0%
Cap rate
0.6%
Rent to Value Ratio
Active
$557,900
4
bds
|
4
ba
|
2,825
sqft
|
built
2023
1221 Malbec Cir, Westfield, IN 46074
$-794
Cash flow
-7.4%
Cash-on-Cash Return
4.4%
Cap rate
0.6%
Rent to Value Ratio
Active
$369,900
2
bds
|
2
ba
|
1,747
sqft
|
built
2020
17303 Lillian St, Westfield, IN 46074
$-420
Cash flow
-5.9%
Cash-on-Cash Return
4.8%
Cap rate
0.7%
Rent to Value Ratio

Active
$950,000
3
bds
|
1
ba
|
1,413
sqft
|
built
1980
306 S Cherry St, Westfield, IN 46074
$-3,624
Cash flow
-19.9%
Cash-on-Cash Return
1.6%
Cap rate
0.2%
Rent to Value Ratio
Active
$950,000
5
bds
|
3
ba
|
2,464
sqft
|
built
1964
16632 Oak Rd, Westfield, IN 46074
$-2,382
Cash flow
-13.1%
Cash-on-Cash Return
3.1%
Cap rate
0.4%
Rent to Value Ratio
Active
$665,000
2
bds
|
4
ba
|
2,109
sqft
|
built
2022
247 Poplar St, Westfield, IN 46074
$-1,075
Cash flow
-8.4%
Cash-on-Cash Return
4.2%
Cap rate
0.5%
Rent to Value Ratio
Active
$364,900
2
bds
|
2
ba
|
1,632
sqft
|
built
2020
17318 Graley Pl, Westfield, IN 46074
$-473
Cash flow
-6.8%
Cash-on-Cash Return
4.6%
Cap rate
0.7%
Rent to Value Ratio
Active
$355,000
4
bds
|
3
ba
|
2,153
sqft
|
built
2006
17902 Cristin Way, Westfield, IN 46062
$-257
Cash flow
-3.8%
Cash-on-Cash Return
5.3%
Cap rate
0.6%
Rent to Value Ratio

Active
$425,000
3
bds
|
2
ba
|
1,907
sqft
|
built
2023
19195 River Jordan Dr, Westfield, IN 46074
$-677
Cash flow
-8.3%
Cash-on-Cash Return
4.2%
Cap rate
0.6%
Rent to Value Ratio

Active
$725,000
3
bds
|
3
ba
|
2,899
sqft
|
built
2023
15888 Kohut Ln, Westfield, IN 46074
$-1,374
Cash flow
-9.9%
Cash-on-Cash Return
3.9%
Cap rate
0.5%
Rent to Value Ratio
Active
$275,000
2
bds
|
1
ba
|
1,100
sqft
|
built
1957
3837 W State Road 32, Westfield, IN 46074
$-167
Cash flow
-3.2%
Cash-on-Cash Return
5.4%
Cap rate
0.7%
Rent to Value Ratio
Active
$655,000
4
bds
|
4
ba
|
4,350
sqft
|
built
2019
16235 Natures Way, Westfield, IN 46074
$-393
Cash flow
-3.1%
Cash-on-Cash Return
5.4%
Cap rate
0.7%
Rent to Value Ratio

Active
$750,000
4
bds
|
2
ba
|
1,792
sqft
|
built
1978
3231 W State Road 32, Westfield, IN 46074
$-1,703
Cash flow
-11.8%
Cash-on-Cash Return
3.4%
Cap rate
0.4%
Rent to Value Ratio
Active
$1,200,000
4
bds
|
4
ba
|
3,856
sqft
|
built
1990
17320 Joliet Rd, Westfield, IN 46074
$-3,387
Cash flow
-14.7%
Cash-on-Cash Return
2.8%
Cap rate
0.3%
Rent to Value Ratio
Active
$664,900
4
bds
|
4
ba
|
4,048
sqft
|
built
2019
16544 Gaither Ct, Westfield, IN 46074
$-746
Cash flow
-5.9%
Cash-on-Cash Return
4.8%
Cap rate
0.6%
Rent to Value Ratio
Active
$750,000
6
bds
|
3
ba
|
2,938
sqft
|
built
1964
701 E Main St, Westfield, IN 46074
$-1,910
Cash flow
-13.3%
Cash-on-Cash Return
3.1%
Cap rate
0.4%
Rent to Value Ratio

Active
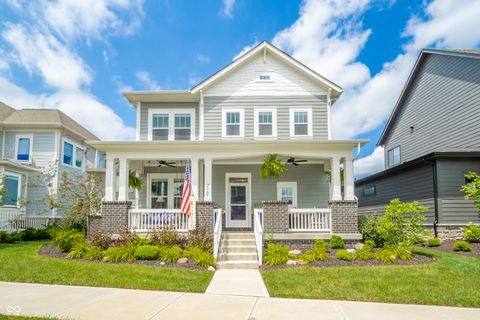
$635,000
3
bds
|
4
ba
|
1,830
sqft
|
built
2022
401 Jersey St, Westfield, IN 46074
$-350
Cash flow
-2.9%
Cash-on-Cash Return
5.5%
Cap rate
0.7%
Rent to Value Ratio
Active
$395,900
3
bds
|
2
ba
|
1,756
sqft
|
built
2022
17865 Haralson Row, Westfield, IN 46074
$-344
Cash flow
-4.5%
Cash-on-Cash Return
5.1%
Cap rate
0.7%
Rent to Value Ratio
Active
$950,000
3
bds
|
1
ba
|
1,920
sqft
|
built
1960
338 E Park St, Westfield, IN 46074
$-3,762
Cash flow
-20.7%
Cash-on-Cash Return
1.4%
Cap rate
0.2%
Rent to Value Ratio
Active
$520,000
2
bds
|
2
ba
|
1,789
sqft
|
built
2022
15424 Eclipse Rd, Westfield, IN 46074
$-1,068
Cash flow
-10.7%
Cash-on-Cash Return
3.7%
Cap rate
0.5%
Rent to Value Ratio
Active
$320,000
2
bds
|
2
ba
|
2,236
sqft
|
built
2007
3518 Heathcliff Ct, Westfield, IN 46074
$-390
Cash flow
-6.4%
Cash-on-Cash Return
4.7%
Cap rate
0.7%
Rent to Value Ratio

Active
$449,000
5
bds
|
3
ba
|
3,030
sqft
|
built
2016
935 Northwich Ave, Westfield, IN 46074
$-396
Cash flow
-4.6%
Cash-on-Cash Return
5.1%
Cap rate
0.6%
Rent to Value Ratio
Active
$799,000
5
bds
|
5
ba
|
4,435
sqft
|
built
2005
16802 Oak Manor Dr, Westfield, IN 46074
$-1,466
Cash flow
-9.6%
Cash-on-Cash Return
3.9%
Cap rate
0.5%
Rent to Value Ratio
Active
$1,100,000
6
bds
|
5
ba
|
4,870
sqft
|
built
2022
78 Chatham Brook Dr, Westfield, IN 46074
$-1,363
Cash flow
-6.5%
Cash-on-Cash Return
4.7%
Cap rate
0.6%
Rent to Value Ratio
Active
$685,000
4
bds
|
2
ba
|
2,064
sqft
|
built
1890
18229 Moontown Rd, Westfield, IN 46062
$-1,784
Cash flow
-13.6%
Cash-on-Cash Return
3.0%
Cap rate
0.4%
Rent to Value Ratio