Westfield, IN Investment Properties for Sale
Browse homes for sale and investment properties in Westfield, IN. Refine your search by price, property type, or more.
Best cash flowing properties in Westfield, IN
Active
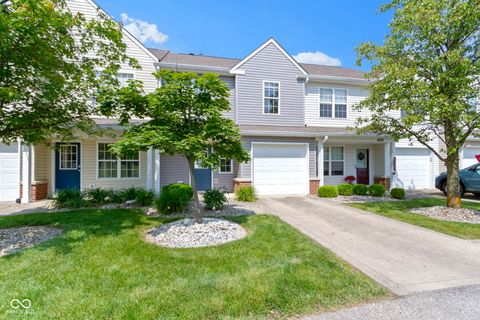
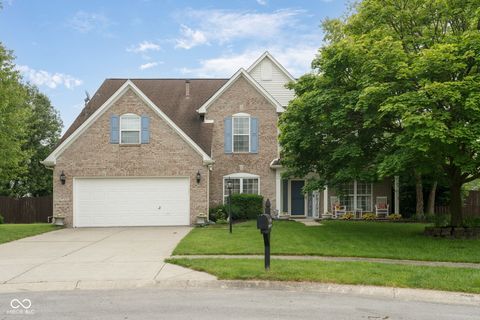
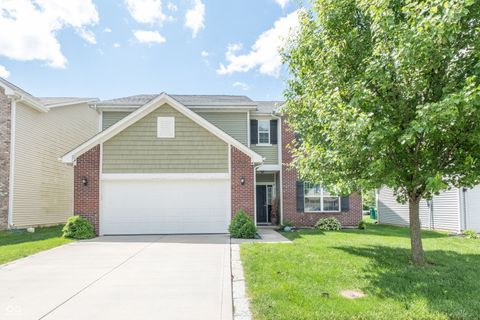
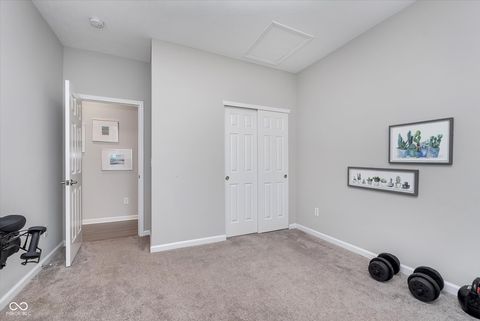
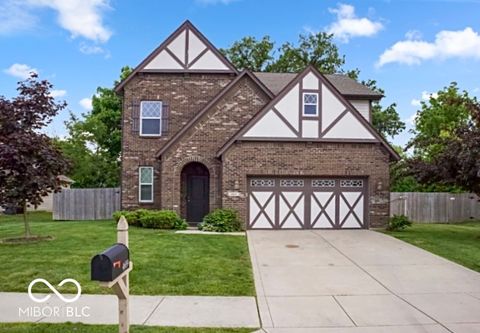
$212,900
2
bds
|
2
ba
|
1,276
sqft
|
built
2002
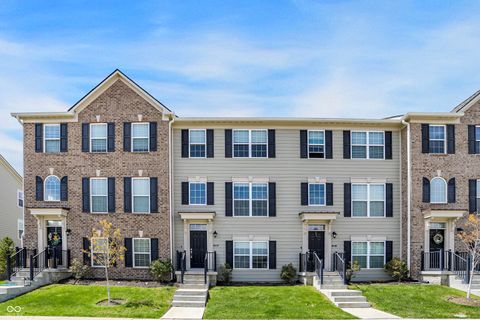
603 Daviess Dr, Westfield, IN 46074
$-184
Cash flow
-4.5%
Cash-on-Cash Return
5.2%
Cap rate
0.8%
Rent to Value Ratio
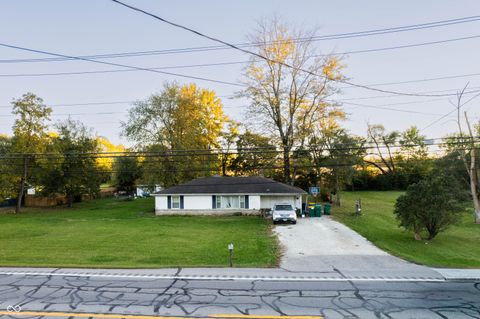
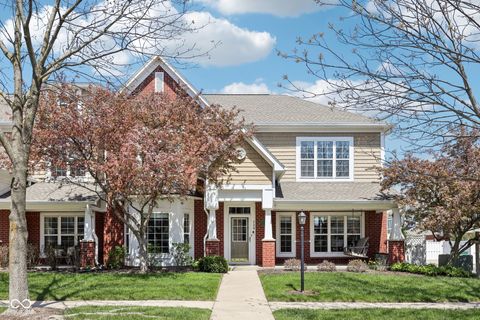
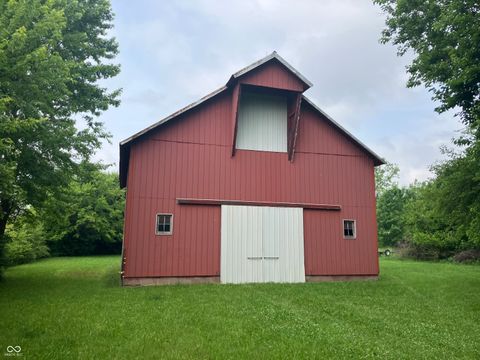
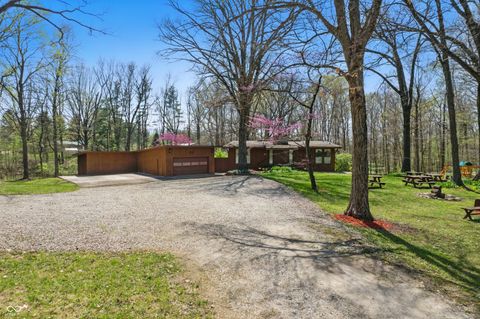
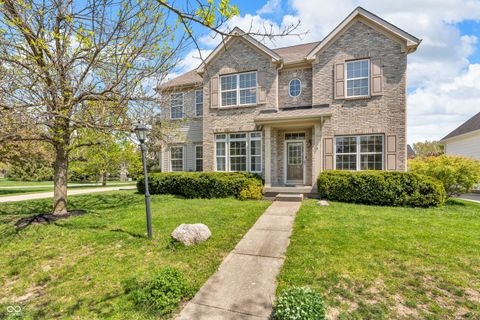
Active
$275,000
2
bds
|
1
ba
|
1,100
sqft
|
built
1957
3837 W State Road 32, Westfield, IN 46074
$-194
Cash flow
-3.7%
Cash-on-Cash Return
5.4%
Cap rate
0.7%
Rent to Value Ratio
86 out of 124 properties for sale in Westfield, IN
Limited Results Shown
Create a free account, or log in to reveal all property listings and enjoy the complete experience.

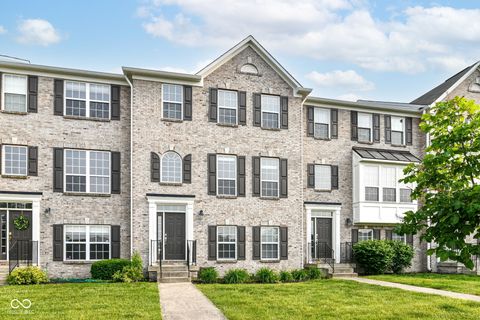
Active
$2,500,000
4
bds
|
5
ba
|
8,958
sqft
|
built
2016
860 Chatham Hills Blvd, Westfield, IN 46074
$-8,724
Cash flow
-18.2%
Cash-on-Cash Return
2.1%
Cap rate
0.3%
Rent to Value Ratio
Active
$265,000
2
bds
|
2
ba
|
1,220
sqft
|
built
2022
3428 Thomas Jefferson St, Westfield, IN 46074
$-296
Cash flow
-5.8%
Cash-on-Cash Return
4.9%
Cap rate
0.7%
Rent to Value Ratio
Active
$950,000
3
bds
|
1
ba
|
1,920
sqft
|
built
1960
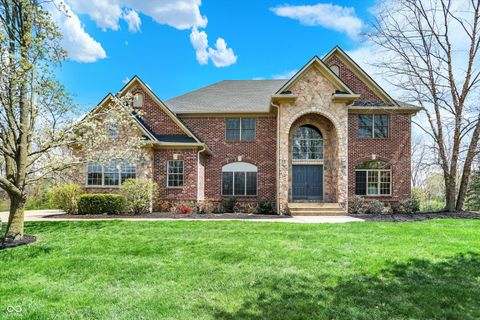
338 E Park St, Westfield, IN 46074
$-3,856
Cash flow
-21.2%
Cash-on-Cash Return
1.4%
Cap rate
0.2%
Rent to Value Ratio
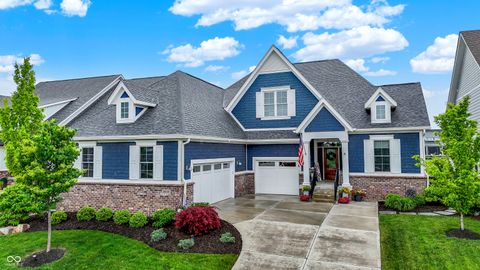
Active
$449,900
4
bds
|
3
ba
|
2,598
sqft
|
built
2016
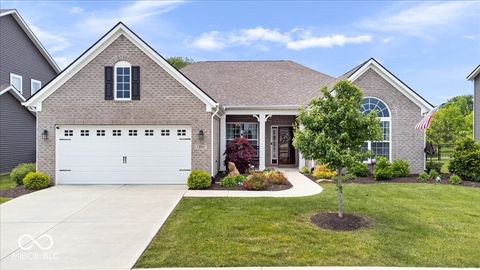
16758 Bingham Dr, Westfield, IN 46074
$-481
Cash flow
-5.6%
Cash-on-Cash Return
5.0%
Cap rate
0.6%
Rent to Value Ratio
Active
$395,900
3
bds
|
2
ba
|
1,756
sqft
|
built
2022
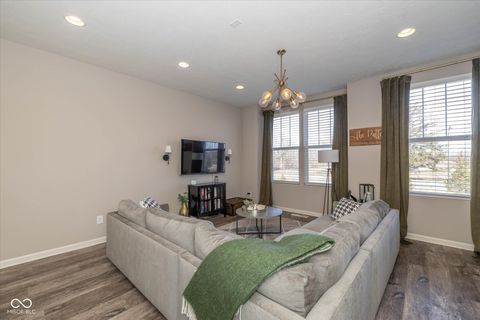
17865 Haralson Row, Westfield, IN 46074
$-383
Cash flow
-5.0%
Cash-on-Cash Return
5.1%
Cap rate
0.7%
Rent to Value Ratio
Active
$334,900
2
bds
|
2
ba
|
1,627
sqft
|
built
2018
17345 Northam Dr, Westfield, IN 46074
$-487
Cash flow
-7.6%
Cash-on-Cash Return
4.5%
Cap rate
0.7%
Rent to Value Ratio
Active
$300,000
3
bds
|
3
ba
|
1,574
sqft
|
built
2021
3613 Lehigh Ave, Westfield, IN 46074
$-340
Cash flow
-5.9%
Cash-on-Cash Return
4.9%
Cap rate
0.7%
Rent to Value Ratio
Active
$480,000
4
bds
|
3
ba
|
2,832
sqft
|
built
1995
15409 Heath Cir, Westfield, IN 46074
$-705
Cash flow
-7.7%
Cash-on-Cash Return
4.5%
Cap rate
0.6%
Rent to Value Ratio
Active
$882,000
6
bds
|
3
ba
|
2,938
sqft
|
built
1964
701 E Main St, Westfield, IN 46074
$-2,673
Cash flow
-15.8%
Cash-on-Cash Return
2.6%
Cap rate
0.3%
Rent to Value Ratio
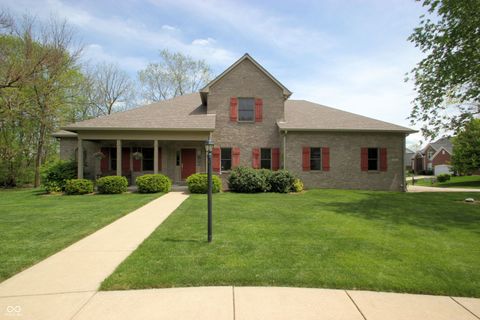
Active
$329,900
3
bds
|
3
ba
|
2,216
sqft
|
built
2003
720 Bucksport Ln, Westfield, IN 46074
$-465
Cash flow
-7.4%
Cash-on-Cash Return
4.6%
Cap rate
0.7%
Rent to Value Ratio
Active
$325,000
3
bds
|
4
ba
|
1,368
sqft
|
built
2006
174 Straughn Ln, Westfield, IN 46074
$-419
Cash flow
-6.7%
Cash-on-Cash Return
4.7%
Cap rate
0.6%
Rent to Value Ratio
Active
$1,575,000
6
bds
|
6
ba
|
5,556
sqft
|
built
2017
284 Chatham Hills Blvd, Westfield, IN 46074
$-3,309
Cash flow
-11.0%
Cash-on-Cash Return
3.7%
Cap rate
0.5%
Rent to Value Ratio
Active
$379,900
2
bds
|
2
ba
|
1,895
sqft
|
built
2020
17309 Graley Pl, Westfield, IN 46074
$-656
Cash flow
-9.0%
Cash-on-Cash Return
4.2%
Cap rate
0.6%
Rent to Value Ratio
Active
$573,900
4
bds
|
3
ba
|
2,381
sqft
|
built
2023
15304 Fairlands Dr, Westfield, IN 46074
$-990
Cash flow
-9.0%
Cash-on-Cash Return
4.2%
Cap rate
0.5%
Rent to Value Ratio
Active
$520,000
5
bds
|
3
ba
|
2,820
sqft
|
built
2024
3980 Railhead Ave, Westfield, IN 46074
$-1,662
Cash flow
-16.7%
Cash-on-Cash Return
2.4%
Cap rate
0.3%
Rent to Value Ratio
Active
$485,000
5
bds
|
3
ba
|
3,030
sqft
|
built
2016
935 Northwich Ave, Westfield, IN 46074
$-628
Cash flow
-6.8%
Cash-on-Cash Return
4.7%
Cap rate
0.6%
Rent to Value Ratio
Active
$435,000
3
bds
|
2
ba
|
2,176
sqft
|
built
2022
1051 Macoun Dr, Westfield, IN 46074
$-541
Cash flow
-6.5%
Cash-on-Cash Return
4.8%
Cap rate
0.6%
Rent to Value Ratio
Active
$330,000
2
bds
|
2
ba
|
2,236
sqft
|
built
2007
3518 Heathcliff Ct, Westfield, IN 46074
$-474
Cash flow
-7.5%
Cash-on-Cash Return
4.5%
Cap rate
0.6%
Rent to Value Ratio
Active
$724,000
4
bds
|
2
ba
|
2,064
sqft
|
built
1890
18229 Moontown Rd, Westfield, IN 46062
$-2,055
Cash flow
-14.8%
Cash-on-Cash Return
2.9%
Cap rate
0.3%
Rent to Value Ratio
Active
$524,900
3
bds
|
3
ba
|
2,068
sqft
|
built
2017
1655 Avondale Dr, Westfield, IN 46074
$-941
Cash flow
-9.4%
Cash-on-Cash Return
4.1%
Cap rate
0.5%
Rent to Value Ratio
Active
$825,000
5
bds
|
5
ba
|
4,435
sqft
|
built
2005
16802 Oak Manor Dr, Westfield, IN 46074
$-1,680
Cash flow
-10.6%
Cash-on-Cash Return
3.8%
Cap rate
0.5%
Rent to Value Ratio
Active
$374,900
2
bds
|
2
ba
|
1,542
sqft
|
built
2021
19144 Goins Blvd, Westfield, IN 46074
$-659
Cash flow
-9.2%
Cash-on-Cash Return
4.2%
Cap rate
0.6%
Rent to Value Ratio
Active
$1,149,999
6
bds
|
5
ba
|
6,490
sqft
|
built
2022
78 Chatham Brook Dr, Westfield, IN 46074
$-1,732
Cash flow
-7.9%
Cash-on-Cash Return
4.5%
Cap rate
0.5%
Rent to Value Ratio
Active
$950,000
5
bds
|
3
ba
|
2,464
sqft
|
built
1964
16632 Oak Rd, Westfield, IN 46074
$-2,476
Cash flow
-13.6%
Cash-on-Cash Return
3.1%
Cap rate
0.4%
Rent to Value Ratio
Active
$998,000
4
bds
|
4
ba
|
3,952
sqft
|
built
2020
20010 Prescott Pl, Westfield, IN 46074
$-1,465
Cash flow
-7.7%
Cash-on-Cash Return
4.5%
Cap rate
0.6%
Rent to Value Ratio
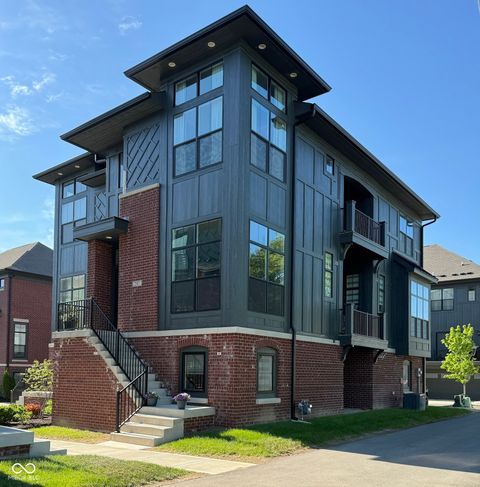
Active
$665,000
2
bds
|
4
ba
|
2,109
sqft
|
built
2022
247 Poplar St, Westfield, IN 46074
$-1,141
Cash flow
-9.0%
Cash-on-Cash Return
4.2%
Cap rate
0.5%
Rent to Value Ratio
Active
$675,000
4
bds
|
4
ba
|
4,570
sqft
|
built
2002
17003 Whitebark Ct, Westfield, IN 46074
$-1,060
Cash flow
-8.2%
Cash-on-Cash Return
4.4%
Cap rate
0.5%
Rent to Value Ratio
Active
$212,900
2
bds
|
2
ba
|
1,276
sqft
|
built
2002
603 Daviess Dr, Westfield, IN 46074
$-184
Cash flow
-4.5%
Cash-on-Cash Return
5.2%
Cap rate
0.8%
Rent to Value Ratio
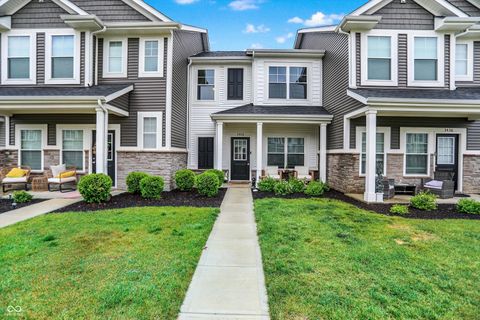
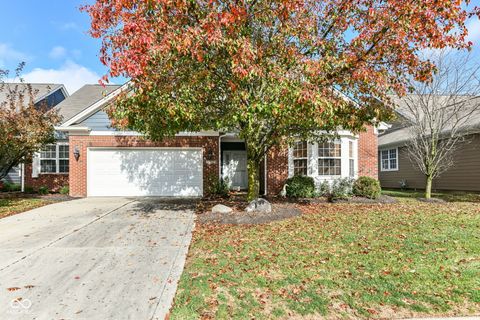
Active
$325,000
3
bds
|
3
ba
|
1,836
sqft
|
built
2018
17269 Dallington St, Westfield, IN 46074
$-295
Cash flow
-4.7%
Cash-on-Cash Return
5.2%
Cap rate
0.7%
Rent to Value Ratio
Active
$275,000
2
bds
|
1
ba
|
1,100
sqft
|
built
1957
3837 W State Road 32, Westfield, IN 46074
$-194
Cash flow
-3.7%
Cash-on-Cash Return
5.4%
Cap rate
0.7%
Rent to Value Ratio

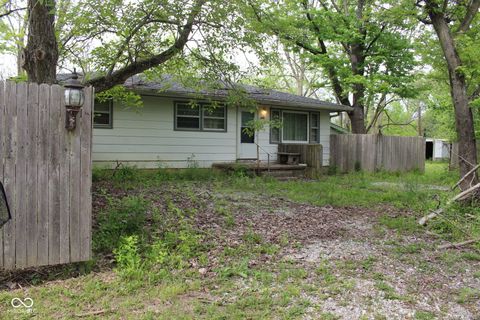
Active
$950,000
3
bds
|
1
ba
|
1,413
sqft
|
built
1980
306 S Cherry St, Westfield, IN 46074
$-3,718
Cash flow
-20.4%
Cash-on-Cash Return
1.6%
Cap rate
0.2%
Rent to Value Ratio
Active
$1,149,900
5
bds
|
5
ba
|
5,553
sqft
|
built
2005
3940 Woodcrest Ct, Westfield, IN 46062
$-2,266
Cash flow
-10.3%
Cash-on-Cash Return
3.9%
Cap rate
0.5%
Rent to Value Ratio
Active
$475,000
3
bds
|
2
ba
|
2,305
sqft
|
built
2020
1539 Hazy Falls Blvd, Westfield, IN 46074
$-598
Cash flow
-6.6%
Cash-on-Cash Return
4.8%
Cap rate
0.6%
Rent to Value Ratio
Active
$420,000
3
bds
|
4
ba
|
2,142
sqft
|
built
2019
1208 Chapman Dr, Westfield, IN 46074
$-713
Cash flow
-8.9%
Cash-on-Cash Return
4.2%
Cap rate
0.6%
Rent to Value Ratio
Active
$539,900
6
bds
|
3
ba
|
3,006
sqft
|
built
2022
1026 Woodglen Dr, Westfield, IN 46074
$-680
Cash flow
-6.6%
Cash-on-Cash Return
4.8%
Cap rate
0.6%
Rent to Value Ratio
Active
$780,000
4
bds
|
4
ba
|
3,759
sqft
|
built
2023
17359 Wilkes Way, Westfield, IN 46074
$-1,343
Cash flow
-9.0%
Cash-on-Cash Return
4.2%
Cap rate
0.5%
Rent to Value Ratio
Active
$499,900
5
bds
|
3
ba
|
3,605
sqft
|
built
2004
16138 Palmyra Grn, Westfield, IN 46074
$-724
Cash flow
-7.6%
Cash-on-Cash Return
4.5%
Cap rate
0.6%
Rent to Value Ratio
Active
$499,999
5
bds
|
4
ba
|
3,590
sqft
|
built
2005
16247 Countryside Blvd, Westfield, IN 46074
$-655
Cash flow
-6.8%
Cash-on-Cash Return
4.7%
Cap rate
0.6%
Rent to Value Ratio
Active
$399,999
4
bds
|
3
ba
|
2,472
sqft
|
built
2012
4689 Muscatine Way, Westfield, IN 46062
$-395
Cash flow
-5.2%
Cash-on-Cash Return
5.1%
Cap rate
0.6%
Rent to Value Ratio
Active
$450,000
4
bds
|
3
ba
|
2,590
sqft
|
built
2002
15329 Smithfield Dr, Westfield, IN 46074
$-494
Cash flow
-5.7%
Cash-on-Cash Return
4.9%
Cap rate
0.6%
Rent to Value Ratio