Milwaukee County Investment Properties for Sale
Browse homes for sale and investment properties in Milwaukee County. Refine your search by price, property type, or more.
Best cash flowing properties in Milwaukee County

Active
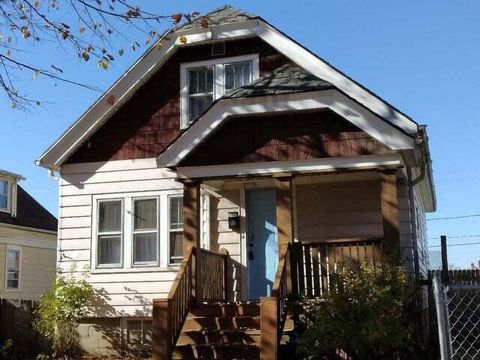
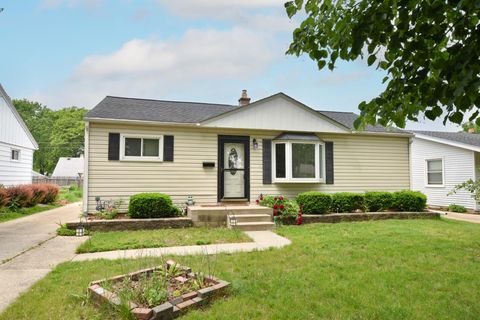
$69,900
2
bds
|
0
ba
|
710
sqft
|
built
1891
2873 N Dr William Finlayson St, Milwaukee, WI 53212
$556
Cash flow
9.3%
Cash-on-Cash Return
9.5%
Cap rate
1.3%
Rent to Value Ratio
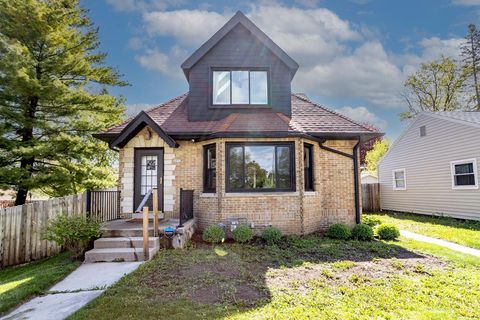
Active
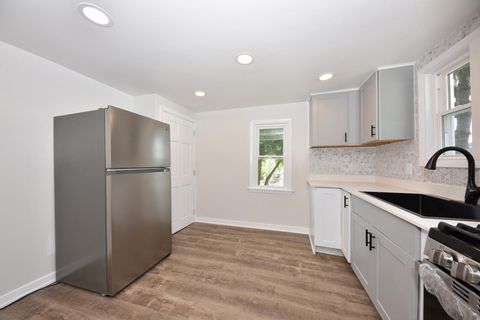
$105,000
3
bds
|
0
ba
|
892
sqft
|
built
1924
4715 N 39th St, Milwaukee, WI 53209
$145
Cash flow
7.2%
Cash-on-Cash Return
7.8%
Cap rate
1.1%
Rent to Value Ratio
907 out of 1,797 properties for sale in Milwaukee County
Limited Results Shown
Create a free account, or log in to reveal all property listings and enjoy the complete experience.

Active
$340,000
6
bds
|
0
ba
|
2,591
sqft
|
built
1929
3178 S 42nd St, Milwaukee, WI 53215
$-1,297
Cash flow
-19.9%
Cash-on-Cash Return
1.6%
Cap rate
0.4%
Rent to Value Ratio

Active
$699,000
2
bds
|
0
ba
|
1,902
sqft
|
built
1995
1420 N Astor St, Milwaukee, WI 53202
$-2,987
Cash flow
-22.3%
Cash-on-Cash Return
1.0%
Cap rate
0.4%
Rent to Value Ratio
Active
$182,900
2
bds
|
0
ba
|
1,411
sqft
|
built
1925
4821 N 58th St, Milwaukee, WI 53218
$-406
Cash flow
-11.6%
Cash-on-Cash Return
3.5%
Cap rate
0.5%
Rent to Value Ratio

Active
$329,900
3
bds
|
0
ba
|
1,037
sqft
|
built
1960
5863 S Madeline Ave, Milwaukee, WI 53221
$-787
Cash flow
-12.4%
Cash-on-Cash Return
3.3%
Cap rate
0.6%
Rent to Value Ratio

Active
$370,000
3
bds
|
0
ba
|
1,248
sqft
|
built
1940
3552 S Pine Ave, Milwaukee, WI 53207
$-1,045
Cash flow
-14.7%
Cash-on-Cash Return
2.8%
Cap rate
0.5%
Rent to Value Ratio

Active
$285,000
4
bds
|
0
ba
|
1,210
sqft
|
built
1971
10100 W Tower Ave, Milwaukee, WI 53224
$-401
Cash flow
-7.3%
Cash-on-Cash Return
4.5%
Cap rate
0.7%
Rent to Value Ratio
Active
$105,000
3
bds
|
0
ba
|
892
sqft
|
built
1924
4715 N 39th St, Milwaukee, WI 53209
$145
Cash flow
7.2%
Cash-on-Cash Return
7.8%
Cap rate
1.1%
Rent to Value Ratio

Active
$300,000
4
bds
|
0
ba
|
1,624
sqft
|
built
1954
2767 S 64th St, Milwaukee, WI 53219
$-864
Cash flow
-15.0%
Cash-on-Cash Return
2.7%
Cap rate
0.5%
Rent to Value Ratio

Active
$219,900
3
bds
|
0
ba
|
1,464
sqft
|
built
1927
2354 N 57th St, Milwaukee, WI 53210
$-328
Cash flow
-7.8%
Cash-on-Cash Return
4.4%
Cap rate
0.8%
Rent to Value Ratio

Active
$259,900
5
bds
|
0
ba
|
1,960
sqft
|
built
1941
3718 N 50th St, Milwaukee, WI 53216
$-352
Cash flow
-7.1%
Cash-on-Cash Return
4.5%
Cap rate
0.7%
Rent to Value Ratio

Active
$178,900
3
bds
|
0
ba
|
1,306
sqft
|
built
1922
3625 N 19th St, Milwaukee, WI 53206
$-68
Cash flow
-2.0%
Cash-on-Cash Return
5.7%
Cap rate
0.8%
Rent to Value Ratio

Active
$229,900
3
bds
|
0
ba
|
1,008
sqft
|
built
1957
2804 S 64th St, Milwaukee, WI 53219
$-423
Cash flow
-9.6%
Cash-on-Cash Return
3.9%
Cap rate
0.7%
Rent to Value Ratio

Active
$249,900
bds
|
0
ba
|
2,970
sqft
|
built
1897
837 S 19th St, Milwaukee, WI 53204
$-561
Cash flow
-11.7%
Cash-on-Cash Return
3.5%
Cap rate
0.6%
Rent to Value Ratio

Active
$145,000
5
bds
|
0
ba
|
2,050
sqft
|
built
1968
4783 N 30th St, Milwaukee, WI 53209
$21
Cash flow
0.8%
Cash-on-Cash Return
6.3%
Cap rate
1.0%
Rent to Value Ratio

Active
$164,900
1
bds
|
0
ba
|
752
sqft
|
built
2006
606 W Wisconsin Ave, Milwaukee, WI 53203
$-115
Cash flow
-3.6%
Cash-on-Cash Return
5.3%
Cap rate
0.9%
Rent to Value Ratio

Active
$187,750
6
bds
|
0
ba
|
2,833
sqft
|
built
1950
1439 N 39th St, Milwaukee, WI 53208
$-264
Cash flow
-7.3%
Cash-on-Cash Return
4.5%
Cap rate
0.7%
Rent to Value Ratio

Active
$175,000
4
bds
|
0
ba
|
1,352
sqft
|
built
1929
6028 N 38th St, Milwaukee, WI 53209
$57
Cash flow
1.7%
Cash-on-Cash Return
6.5%
Cap rate
0.9%
Rent to Value Ratio
Active
$199,000
3
bds
|
0
ba
|
1,007
sqft
|
built
1923
5619 W National Ave, West Allis, WI 53214
$-421
Cash flow
-11.0%
Cash-on-Cash Return
3.6%
Cap rate
0.6%
Rent to Value Ratio
Active
$395,000
3
bds
|
0
ba
|
2,458
sqft
|
built
1966
701 W Fairfield Ct, Glendale, WI 53217
$-755
Cash flow
-10.0%
Cash-on-Cash Return
3.9%
Cap rate
0.6%
Rent to Value Ratio

Active
$258,000
3
bds
|
0
ba
|
1,506
sqft
|
built
1980
9322 N Joyce Ave, Milwaukee, WI 53224
$-347
Cash flow
-7.0%
Cash-on-Cash Return
4.5%
Cap rate
0.8%
Rent to Value Ratio
Active
$69,900
2
bds
|
0
ba
|
710
sqft
|
built
1891
2873 N Dr William Finlayson St, Milwaukee, WI 53212
$556
Cash flow
9.3%
Cash-on-Cash Return
9.5%
Cap rate
1.3%
Rent to Value Ratio
Active
$290,000
3
bds
|
0
ba
|
1,354
sqft
|
built
1989
2409 W Crabapple Ln, Oak Creek, WI 53154
$-794
Cash flow
-14.3%
Cash-on-Cash Return
2.9%
Cap rate
0.5%
Rent to Value Ratio
Active
$359,000
3
bds
|
0
ba
|
1,459
sqft
|
built
1951
219 W Daphne Rd, Glendale, WI 53217
$-785
Cash flow
-11.4%
Cash-on-Cash Return
3.5%
Cap rate
0.6%
Rent to Value Ratio

Active
$449,900
3
bds
|
0
ba
|
2,466
sqft
|
built
1994
6241 N 118th St, Milwaukee, WI 53225
$-1,202
Cash flow
-13.9%
Cash-on-Cash Return
2.9%
Cap rate
0.6%
Rent to Value Ratio

Active
$345,000
3
bds
|
0
ba
|
1,661
sqft
|
built
1890
2230 N 2nd St, Milwaukee, WI 53212
$-1,038
Cash flow
-15.7%
Cash-on-Cash Return
2.5%
Cap rate
0.5%
Rent to Value Ratio
Active
$359,000
5
bds
|
0
ba
|
1,947
sqft
|
built
1954
5326 W Crawford Ave, Milwaukee, WI 53220
$-935
Cash flow
-13.6%
Cash-on-Cash Return
3.0%
Cap rate
0.5%
Rent to Value Ratio

Active
$299,900
2
bds
|
0
ba
|
840
sqft
|
built
1890
1605 E Webster Pl, Milwaukee, WI 53211
$-782
Cash flow
-13.6%
Cash-on-Cash Return
3.0%
Cap rate
0.5%
Rent to Value Ratio

Active
$207,000
4
bds
|
0
ba
|
1,700
sqft
|
built
1922
3565 N 14th St, Milwaukee, WI 53206
$-249
Cash flow
-6.3%
Cash-on-Cash Return
4.7%
Cap rate
0.6%
Rent to Value Ratio
Active
$249,900
3
bds
|
0
ba
|
1,419
sqft
|
built
1967
2161 S 111th St, West Allis, WI 53227
$-358
Cash flow
-7.5%
Cash-on-Cash Return
4.4%
Cap rate
0.7%
Rent to Value Ratio

Active
$294,900
3
bds
|
0
ba
|
1,229
sqft
|
built
1955
428 W Allerton Ave, Milwaukee, WI 53207
$-712
Cash flow
-12.6%
Cash-on-Cash Return
3.3%
Cap rate
0.6%
Rent to Value Ratio

Active
$324,900
4
bds
|
0
ba
|
1,891
sqft
|
built
1959
3867 S Massachusetts Ave, Milwaukee, WI 53220
$-756
Cash flow
-12.1%
Cash-on-Cash Return
3.4%
Cap rate
0.7%
Rent to Value Ratio

Active
$275,000
5
bds
|
0
ba
|
1,407
sqft
|
built
1942
6723 W Howard Ave, Milwaukee, WI 53220
$-478
Cash flow
-9.1%
Cash-on-Cash Return
4.1%
Cap rate
0.7%
Rent to Value Ratio
Active
$299,900
3
bds
|
0
ba
|
1,433
sqft
|
built
1950
735 S 110th St, West Allis, WI 53214
$-765
Cash flow
-13.3%
Cash-on-Cash Return
3.1%
Cap rate
0.5%
Rent to Value Ratio
Active
$575,000
5
bds
|
0
ba
|
3,000
sqft
|
built
1936
4892 N Mohawk Ave, Glendale, WI 53217
$-1,645
Cash flow
-14.9%
Cash-on-Cash Return
2.7%
Cap rate
0.5%
Rent to Value Ratio

Active
$1,449,000
6
bds
|
0
ba
|
5,923
sqft
|
built
1895
2701 N Lake Dr, Milwaukee, WI 53211
$-7,602
Cash flow
-27.4%
Cash-on-Cash Return
-0.1%
Cap rate
0.2%
Rent to Value Ratio

Active
$325,000
3
bds
|
0
ba
|
1,411
sqft
|
built
1967
5134 S 19th St, Milwaukee, WI 53221
$-804
Cash flow
-12.9%
Cash-on-Cash Return
3.2%
Cap rate
0.6%
Rent to Value Ratio

Active
$175,000
4
bds
|
0
ba
|
1,720
sqft
|
built
1922
2976 N 40th St, Milwaukee, WI 53210
$-127
Cash flow
-3.8%
Cash-on-Cash Return
5.3%
Cap rate
0.8%
Rent to Value Ratio

Active
$299,900
1
bds
|
0
ba
|
1,400
sqft
|
built
1903
1442 N Franklin Pl, Milwaukee, WI 53202
$-768
Cash flow
-13.4%
Cash-on-Cash Return
3.1%
Cap rate
0.7%
Rent to Value Ratio

Active
$114,900
4
bds
|
0
ba
|
2,266
sqft
|
built
1924
1925 N 27th St, Milwaukee, WI 53208
$-2
Cash flow
-0.1%
Cash-on-Cash Return
6.1%
Cap rate
0.9%
Rent to Value Ratio

Active
$214,900
1
bds
|
0
ba
|
897
sqft
|
built
1913
771 N Water St, Milwaukee, WI 53202
$-626
Cash flow
-15.2%
Cash-on-Cash Return
2.7%
Cap rate
0.7%
Rent to Value Ratio