Milwaukee County Investment Properties for Sale
Browse homes for sale and investment properties in Milwaukee County. Refine your search by price, property type, or more.
Best cash flowing properties in Milwaukee County

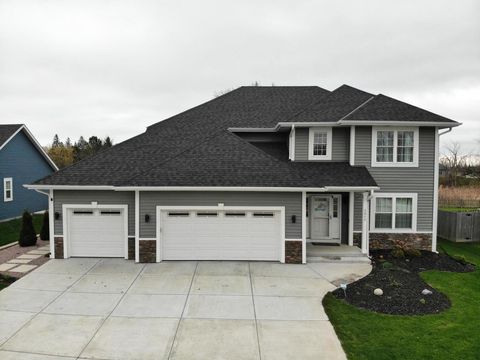
Active
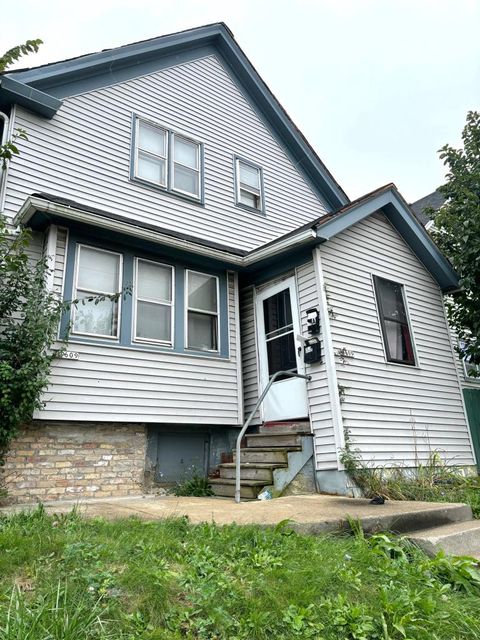
$124,900
4
bds
|
0
ba
|
2,344
sqft
|
built
1928
4465 N 27th St, Milwaukee, WI 53209
$98
Cash flow
4.1%
Cash-on-Cash Return
7.1%
Cap rate
1.0%
Rent to Value Ratio
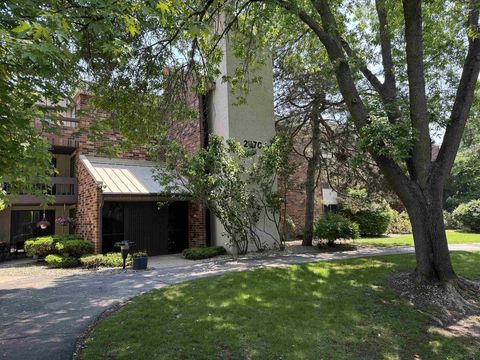
Active
$139,900
1
bds
|
0
ba
|
750
sqft
|
built
1972
2470 W Good Hope Rd, Glendale, WI 53209
$-21
Cash flow
-0.8%
Cash-on-Cash Return
6.0%
Cap rate
0.9%
Rent to Value Ratio
1,168 out of 1,795 properties for sale in Milwaukee County
Limited Results Shown
Create a free account, or log in to reveal all property listings and enjoy the complete experience.
Active
$114,900
3
bds
|
0
ba
|
1,418
sqft
|
built
1885
2635 N 6th St, Milwaukee, WI 53212
$-89
Cash flow
-4.0%
Cash-on-Cash Return
5.2%
Cap rate
0.8%
Rent to Value Ratio
Active
$299,900
3
bds
|
0
ba
|
1,438
sqft
|
built
1977
8534 N 68th St, Brown Deer, WI 53223
$-439
Cash flow
-7.6%
Cash-on-Cash Return
4.4%
Cap rate
0.7%
Rent to Value Ratio

Active
$275,000
3
bds
|
0
ba
|
1,219
sqft
|
built
1979
9073 N Joyce Ave, Milwaukee, WI 53224
$-691
Cash flow
-13.1%
Cash-on-Cash Return
3.1%
Cap rate
0.6%
Rent to Value Ratio

Active
$399,900
5
bds
|
0
ba
|
1,948
sqft
|
built
1984
655 E Mackinac Ave, Oak Creek, WI 53154
$-785
Cash flow
-10.2%
Cash-on-Cash Return
3.8%
Cap rate
0.6%
Rent to Value Ratio

Active
$269,900
5
bds
|
0
ba
|
1,457
sqft
|
built
1955
6147 W Stack Ct, Milwaukee, WI 53219
$-564
Cash flow
-10.9%
Cash-on-Cash Return
3.6%
Cap rate
0.7%
Rent to Value Ratio

Active
$169,900
3
bds
|
0
ba
|
994
sqft
|
built
1948
3760 N 60th St, Milwaukee, WI 53216
$-111
Cash flow
-3.4%
Cash-on-Cash Return
5.4%
Cap rate
0.8%
Rent to Value Ratio

Active
$159,500
3
bds
|
0
ba
|
902
sqft
|
built
1957
5810 N 63rd St, Milwaukee, WI 53218
$-195
Cash flow
-6.4%
Cash-on-Cash Return
4.7%
Cap rate
0.8%
Rent to Value Ratio
Active
$164,999
2
bds
|
0
ba
|
925
sqft
|
built
1957
4300 N 73rd St, Milwaukee, WI 53216
$-217
Cash flow
-6.9%
Cash-on-Cash Return
4.6%
Cap rate
0.8%
Rent to Value Ratio

Active
$224,900
3
bds
|
0
ba
|
1,044
sqft
|
built
1953
3416 S 66th St, Milwaukee, WI 53219
$-392
Cash flow
-9.1%
Cash-on-Cash Return
4.1%
Cap rate
0.7%
Rent to Value Ratio

Active
$439,900
6
bds
|
0
ba
|
2,054
sqft
|
built
1978
3872 S Whitnall Ave, Milwaukee, WI 53207
$-1,947
Cash flow
-23.1%
Cash-on-Cash Return
0.8%
Cap rate
0.3%
Rent to Value Ratio

Active
$350,000
6
bds
|
0
ba
|
2,312
sqft
|
built
1957
4453 S 20th St, Milwaukee, WI 53221
$-1,257
Cash flow
-18.7%
Cash-on-Cash Return
1.8%
Cap rate
0.4%
Rent to Value Ratio

Active
$279,900
4
bds
|
0
ba
|
1,561
sqft
|
built
1927
5613 W Notre Dame Ct, Milwaukee, WI 53208
$-644
Cash flow
-12.0%
Cash-on-Cash Return
3.4%
Cap rate
0.6%
Rent to Value Ratio

Active
$845,000
4
bds
|
0
ba
|
2,909
sqft
|
built
1915
3921 N Stowell Ave, Milwaukee, WI 53211
$-2,968
Cash flow
-18.3%
Cash-on-Cash Return
1.9%
Cap rate
0.4%
Rent to Value Ratio

Active
$210,000
5
bds
|
0
ba
|
2,074
sqft
|
built
1922
2756 N 45th St, Milwaukee, WI 53210
$-145
Cash flow
-3.6%
Cash-on-Cash Return
5.3%
Cap rate
0.8%
Rent to Value Ratio

Active
$239,900
2
bds
|
0
ba
|
1,118
sqft
|
built
1914
2167 N 52nd St, Milwaukee, WI 53208
$-529
Cash flow
-11.5%
Cash-on-Cash Return
3.5%
Cap rate
0.6%
Rent to Value Ratio

Active
$209,500
1
bds
|
0
ba
|
653
sqft
|
built
1921
215 W Maple St, Milwaukee, WI 53204
$-546
Cash flow
-13.6%
Cash-on-Cash Return
3.0%
Cap rate
0.6%
Rent to Value Ratio

Active
$249,900
5
bds
|
0
ba
|
1,584
sqft
|
built
1960
4540 N 71st St, Milwaukee, WI 53218
$-655
Cash flow
-13.7%
Cash-on-Cash Return
3.0%
Cap rate
0.6%
Rent to Value Ratio
Active
$124,900
4
bds
|
0
ba
|
2,344
sqft
|
built
1928
4465 N 27th St, Milwaukee, WI 53209
$98
Cash flow
4.1%
Cash-on-Cash Return
7.1%
Cap rate
1.0%
Rent to Value Ratio

Active
$365,000
2
bds
|
0
ba
|
1,635
sqft
|
built
1948
1625 W Green Tree Rd, Glendale, WI 53209
$-1,099
Cash flow
-15.7%
Cash-on-Cash Return
2.5%
Cap rate
0.5%
Rent to Value Ratio
Active
$139,900
1
bds
|
0
ba
|
750
sqft
|
built
1972
2470 W Good Hope Rd, Glendale, WI 53209
$-21
Cash flow
-0.8%
Cash-on-Cash Return
6.0%
Cap rate
0.9%
Rent to Value Ratio

Active
$350,000
4
bds
|
0
ba
|
2,215
sqft
|
built
1950
2728 N 90th St, Milwaukee, WI 53222
$-919
Cash flow
-13.7%
Cash-on-Cash Return
3.0%
Cap rate
0.6%
Rent to Value Ratio

Active
$94,900
1
bds
|
0
ba
|
625
sqft
|
built
1971
11926 W Mill Rd, Milwaukee, WI 53225
$-139
Cash flow
-7.6%
Cash-on-Cash Return
4.4%
Cap rate
0.8%
Rent to Value Ratio

Active
$495,000
4
bds
|
0
ba
|
3,110
sqft
|
built
2011
9318 W Mt Zion Dr, Milwaukee, WI 53224
$-1,100
Cash flow
-11.6%
Cash-on-Cash Return
3.5%
Cap rate
0.7%
Rent to Value Ratio
Active
$589,990
4
bds
|
0
ba
|
2,473
sqft
|
built
2020
3977 E Oakwood Rd, Oak Creek, WI 53154
$-1,536
Cash flow
-13.6%
Cash-on-Cash Return
3.0%
Cap rate
0.5%
Rent to Value Ratio
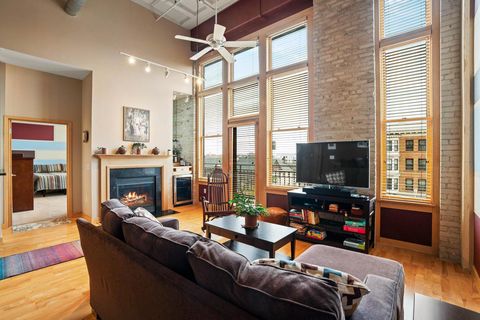
Active
$495,000
2
bds
|
0
ba
|
1,329
sqft
|
built
1922
1325 N Van Buren St, Milwaukee, WI 53202
$-1,977
Cash flow
-20.8%
Cash-on-Cash Return
1.4%
Cap rate
0.4%
Rent to Value Ratio
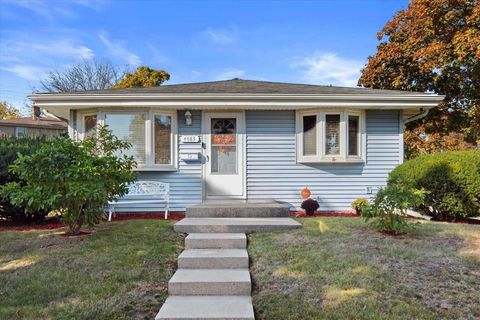
Active
$255,000
3
bds
|
0
ba
|
1,284
sqft
|
built
1959
4683 N 80th St, Milwaukee, WI 53218
$-450
Cash flow
-9.2%
Cash-on-Cash Return
4.0%
Cap rate
0.7%
Rent to Value Ratio

Active
$229,900
3
bds
|
0
ba
|
1,156
sqft
|
built
1963
6437 N 47th St, Milwaukee, WI 53223
$-537
Cash flow
-12.2%
Cash-on-Cash Return
3.3%
Cap rate
0.6%
Rent to Value Ratio

Active
$239,000
4
bds
|
0
ba
|
1,200
sqft
|
built
1972
5709 N 73rd St, Milwaukee, WI 53218
$-452
Cash flow
-9.9%
Cash-on-Cash Return
3.9%
Cap rate
0.6%
Rent to Value Ratio

Active
$334,900
1
bds
|
0
ba
|
858
sqft
|
built
2007
106 W Seeboth St, Milwaukee, WI 53204
$-1,218
Cash flow
-19.0%
Cash-on-Cash Return
1.8%
Cap rate
0.5%
Rent to Value Ratio

Active
$137,000
2
bds
|
0
ba
|
1,056
sqft
|
built
1971
11946 W Mill Rd, Milwaukee, WI 53225
$-160
Cash flow
-6.1%
Cash-on-Cash Return
4.7%
Cap rate
0.8%
Rent to Value Ratio
Active
$155,000
4
bds
|
0
ba
|
2,236
sqft
|
built
1926
2477 N 49th St, Milwaukee, WI 53210
$-481
Cash flow
-16.2%
Cash-on-Cash Return
2.4%
Cap rate
0.5%
Rent to Value Ratio

Active
$212,500
4
bds
|
0
ba
|
2,041
sqft
|
built
1930
5733 W Philip Pl, Milwaukee, WI 53216
$-667
Cash flow
-16.4%
Cash-on-Cash Return
2.4%
Cap rate
0.5%
Rent to Value Ratio
Active
$118,000
4
bds
|
0
ba
|
1,450
sqft
|
built
1918
3609 W Hampton Ave, Milwaukee, WI 53209
$-148
Cash flow
-6.5%
Cash-on-Cash Return
4.6%
Cap rate
0.8%
Rent to Value Ratio

Active
$189,900
4
bds
|
0
ba
|
1,758
sqft
|
built
1928
6616 N 56th St, Milwaukee, WI 53223
$-420
Cash flow
-11.5%
Cash-on-Cash Return
3.5%
Cap rate
0.5%
Rent to Value Ratio

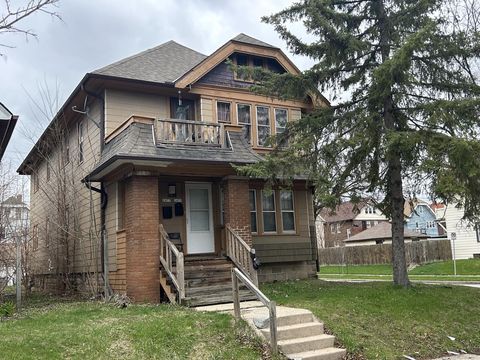
Active
$469,900
3
bds
|
0
ba
|
1,294
sqft
|
built
1900
1922 E Iron St, Milwaukee, WI 53207
$-1,491
Cash flow
-16.6%
Cash-on-Cash Return
2.3%
Cap rate
0.5%
Rent to Value Ratio

Active
$139,900
2
bds
|
0
ba
|
953
sqft
|
built
1913
4813 N 36th St, Milwaukee, WI 53209
$-42
Cash flow
-1.6%
Cash-on-Cash Return
5.8%
Cap rate
0.8%
Rent to Value Ratio

Active
$130,000
5
bds
|
0
ba
|
1,678
sqft
|
built
1910
2768 N 34th St, Milwaukee, WI 53210
$-44
Cash flow
-1.8%
Cash-on-Cash Return
5.7%
Cap rate
0.8%
Rent to Value Ratio

Active
$349,900
5
bds
|
0
ba
|
2,080
sqft
|
built
1891
1932 N Warren Ave, Milwaukee, WI 53202
$-1,710
Cash flow
-25.5%
Cash-on-Cash Return
0.3%
Cap rate
0.3%
Rent to Value Ratio

Active
$225,000
4
bds
|
0
ba
|
1,934
sqft
|
built
1890
839 N 22nd St, Milwaukee, WI 53233
$-474
Cash flow
-11.0%
Cash-on-Cash Return
3.6%
Cap rate
0.7%
Rent to Value Ratio

Active
$250,000
3
bds
|
0
ba
|
1,200
sqft
|
built
1966
5804 W Boehlke Ave, Milwaukee, WI 53223
$-425
Cash flow
-8.9%
Cash-on-Cash Return
4.1%
Cap rate
0.7%
Rent to Value Ratio