Milwaukee County Investment Properties for Sale
Browse homes for sale and investment properties in Milwaukee County. Refine your search by price, property type, or more.
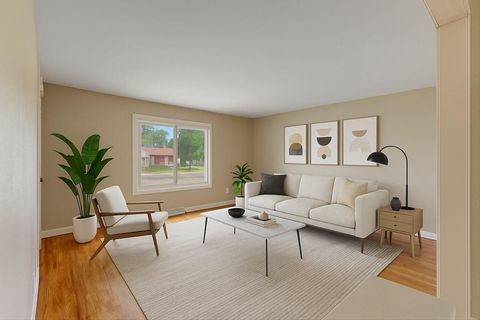
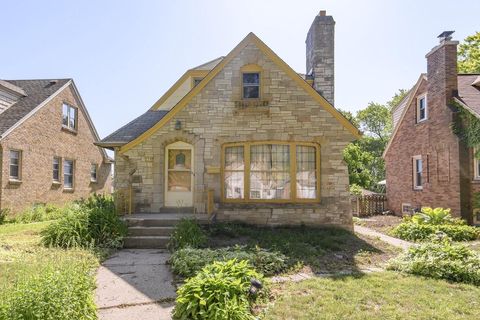
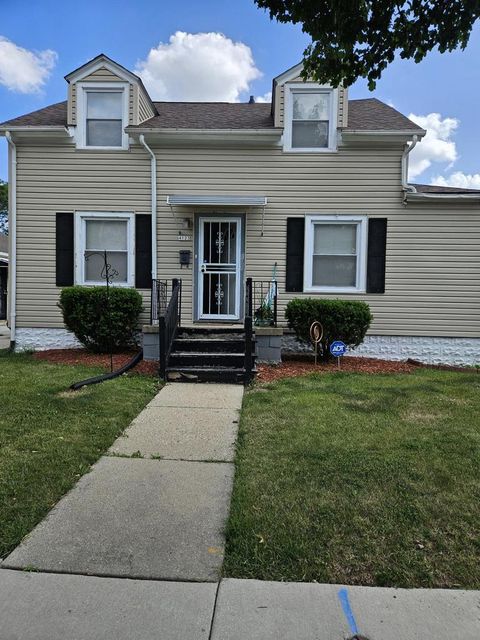
Best cash flowing properties in Milwaukee County

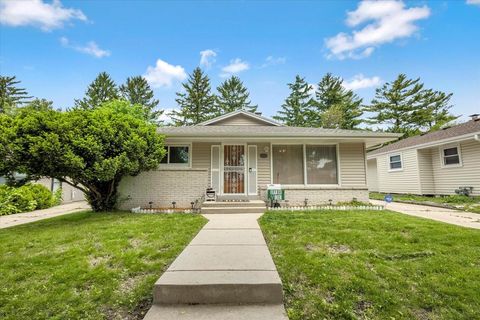
Active
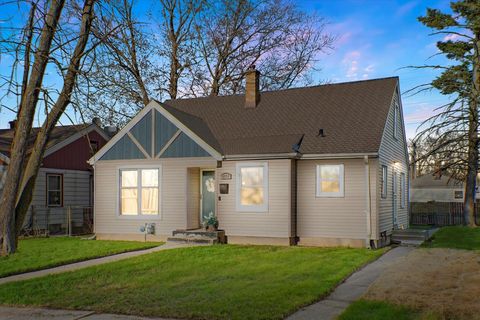
$97,500
2
bds
|
0
ba
|
1,040
sqft
|
built
1974
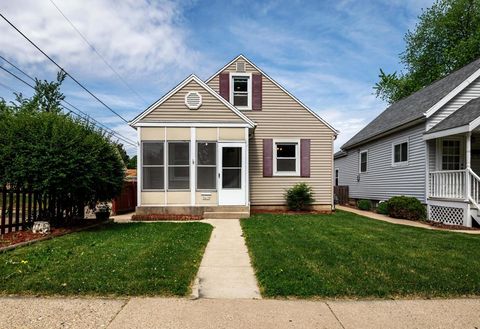
8619 N Servite Dr, Milwaukee, WI 53223
$320
Cash flow
17.1%
Cash-on-Cash Return
10.1%
Cap rate
1.4%
Rent to Value Ratio
Active
$110,000
1
bds
|
0
ba
|
863
sqft
|
built
1974
9002 W Lisbon Ave, Milwaukee, WI 53222
$129
Cash flow
6.1%
Cash-on-Cash Return
7.5%
Cap rate
1.1%
Rent to Value Ratio
1,168 out of 1,795 properties for sale in Milwaukee County
Limited Results Shown
Create a free account, or log in to reveal all property listings and enjoy the complete experience.
Active
$315,000
2
bds
|
0
ba
|
1,140
sqft
|
built
2008
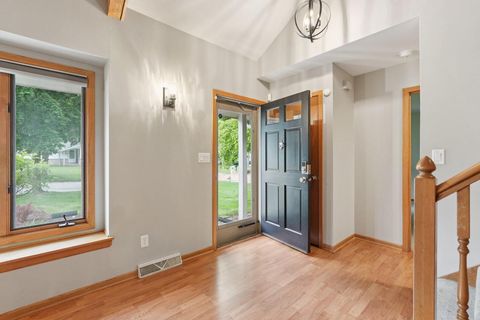
1541 N Jefferson St, Milwaukee, WI 53202
$-831
Cash flow
-13.8%
Cash-on-Cash Return
3.0%
Cap rate
0.6%
Rent to Value Ratio
Active
$99,000
4
bds
|
0
ba
|
1,860
sqft
|
built
1923
1920 W Vienna Ave, Milwaukee, WI 53206
$-71
Cash flow
-3.7%
Cash-on-Cash Return
5.3%
Cap rate
0.9%
Rent to Value Ratio
Active
$185,000
4
bds
|
0
ba
|
2,288
sqft
|
built
1926
3733 W Sarnow St, Milwaukee, WI 53208
$-314
Cash flow
-8.9%
Cash-on-Cash Return
4.1%
Cap rate
0.6%
Rent to Value Ratio
Active
$169,900
4
bds
|
0
ba
|
1,543
sqft
|
built
1973
3918 W Hampton Ave, Milwaukee, WI 53209
$-99
Cash flow
-3.0%
Cash-on-Cash Return
5.4%
Cap rate
0.8%
Rent to Value Ratio
Active
$219,900
4
bds
|
0
ba
|
1,464
sqft
|
built
1940
3940 N 64th St, Milwaukee, WI 53216
$-405
Cash flow
-9.6%
Cash-on-Cash Return
3.9%
Cap rate
0.6%
Rent to Value Ratio
Active
$335,000
4
bds
|
0
ba
|
1,820
sqft
|
built
1956
5110 W Cleveland Ave, Milwaukee, WI 53219
$-795
Cash flow
-12.4%
Cash-on-Cash Return
3.3%
Cap rate
0.6%
Rent to Value Ratio
Active
$175,000
3
bds
|
0
ba
|
1,268
sqft
|
built
1922
4123 W Fairmount Ave, Milwaukee, WI 53209
$-146
Cash flow
-4.4%
Cash-on-Cash Return
5.1%
Cap rate
0.8%
Rent to Value Ratio
Active
$224,900
3
bds
|
0
ba
|
1,618
sqft
|
built
1963
4720 W Brentwood Ave, Milwaukee, WI 53223
$-434
Cash flow
-10.1%
Cash-on-Cash Return
3.8%
Cap rate
0.6%
Rent to Value Ratio
Active
$339,900
3
bds
|
0
ba
|
1,600
sqft
|
built
1947
3057 N 90th St, Milwaukee, WI 53222
$-775
Cash flow
-11.9%
Cash-on-Cash Return
3.4%
Cap rate
0.6%
Rent to Value Ratio
Active
$329,000
6
bds
|
0
ba
|
2,719
sqft
|
built
1928
3402 N 51st Blvd, Milwaukee, WI 53216
$-1,045
Cash flow
-16.6%
Cash-on-Cash Return
2.3%
Cap rate
0.4%
Rent to Value Ratio
Active
$325,000
4
bds
|
0
ba
|
1,120
sqft
|
built
1926
203 N 71st St, Milwaukee, WI 53213
$-966
Cash flow
-15.5%
Cash-on-Cash Return
2.6%
Cap rate
0.5%
Rent to Value Ratio
Active
$368,000
2
bds
|
0
ba
|
1,512
sqft
|
built
1888
1626 N Warren Ave, Milwaukee, WI 53202
$-1,226
Cash flow
-17.4%
Cash-on-Cash Return
2.1%
Cap rate
0.4%
Rent to Value Ratio
Active
$159,900
2
bds
|
0
ba
|
792
sqft
|
built
1951
5625 N 57th St, Milwaukee, WI 53218
$-280
Cash flow
-9.1%
Cash-on-Cash Return
4.0%
Cap rate
0.6%
Rent to Value Ratio
Active
$300,000
3
bds
|
0
ba
|
864
sqft
|
built
1956
4945 W Tesch Ave, Milwaukee, WI 53220
$-969
Cash flow
-16.9%
Cash-on-Cash Return
2.3%
Cap rate
0.5%
Rent to Value Ratio
Active
$310,000
4
bds
|
0
ba
|
1,670
sqft
|
built
1959
3268 W Birchwood Ave, Milwaukee, WI 53221
$-815
Cash flow
-13.7%
Cash-on-Cash Return
3.0%
Cap rate
0.6%
Rent to Value Ratio
Active
$289,900
3
bds
|
0
ba
|
1,274
sqft
|
built
1952
3619 S Herman St, Milwaukee, WI 53207
$-832
Cash flow
-15.0%
Cash-on-Cash Return
2.7%
Cap rate
0.6%
Rent to Value Ratio
Active
$119,900
2
bds
|
0
ba
|
919
sqft
|
built
1951
6148 N 38th St, Milwaukee, WI 53209
$1
Cash flow
0.0%
Cash-on-Cash Return
6.2%
Cap rate
0.9%
Rent to Value Ratio
Active
$330,000
4
bds
|
0
ba
|
1,551
sqft
|
built
1880
3118 N Bartlett Ave, Milwaukee, WI 53211
$-649
Cash flow
-10.3%
Cash-on-Cash Return
3.8%
Cap rate
0.7%
Rent to Value Ratio
Active
$194,900
5
bds
|
0
ba
|
1,718
sqft
|
built
1920
3715 N 2nd St, Milwaukee, WI 53212
$-515
Cash flow
-13.8%
Cash-on-Cash Return
3.0%
Cap rate
0.5%
Rent to Value Ratio
Active
$239,900
3
bds
|
0
ba
|
2,045
sqft
|
built
1958
3838 N 78th St, Milwaukee, WI 53222
$-494
Cash flow
-10.7%
Cash-on-Cash Return
3.7%
Cap rate
0.7%
Rent to Value Ratio
Active
$110,000
1
bds
|
0
ba
|
863
sqft
|
built
1974
9002 W Lisbon Ave, Milwaukee, WI 53222
$129
Cash flow
6.1%
Cash-on-Cash Return
7.5%
Cap rate
1.1%
Rent to Value Ratio
Active
$469,900
3
bds
|
0
ba
|
2,258
sqft
|
built
2016
7236 N Beau Ave, Milwaukee, WI 53224
$-1,404
Cash flow
-15.6%
Cash-on-Cash Return
2.6%
Cap rate
0.5%
Rent to Value Ratio
Active
$425,900
bds
|
0
ba
|
0
sqft
|
built
1947
3910 N Sherman Blvd, Milwaukee, WI 53216
$-1,787
Cash flow
-21.9%
Cash-on-Cash Return
1.1%
Cap rate
0.3%
Rent to Value Ratio
Active
$374,900
3
bds
|
0
ba
|
1,973
sqft
|
built
1959
7101 W Tripoli Ave, Milwaukee, WI 53220
$-1,038
Cash flow
-14.4%
Cash-on-Cash Return
2.8%
Cap rate
0.5%
Rent to Value Ratio
Active
$97,500
2
bds
|
0
ba
|
1,040
sqft
|
built
1974
8619 N Servite Dr, Milwaukee, WI 53223
$320
Cash flow
17.1%
Cash-on-Cash Return
10.1%
Cap rate
1.4%
Rent to Value Ratio
Active
$389,622
3
bds
|
0
ba
|
1,989
sqft
|
built
1991
9312 W Clovernook St, Milwaukee, WI 53224
$-1,062
Cash flow
-14.2%
Cash-on-Cash Return
2.9%
Cap rate
0.6%
Rent to Value Ratio
Active
$229,900
3
bds
|
0
ba
|
1,364
sqft
|
built
1860
2470 N Buffum St, Milwaukee, WI 53212
$-274
Cash flow
-6.2%
Cash-on-Cash Return
4.7%
Cap rate
0.7%
Rent to Value Ratio
Active
$219,900
3
bds
|
0
ba
|
1,026
sqft
|
built
1955
4349 N 80th St, Milwaukee, WI 53222
$-282
Cash flow
-6.7%
Cash-on-Cash Return
4.6%
Cap rate
0.7%
Rent to Value Ratio

Active
$190,000
7
bds
|
0
ba
|
2,884
sqft
|
built
1902
2018 S 28th St, Milwaukee, WI 53215
$-359
Cash flow
-9.9%
Cash-on-Cash Return
3.9%
Cap rate
0.7%
Rent to Value Ratio

Active
$679,900
4
bds
|
0
ba
|
2,800
sqft
|
built
1911
2627 N Farwell Ave, Milwaukee, WI 53211
$-3,322
Cash flow
-25.5%
Cash-on-Cash Return
0.3%
Cap rate
0.2%
Rent to Value Ratio
Active
$99,000
3
bds
|
0
ba
|
888
sqft
|
built
1900
3513 N 25th St, Milwaukee, WI 53206
$83
Cash flow
4.4%
Cash-on-Cash Return
7.2%
Cap rate
1.0%
Rent to Value Ratio
Active
$175,000
3
bds
|
0
ba
|
1,176
sqft
|
built
1953
4820 N 65th St, Milwaukee, WI 53218
$-140
Cash flow
-4.2%
Cash-on-Cash Return
5.2%
Cap rate
0.8%
Rent to Value Ratio
Active
$359,900
3
bds
|
0
ba
|
1,632
sqft
|
built
1960
10544 S Nicholson Rd, Oak Creek, WI 53154
$-1,464
Cash flow
-21.2%
Cash-on-Cash Return
1.3%
Cap rate
0.3%
Rent to Value Ratio
Active
$434,900
5
bds
|
0
ba
|
2,464
sqft
|
built
1918
1829 N 52nd St, Milwaukee, WI 53208
$-1,246
Cash flow
-14.9%
Cash-on-Cash Return
2.7%
Cap rate
0.5%
Rent to Value Ratio

Active
$106,000
4
bds
|
0
ba
|
1,092
sqft
|
built
1923
3007 N 29th St, Milwaukee, WI 53210
$-2
Cash flow
-0.1%
Cash-on-Cash Return
6.1%
Cap rate
0.9%
Rent to Value Ratio

Active
$299,900
3
bds
|
0
ba
|
1,522
sqft
|
built
1965
8611 W Grantosa Dr, Milwaukee, WI 53225
$-759
Cash flow
-13.2%
Cash-on-Cash Return
3.1%
Cap rate
0.6%
Rent to Value Ratio
Active
$299,900
3
bds
|
0
ba
|
1,260
sqft
|
built
1956
2675 S 71st St, Milwaukee, WI 53219
$-740
Cash flow
-12.9%
Cash-on-Cash Return
3.2%
Cap rate
0.6%
Rent to Value Ratio
Active
$175,000
3
bds
|
0
ba
|
1,227
sqft
|
built
1951
4950 N 21st St, Milwaukee, WI 53209
$-171
Cash flow
-5.1%
Cash-on-Cash Return
5.0%
Cap rate
0.8%
Rent to Value Ratio

Active
$131,500
5
bds
|
0
ba
|
1,909
sqft
|
built
1963
5957 N 64th St, Milwaukee, WI 53218
$-273
Cash flow
-10.8%
Cash-on-Cash Return
3.7%
Cap rate
0.8%
Rent to Value Ratio
Active
$269,900
3
bds
|
0
ba
|
1,360
sqft
|
built
1947
809 S 113th St, West Allis, WI 53214
$-429
Cash flow
-8.3%
Cash-on-Cash Return
4.2%
Cap rate
0.7%
Rent to Value Ratio