Wilmette, IL Investment Properties for Sale
Browse homes for sale and investment properties in Wilmette, IL. Refine your search by price, property type, or more.
Best cash flowing properties in Wilmette, IL
Active
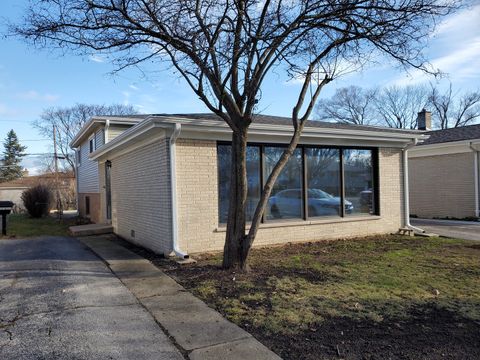
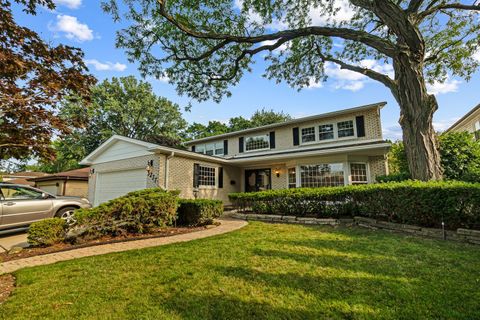
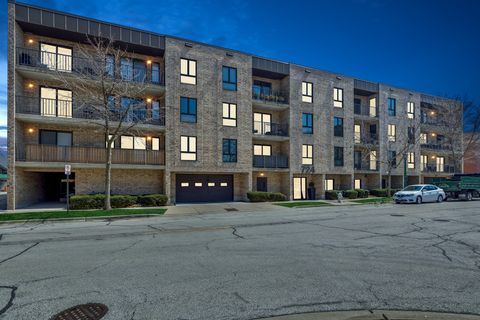
$525,000
3
bds
|
2
ba
|
1,260
sqft
|
built
1962
542 Laramie Ave, Wilmette, IL 60091
$-631
Cash flow
-6.3%
Cash-on-Cash Return
4.2%
Cap rate
0.7%
Rent to Value Ratio
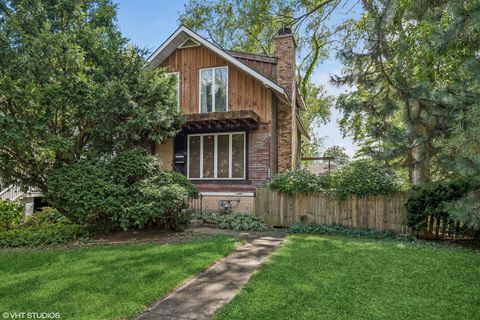
Active
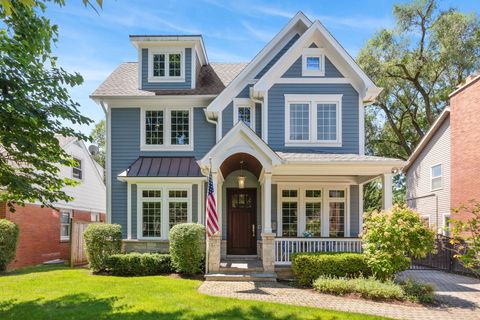
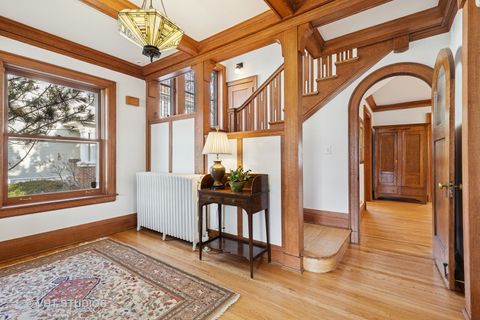
$750,000
3
bds
|
2
ba
|
1,345
sqft
|
built
1908
1531 Wilmette Ave, Wilmette, IL 60091
$-1,064
Cash flow
-7.4%
Cash-on-Cash Return
4.0%
Cap rate
0.6%
Rent to Value Ratio
10 out of 10 properties for sale in Wilmette, IL
Limited Results Shown
Create a free account, or log in to reveal all property listings and enjoy the complete experience.
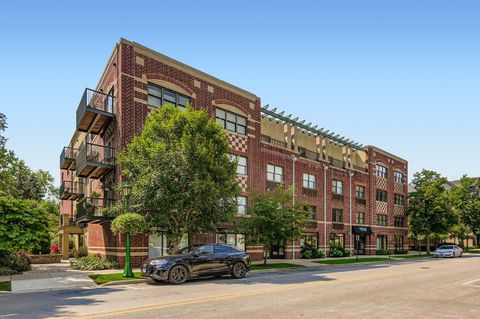
Active
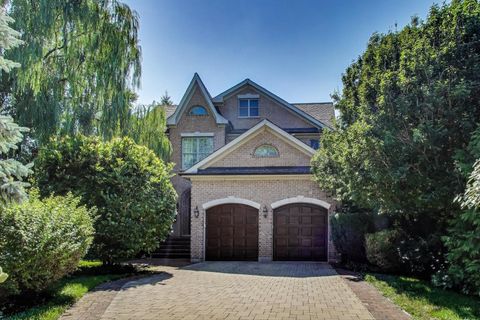
$600,000
2
bds
|
2
ba
|
1,680
sqft
|
built
1998
1107 Greenleaf Ave, Wilmette, IL 60091
$-1,888
Cash flow
-16.4%
Cash-on-Cash Return
1.9%
Cap rate
0.6%
Rent to Value Ratio
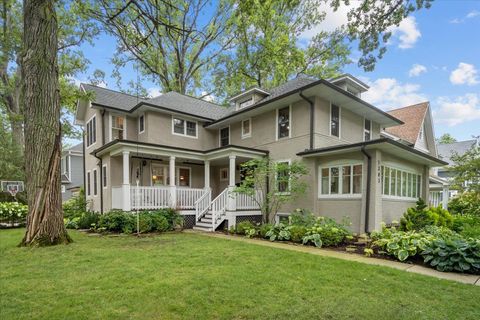
Active
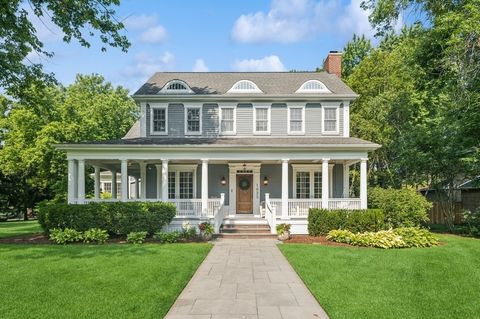
$1,695,000
5
bds
|
4
ba
|
0
sqft
|
built
1910
1303 Maple Ave, Wilmette, IL 60091
$-6,349
Cash flow
-19.5%
Cash-on-Cash Return
1.2%
Cap rate
0.3%
Rent to Value Ratio
Active
$1,190,000
5
bds
|
5
ba
|
4,305
sqft
|
built
1966
3227 Greenleaf Ave, Wilmette, IL 60091
$-2,848
Cash flow
-12.5%
Cash-on-Cash Return
2.8%
Cap rate
0.5%
Rent to Value Ratio
Active
$1,799,000
5
bds
|
6
ba
|
0
sqft
|
built
2014
923 Harvard Ln, Wilmette, IL 60091
$-6,398
Cash flow
-18.6%
Cash-on-Cash Return
1.4%
Cap rate
0.4%
Rent to Value Ratio
Active
$1,639,000
4
bds
|
6
ba
|
5,892
sqft
|
built
2006
901 Pontiac Rd, Wilmette, IL 60091
$-4,981
Cash flow
-15.9%
Cash-on-Cash Return
2.0%
Cap rate
0.4%
Rent to Value Ratio
Active
$2,950,000
5
bds
|
7
ba
|
8,506
sqft
|
built
2001
1025 Mohawk Rd, Wilmette, IL 60091
$-13,449
Cash flow
-23.8%
Cash-on-Cash Return
0.2%
Cap rate
0.2%
Rent to Value Ratio
Active
$449,900
3
bds
|
3
ba
|
2,040
sqft
|
built
1989
724 12th St, Wilmette, IL 60091
$-1,334
Cash flow
-15.5%
Cash-on-Cash Return
2.1%
Cap rate
0.7%
Rent to Value Ratio
Active
$2,495,000
6
bds
|
6
ba
|
5,669
sqft
|
built
1905
1118 Forest Ave, Wilmette, IL 60091
$-8,610
Cash flow
-18.0%
Cash-on-Cash Return
1.5%
Cap rate
0.4%
Rent to Value Ratio