33141 Investment Properties for Sale
Browse homes for sale and investment properties in 33141. Refine your search by price, property type, or more.
Best cash flowing properties in 33141
Active
$224,900
1
bds
|
1
ba
|
705
sqft
|
built
1967
1770 79th Street Cswy, North Bay Village, FL 33141
$-320
Cash flow
-7.4%
Cash-on-Cash Return
4.4%
Cap rate
0.9%
Rent to Value Ratio

Active
$224,900
1
bds
|
1
ba
|
695
sqft
|
built
1965
1790 79th Street Cswy, North Bay Village, FL 33141
$-344
Cash flow
-8.0%
Cash-on-Cash Return
4.3%
Cap rate
0.9%
Rent to Value Ratio
414 out of 459 properties for sale in 33141
Limited Results Shown
Create a free account, or log in to reveal all property listings and enjoy the complete experience.
Active
$419,000
2
bds
|
2
ba
|
1,175
sqft
|
built
1980
7801 Abbott Ave, Miami Beach, FL 33141
$-825
Cash flow
-10.3%
Cash-on-Cash Return
3.8%
Cap rate
0.7%
Rent to Value Ratio
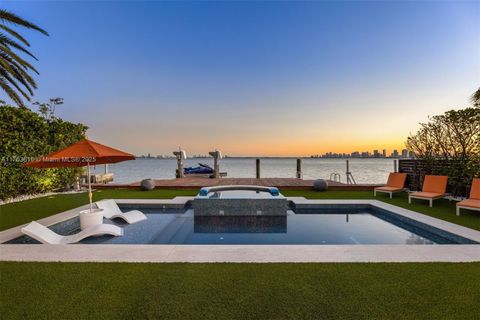
Active
$12,900,000
5
bds
|
7
ba
|
6,408
sqft
|
built
1968
7960 Biscayne Point Cir, Miami Beach, FL 33141
$-76,957
Cash flow
-31.1%
Cash-on-Cash Return
-1.0%
Cap rate
0.1%
Rent to Value Ratio
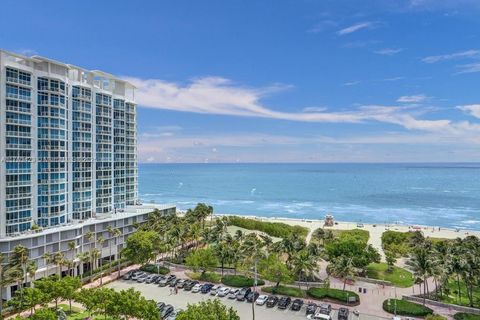
Active
$1,255,000
2
bds
|
2
ba
|
1,420
sqft
|
built
2008
6799 Collins Ave, Miami Beach, FL 33141
$-2,516
Cash flow
-10.5%
Cash-on-Cash Return
3.7%
Cap rate
0.7%
Rent to Value Ratio
Active
$439,000
2
bds
|
2
ba
|
1,030
sqft
|
built
1987
7601 E Treasure Dr, North Bay Village, FL 33141
$-1,090
Cash flow
-13.0%
Cash-on-Cash Return
3.2%
Cap rate
0.7%
Rent to Value Ratio
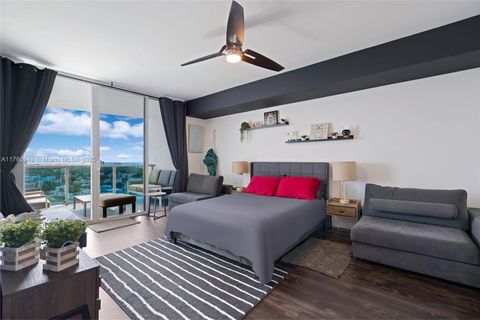
Active
$604,000
1
bds
|
1
ba
|
530
sqft
|
built
2013
6700 Indian Creek Dr, Miami Beach, FL 33141
$-2,500
Cash flow
-21.6%
Cash-on-Cash Return
1.2%
Cap rate
0.5%
Rent to Value Ratio
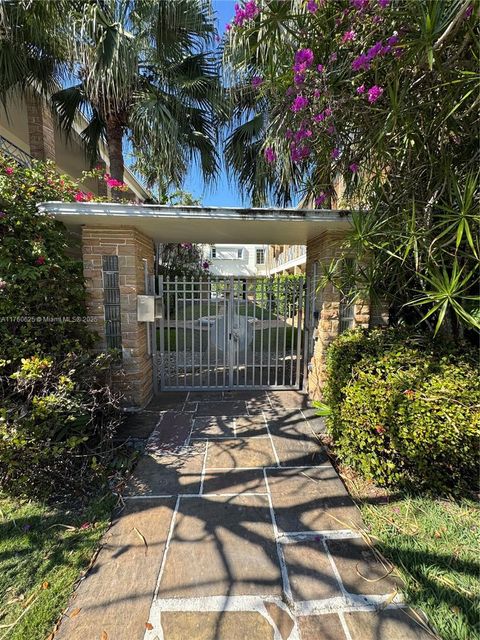
Active
$449,000
2
bds
|
2
ba
|
1,129
sqft
|
built
1964
7441 Wayne Ave, Miami Beach, FL 33141
$-1,671
Cash flow
-19.4%
Cash-on-Cash Return
1.7%
Cap rate
0.6%
Rent to Value Ratio

Active
$595,000
2
bds
|
2
ba
|
1,458
sqft
|
built
2007
7901 Hispanola Ave, North Bay Village, FL 33141
$-2,258
Cash flow
-19.8%
Cash-on-Cash Return
1.6%
Cap rate
0.7%
Rent to Value Ratio

Active
$248,000
1
bds
|
1
ba
|
578
sqft
|
built
1949
655 83rd St, Miami Beach, FL 33141
$-1,005
Cash flow
-21.1%
Cash-on-Cash Return
1.3%
Cap rate
0.7%
Rent to Value Ratio
Active
$530,000
2
bds
|
2
ba
|
1,253
sqft
|
built
2003
1625 79th Street Cswy, North Bay Village, FL 33141
$-1,605
Cash flow
-15.8%
Cash-on-Cash Return
2.5%
Cap rate
0.7%
Rent to Value Ratio
Active
$509,999
2
bds
|
2
ba
|
1,223
sqft
|
built
2007
7900 Harbor Island Dr, North Bay Village, FL 33141
$-1,444
Cash flow
-14.8%
Cash-on-Cash Return
2.7%
Cap rate
0.8%
Rent to Value Ratio
Active
$339,000
2
bds
|
2
ba
|
1,021
sqft
|
built
1953
7712 Byron Ave, Miami Beach, FL 33141
$-467
Cash flow
-7.2%
Cash-on-Cash Return
4.5%
Cap rate
0.7%
Rent to Value Ratio

Active
$1,100,000
2
bds
|
2
ba
|
1,805
sqft
|
built
1976
6423 Collins Ave, Miami Beach, FL 33141
$-4,696
Cash flow
-22.3%
Cash-on-Cash Return
1.0%
Cap rate
0.5%
Rent to Value Ratio

Active
$749,000
2
bds
|
2
ba
|
1,455
sqft
|
built
1970
7135 Collins Ave, Miami Beach, FL 33141
$-2,180
Cash flow
-15.2%
Cash-on-Cash Return
2.7%
Cap rate
0.7%
Rent to Value Ratio

Active
$1,550,000
2
bds
|
2
ba
|
1,322
sqft
|
built
2004
6365 Collins Ave, Miami Beach, FL 33141
$-4,647
Cash flow
-15.6%
Cash-on-Cash Return
2.5%
Cap rate
0.6%
Rent to Value Ratio
Active
$388,000
2
bds
|
2
ba
|
1,030
sqft
|
built
1987
7601 E Treasure Dr, North Bay Village, FL 33141
$-1,141
Cash flow
-15.3%
Cash-on-Cash Return
2.6%
Cap rate
0.8%
Rent to Value Ratio

Active
$789,000
2
bds
|
2
ba
|
1,540
sqft
|
built
1963
900 Bay Dr, Miami Beach, FL 33141
$-3,454
Cash flow
-22.8%
Cash-on-Cash Return
0.9%
Cap rate
0.6%
Rent to Value Ratio
Active
$165,000
bds
|
1
ba
|
394
sqft
|
built
1940
7928 Harding Ave, Miami Beach, FL 33141
$-445
Cash flow
-14.1%
Cash-on-Cash Return
2.9%
Cap rate
0.8%
Rent to Value Ratio
Active
$280,000
2
bds
|
2
ba
|
1,178
sqft
|
built
1966
1455 N Treasure Dr, North Bay Village, FL 33141
$-1,033
Cash flow
-19.2%
Cash-on-Cash Return
1.7%
Cap rate
0.9%
Rent to Value Ratio

Active
$599,000
2
bds
|
2
ba
|
1,274
sqft
|
built
2006
1881 79th Street Cswy, North Bay Village, FL 33141
$-2,992
Cash flow
-26.1%
Cash-on-Cash Return
0.2%
Cap rate
0.7%
Rent to Value Ratio

Active
$1,869,000
3
bds
|
3
ba
|
1,690
sqft
|
built
1996
6301 Collins Ave, Miami Beach, FL 33141
$-7,729
Cash flow
-21.6%
Cash-on-Cash Return
1.2%
Cap rate
0.5%
Rent to Value Ratio
Active
$509,999
2
bds
|
2
ba
|
1,251
sqft
|
built
2007
7910 Harbor Island Dr, North Bay Village, FL 33141
$-2,006
Cash flow
-20.5%
Cash-on-Cash Return
1.4%
Cap rate
0.7%
Rent to Value Ratio

Active
$620,000
2
bds
|
2
ba
|
1,326
sqft
|
built
1968
6770 Indian Creek Dr, Miami Beach, FL 33141
$-2,263
Cash flow
-19.0%
Cash-on-Cash Return
1.8%
Cap rate
0.7%
Rent to Value Ratio
Active
$850,000
3
bds
|
3
ba
|
1,358
sqft
|
built
2009
7930 East Dr, North Bay Village, FL 33141
$-3,715
Cash flow
-22.8%
Cash-on-Cash Return
0.9%
Cap rate
0.5%
Rent to Value Ratio
Active
$335,000
1
bds
|
2
ba
|
676
sqft
|
built
1971
6969 Collins Ave, Miami Beach, FL 33141
$-920
Cash flow
-14.3%
Cash-on-Cash Return
2.9%
Cap rate
0.7%
Rent to Value Ratio

Active
$235,000
1
bds
|
2
ba
|
799
sqft
|
built
1973
7900 Tatum Waterway Dr, Miami Beach, FL 33141
$-526
Cash flow
-11.7%
Cash-on-Cash Return
3.5%
Cap rate
1.0%
Rent to Value Ratio
Active
$345,000
3
bds
|
2
ba
|
1,240
sqft
|
built
1972
1801 S Treasure Dr, North Bay Village, FL 33141
$-1,343
Cash flow
-20.3%
Cash-on-Cash Return
1.5%
Cap rate
0.8%
Rent to Value Ratio
Active
$615,000
2
bds
|
2
ba
|
1,311
sqft
|
built
1981
6820 Indian Creek Dr, Miami Beach, FL 33141
$-1,490
Cash flow
-12.6%
Cash-on-Cash Return
3.2%
Cap rate
0.6%
Rent to Value Ratio
Active
$3,175,000
4
bds
|
3
ba
|
1,978
sqft
|
built
1949
7770 Hawthorne Ave, Miami Beach, FL 33141
$-11,340
Cash flow
-18.6%
Cash-on-Cash Return
1.9%
Cap rate
0.3%
Rent to Value Ratio
Active
$339,900
2
bds
|
2
ba
|
1,040
sqft
|
built
1961
1880 S Treasure Dr, North Bay Village, FL 33141
$-992
Cash flow
-15.2%
Cash-on-Cash Return
2.6%
Cap rate
0.8%
Rent to Value Ratio
Active
$2,299,000
4
bds
|
4
ba
|
3,721
sqft
|
built
2006
7934 West Dr, North Bay Village, FL 33141
$-9,891
Cash flow
-22.4%
Cash-on-Cash Return
1.0%
Cap rate
0.5%
Rent to Value Ratio
Active
$290,000
2
bds
|
2
ba
|
1,083
sqft
|
built
1970
1220 71st St, Miami Beach, FL 33141
$-711
Cash flow
-12.8%
Cash-on-Cash Return
3.2%
Cap rate
0.9%
Rent to Value Ratio
Active
$420,000
1
bds
|
1
ba
|
760
sqft
|
built
1969
7928 West Dr, North Bay Village, FL 33141
$-1,625
Cash flow
-20.2%
Cash-on-Cash Return
1.5%
Cap rate
0.6%
Rent to Value Ratio
Active
$6,930,000
4
bds
|
4
ba
|
4,315
sqft
|
built
1951
1690 Daytonia Rd, Miami Beach, FL 33141
$-31,921
Cash flow
-24.0%
Cash-on-Cash Return
0.6%
Cap rate
0.1%
Rent to Value Ratio
Active
$11,999,999
6
bds
|
7
ba
|
6,816
sqft
|
built
2016
1460 S Treasure Dr, North Bay Village, FL 33141
$-64,783
Cash flow
-28.2%
Cash-on-Cash Return
-0.3%
Cap rate
0.1%
Rent to Value Ratio
Active
$675,000
2
bds
|
3
ba
|
1,380
sqft
|
built
1968
6450 Collins Ave, Miami Beach, FL 33141
$-1,369
Cash flow
-10.6%
Cash-on-Cash Return
3.7%
Cap rate
0.6%
Rent to Value Ratio
Active
$629,000
2
bds
|
3
ba
|
1,470
sqft
|
built
2006
1881 79th Street Cswy, North Bay Village, FL 33141
$-3,701
Cash flow
-30.7%
Cash-on-Cash Return
-0.9%
Cap rate
0.7%
Rent to Value Ratio

Active
$435,000
2
bds
|
2
ba
|
1,030
sqft
|
built
1987
7601 E Treasure Dr, North Bay Village, FL 33141
$-1,206
Cash flow
-14.5%
Cash-on-Cash Return
2.8%
Cap rate
0.8%
Rent to Value Ratio
Active
$250,000
1
bds
|
1
ba
|
710
sqft
|
built
1947
2131 Calais Dr, Miami Beach, FL 33141
$-659
Cash flow
-13.8%
Cash-on-Cash Return
3.0%
Cap rate
0.9%
Rent to Value Ratio