Jefferson County Investment Properties for Sale
Browse homes for sale and investment properties in Jefferson County. Refine your search by price, property type, or more.
Best cash flowing properties in Jefferson County
Active
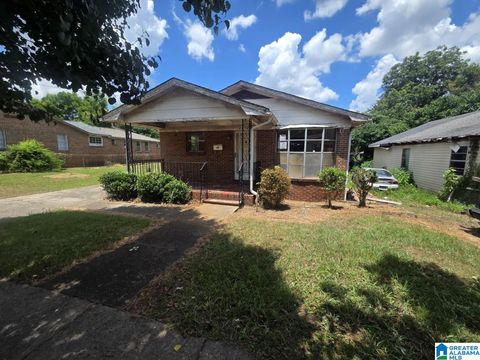
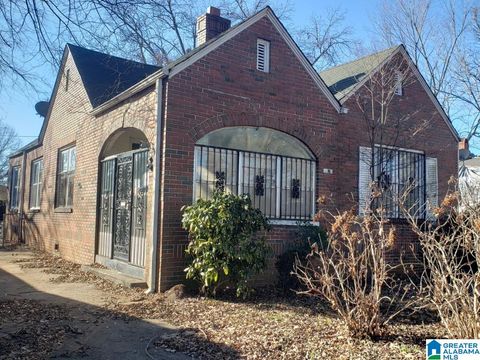
$59,000
3
bds
|
1
ba
|
1,386
sqft
|
built
1960
2436 College Ave SW, Birmingham, AL 35211
$897
Cash flow
17.7%
Cash-on-Cash Return
18.2%
Cap rate
2.2%
Rent to Value Ratio
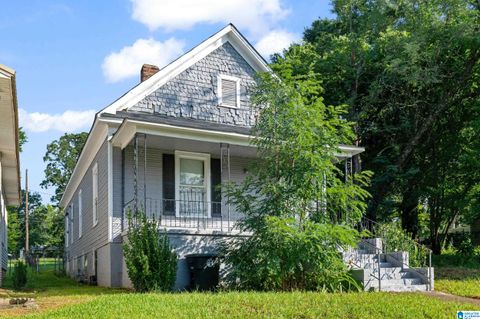
Active
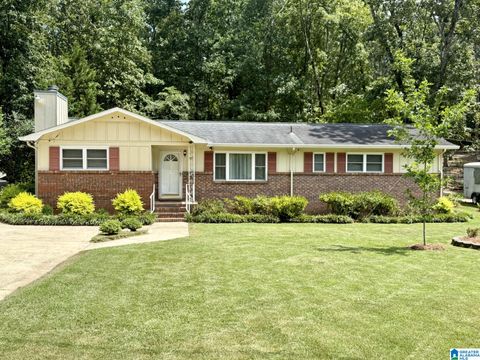
$73,000
3
bds
|
1
ba
|
1,200
sqft
|
built
1930
2536 29th Street Ensley, Birmingham, AL 35208
$828
Cash flow
13.2%
Cash-on-Cash Return
13.6%
Cap rate
1.6%
Rent to Value Ratio
1,236 out of 1,653 properties for sale in Jefferson County
Limited Results Shown
Create a free account, or log in to reveal all property listings and enjoy the complete experience.
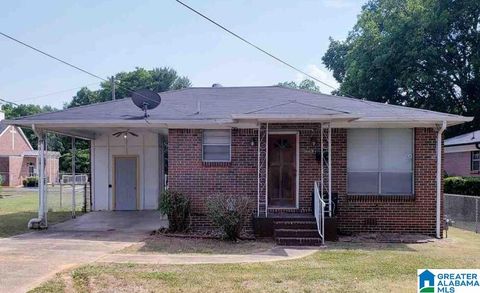
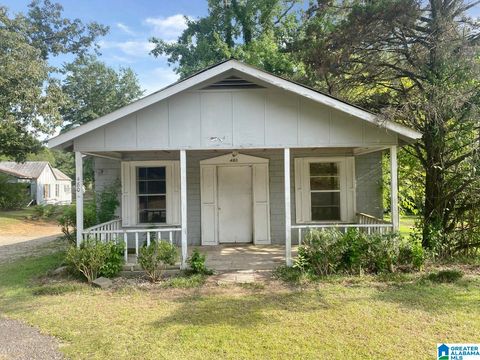
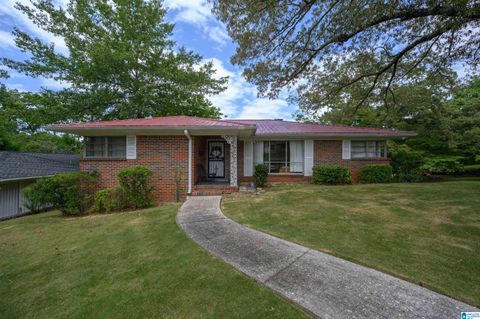
Active
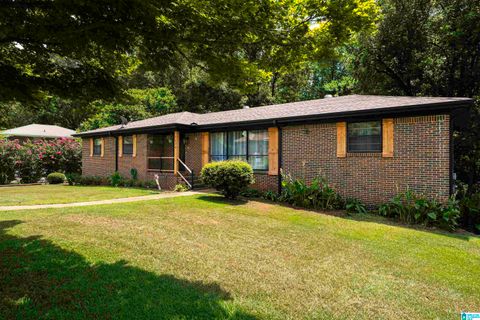
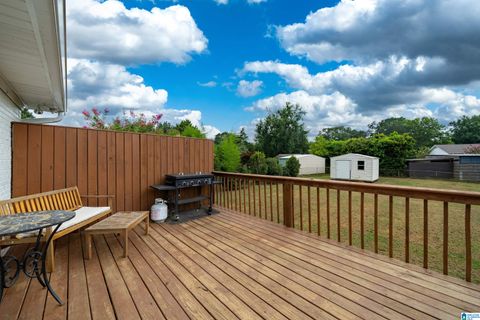
$80,000
3
bds
|
1
ba
|
960
sqft
|
built
1963
440 Oakmont St, Brighton, AL 35020
$311
Cash flow
20.3%
Cash-on-Cash Return
10.4%
Cap rate
1.3%
Rent to Value Ratio
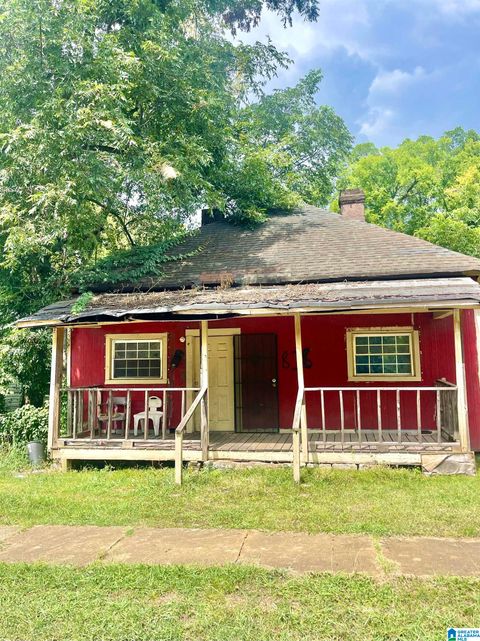
Active
$30,000
3
bds
|
1
ba
|
1,220
sqft
|
built
1930
828 42nd Pl N, Birmingham, AL 35212
$759
Cash flow
29.5%
Cash-on-Cash Return
30.4%
Cap rate
3.7%
Rent to Value Ratio
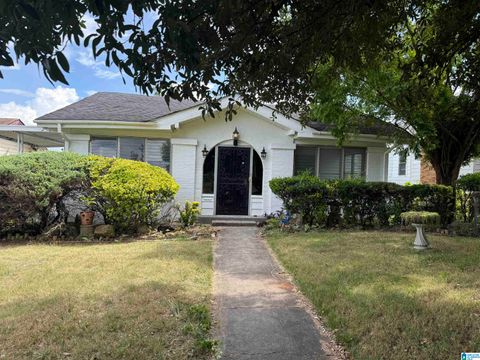
Active
$130,000
3
bds
|
2
ba
|
1,248
sqft
|
built
1950
124 E Crest Rd, Bessemer, AL 35023
$144
Cash flow
5.8%
Cash-on-Cash Return
7.0%
Cap rate
0.8%
Rent to Value Ratio
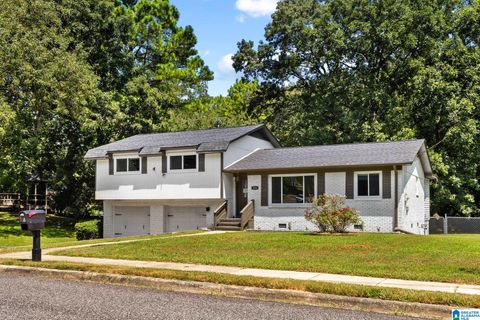
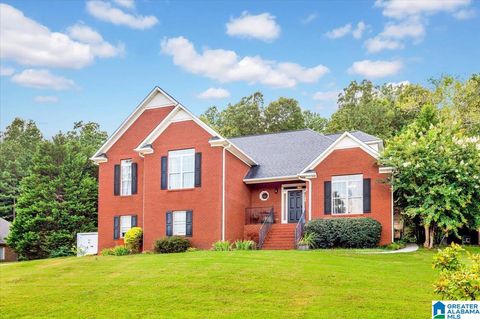
Active
$350,000
4
bds
|
2.5
ba
|
3,143
sqft
|
built
1996
7534 Aspen Ridge Dr, Pinson, AL 35126
$-138
Cash flow
-2.1%
Cash-on-Cash Return
5.2%
Cap rate
0.6%
Rent to Value Ratio
Active
$925,000
3
bds
|
3.5
ba
|
1,830
sqft
|
built
1920
917 38th St S, Birmingham, AL 35222
$-2,445
Cash flow
-13.8%
Cash-on-Cash Return
2.5%
Cap rate
0.3%
Rent to Value Ratio
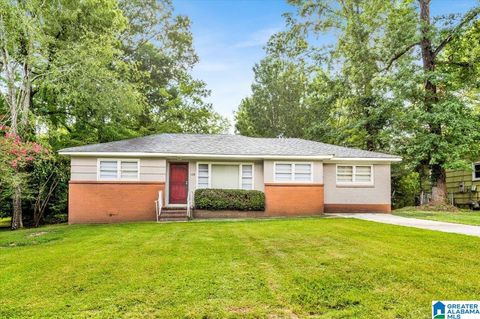
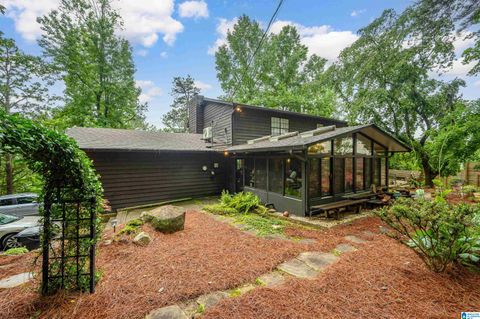
Active
$350,000
3
bds
|
2
ba
|
2,300
sqft
|
built
2004
6869 Lexington Oaks Dr, Trussville, AL 35173
$62
Cash flow
0.9%
Cash-on-Cash Return
5.9%
Cap rate
0.7%
Rent to Value Ratio
Active
$310,000
3
bds
|
2
ba
|
1,469
sqft
|
built
2007
2813 Oxmoor Glen Dr, Birmingham, AL 35211
$26
Cash flow
0.4%
Cash-on-Cash Return
5.8%
Cap rate
0.7%
Rent to Value Ratio
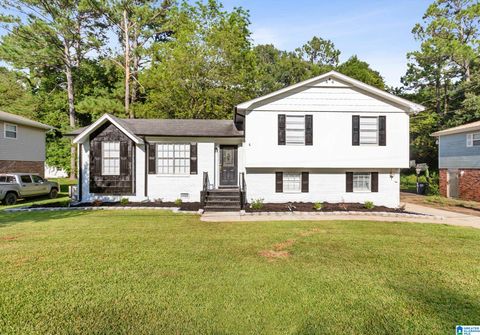
Active
$180,000
4
bds
|
2
ba
|
1,824
sqft
|
built
1930
630 11th Ct W, Birmingham, AL 35204
$-24
Cash flow
-0.7%
Cash-on-Cash Return
5.5%
Cap rate
0.7%
Rent to Value Ratio
Active
$269,900
3
bds
|
2
ba
|
1,528
sqft
|
built
2018
5636 Goodwin Ct, Pinson, AL 35126
$-35
Cash flow
-0.7%
Cash-on-Cash Return
5.5%
Cap rate
0.7%
Rent to Value Ratio
Active
$349,900
3
bds
|
2
ba
|
1,894
sqft
|
built
2020
261 Rock Dr, Gardendale, AL 35071
$-109
Cash flow
-1.6%
Cash-on-Cash Return
5.3%
Cap rate
0.7%
Rent to Value Ratio
Active
$225,000
3
bds
|
2
ba
|
1,525
sqft
|
built
1972
5249 Goldmar Dr, Irondale, AL 35210
$-30
Cash flow
-0.7%
Cash-on-Cash Return
5.5%
Cap rate
0.7%
Rent to Value Ratio
Active
$225,900
3
bds
|
3
ba
|
2,950
sqft
|
built
1970
217 4th St, Pleasant Grove, AL 35127
$35
Cash flow
0.8%
Cash-on-Cash Return
5.9%
Cap rate
0.7%
Rent to Value Ratio

Active
$279,000
3
bds
|
2
ba
|
2,091
sqft
|
built
1979
105 Hielary Cir, Bessemer, AL 35023
$-216
Cash flow
-4.0%
Cash-on-Cash Return
4.7%
Cap rate
0.6%
Rent to Value Ratio
Active
$575,000
4
bds
|
3.5
ba
|
2,160
sqft
|
built
1993
115 Hena St, Birmingham, AL 35209
$-996
Cash flow
-9.0%
Cash-on-Cash Return
3.6%
Cap rate
0.4%
Rent to Value Ratio
Active
$139,000
3
bds
|
1
ba
|
1,184
sqft
|
built
1956
412 Avalon Park, Bessemer, AL 35023
$239
Cash flow
9.0%
Cash-on-Cash Return
7.7%
Cap rate
0.9%
Rent to Value Ratio
Active
$39,900
2
bds
|
1
ba
|
984
sqft
|
built
1949
480 Trafford Rd, Warrior, AL 35180
$759
Cash flow
22.2%
Cash-on-Cash Return
22.8%
Cap rate
2.8%
Rent to Value Ratio
Active
$145,000
3
bds
|
2
ba
|
2,785
sqft
|
built
1926
1411 46th Pl N, Birmingham, AL 35212
$73
Cash flow
2.6%
Cash-on-Cash Return
6.3%
Cap rate
0.8%
Rent to Value Ratio
Active
$269,900
4
bds
|
2
ba
|
1,902
sqft
|
built
1975
256 Westchester Dr, Birmingham, AL 35215
$-35
Cash flow
-0.7%
Cash-on-Cash Return
5.5%
Cap rate
0.7%
Rent to Value Ratio

Active
$270,000
3
bds
|
2
ba
|
1,835
sqft
|
built
1978
3016 Virginia Dr, Bessemer, AL 35023
$-381
Cash flow
-7.4%
Cash-on-Cash Return
4.0%
Cap rate
0.5%
Rent to Value Ratio
Active
$139,000
3
bds
|
1
ba
|
1,272
sqft
|
built
1955
1128 Dogwood Ln, Birmingham, AL 35215
$170
Cash flow
6.4%
Cash-on-Cash Return
7.1%
Cap rate
0.9%
Rent to Value Ratio
Active
$199,900
5
bds
|
3
ba
|
2,120
sqft
|
built
1962
1212 45th St N, Birmingham, AL 35212
$296
Cash flow
7.7%
Cash-on-Cash Return
7.5%
Cap rate
0.9%
Rent to Value Ratio
Active
$419,900
5
bds
|
3.5
ba
|
2,847
sqft
|
built
2000
790 Cluster Springs Rd, Gardendale, AL 35071
$-193
Cash flow
-2.4%
Cash-on-Cash Return
5.1%
Cap rate
0.6%
Rent to Value Ratio
Active
$579,900
4
bds
|
2.5
ba
|
3,058
sqft
|
built
1979
3126 Renfro Rd, Vestavia Hills, AL 35216
$-329
Cash flow
-3.0%
Cash-on-Cash Return
5.0%
Cap rate
0.6%
Rent to Value Ratio
Active
$245,000
3
bds
|
2
ba
|
1,750
sqft
|
built
1973
2707 Novel Dr, Bessemer, AL 35023
$-193
Cash flow
-4.1%
Cash-on-Cash Return
4.7%
Cap rate
0.6%
Rent to Value Ratio
Active
$110,000
2
bds
|
2
ba
|
1,100
sqft
|
built
1952
4625 Tillman Rd, Quinton, AL 35130
$376
Cash flow
17.8%
Cash-on-Cash Return
9.8%
Cap rate
1.2%
Rent to Value Ratio
Active
$374,900
3
bds
|
2
ba
|
1,320
sqft
|
built
2019
3923 Crest Lndg, Irondale, AL 35210
$-74
Cash flow
-1.0%
Cash-on-Cash Return
5.4%
Cap rate
0.7%
Rent to Value Ratio

Active
$485,000
4
bds
|
2.5
ba
|
2,906
sqft
|
built
2008
4520 Amberley Dr, Birmingham, AL 35242
$-142
Cash flow
-1.5%
Cash-on-Cash Return
5.3%
Cap rate
0.7%
Rent to Value Ratio
Active
$399,900
4
bds
|
3
ba
|
2,884
sqft
|
built
1927
4328 5th Ave S, Birmingham, AL 35222
$-305
Cash flow
-4.0%
Cash-on-Cash Return
4.8%
Cap rate
0.6%
Rent to Value Ratio
Active
$139,000
2
bds
|
2
ba
|
1,920
sqft
|
built
1951
1023 46th St N, Birmingham, AL 35212
$515
Cash flow
19.3%
Cash-on-Cash Return
10.1%
Cap rate
1.2%
Rent to Value Ratio
Active
$499,000
1
bds
|
1
ba
|
2,362
sqft
|
built
1910
2321 1st Ave N, Birmingham, AL 35203
$-1,022
Cash flow
-10.7%
Cash-on-Cash Return
3.2%
Cap rate
0.6%
Rent to Value Ratio
Active
$350,000
2
bds
|
2
ba
|
1,424
sqft
|
built
1938
530 Rockridge Ave, Trussville, AL 35173
$-69
Cash flow
-1.0%
Cash-on-Cash Return
5.4%
Cap rate
0.7%
Rent to Value Ratio
Active
$505,000
4
bds
|
2.5
ba
|
2,782
sqft
|
built
1993
3518 Wynwood Dr, Birmingham, AL 35210
$-389
Cash flow
-4.0%
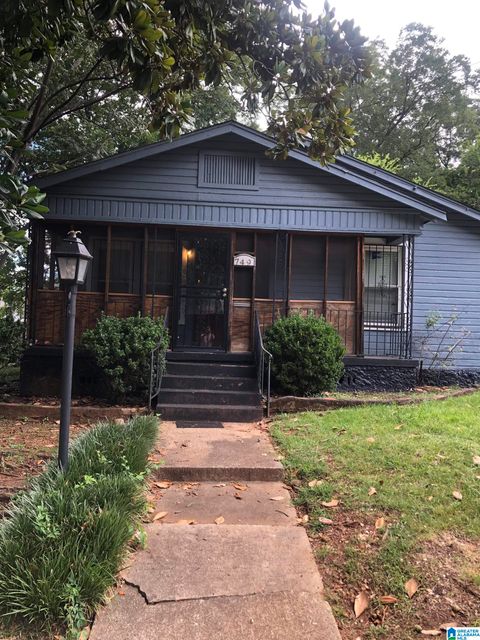
Cash-on-Cash Return
4.8%
Cap rate
0.6%
Rent to Value Ratio
Active
$79,900
3
bds
|
1
ba
|
1,036
sqft
|
built
1930
749 45th Pl N, Birmingham, AL 35212
$450
Cash flow
29.4%
Cash-on-Cash Return
12.4%
Cap rate
1.5%
Rent to Value Ratio
Active
$79,500
3
bds
|
1
ba
|
1,863
sqft
|
built
1940
1627 49th Street Ensley, Birmingham, AL 35208
$521
Cash flow
34.2%
Cash-on-Cash Return
13.5%
Cap rate
1.6%
Rent to Value Ratio
Active
$170,000
3
bds
|
1.5
ba
|
1,500
sqft
|
built
1968
317 26th Ave NE, Center Point, AL 35215
$231
Cash flow
7.1%
Cash-on-Cash Return
7.3%
Cap rate
0.9%
Rent to Value Ratio

Active
$140,000
4
bds
|
2.5
ba
|
1,560
sqft
|
built
1978
1120 Grand Blvd, Birmingham, AL 35214
$504
Cash flow
18.8%
Cash-on-Cash Return
10.0%
Cap rate
1.2%
Rent to Value Ratio
Active
$222,000
5
bds
|
2
ba
|
1,883
sqft
|
built
1966
5434 Pine St, Sylvan Springs, AL 35118
$191
Cash flow
4.5%
Cash-on-Cash Return
6.7%
Cap rate
0.8%
Rent to Value Ratio
Active
$334,500
4
bds
|
2
ba
|
2,160
sqft
|
built
1970
304 Mozelle Cir, Gardendale, AL 35071
$4
Cash flow
0.1%
Cash-on-Cash Return
5.7%
Cap rate
0.7%
Rent to Value Ratio