Pinal County Investment Properties for Sale
Browse homes for sale and investment properties in Pinal County. Refine your search by price, property type, or more.
Best cash flowing properties in Pinal County
Active
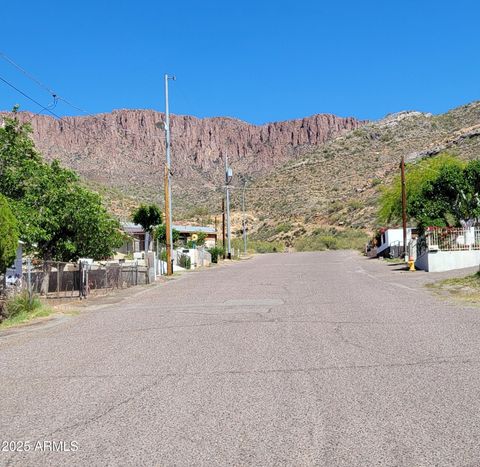
$109,000
2
bds
|
1
ba
|
958
sqft
|
built
1957
452 W Ray St, Superior, AZ 85173
$409
Cash flow
19.6%
Cash-on-Cash Return
10.2%
Cap rate
1.3%
Rent to Value Ratio
Active
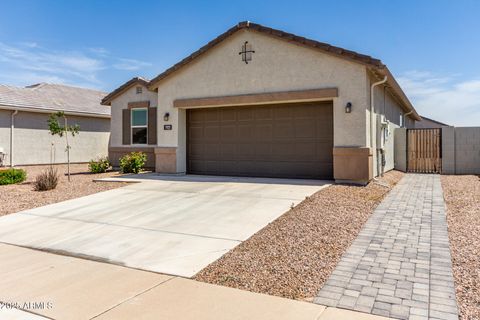
$320,000
3
bds
|
2
ba
|
1,538
sqft
|
built
2021
1925 W Pima Ave, Coolidge, AZ 85128
$-73
Cash flow
-1.2%
Cash-on-Cash Return
5.4%
Cap rate
0.7%
Rent to Value Ratio
1,193 out of 1,719 properties for sale in Pinal County
Limited Results Shown
Create a free account, or log in to reveal all property listings and enjoy the complete experience.
Active
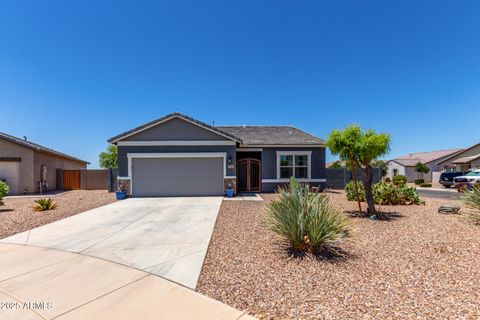
$424,900
4
bds
|
2
ba
|
1,827
sqft
|
built
2017
30388 N Opal Dr, San Tan Valley, AZ 85143
$-819
Cash flow
-10.1%
Cash-on-Cash Return
3.4%
Cap rate
0.5%
Rent to Value Ratio
Active
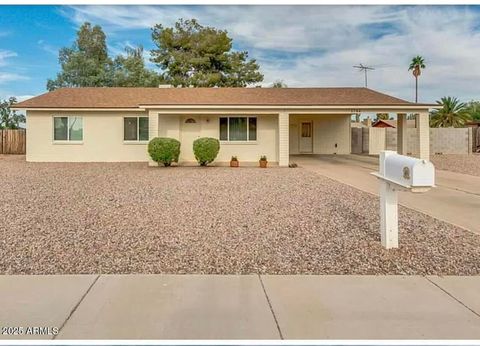
$354,900
3
bds
|
2
ba
|
1,301
sqft
|
built
1981
1784 N Kadota Ave, Casa Grande, AZ 85122
$-524
Cash flow
-7.7%
Cash-on-Cash Return
3.9%
Cap rate
0.5%
Rent to Value Ratio
Active
$360,000
3
bds
|
2
ba
|
1,440
sqft
|
built
2002
9175 E Rainier Dr, Gold Canyon, AZ 85118
$-530
Cash flow
-7.7%
Cash-on-Cash Return
3.9%
Cap rate
0.6%
Rent to Value Ratio
Active
$321,000
3
bds
|
2
ba
|
2,147
sqft
|
built
2006
46185 W Dutchman Dr, Maricopa, AZ 85139
$-520
Cash flow
-8.5%
Cash-on-Cash Return
3.7%
Cap rate
0.6%
Rent to Value Ratio
Active
$599,000
2
bds
|
2
ba
|
1,574
sqft
|
built
2008
1462 E Sweet Citrus Dr, San Tan Valley, AZ 85140
$-1,912
Cash flow
-16.7%
Cash-on-Cash Return
1.8%
Cap rate
0.4%
Rent to Value Ratio

Active
$345,000
4
bds
|
2
ba
|
1,642
sqft
|
built
2022
3576 N Mia Ln, Casa Grande, AZ 85122
$-603
Cash flow
-9.1%
Cash-on-Cash Return
3.6%
Cap rate
0.5%
Rent to Value Ratio
Active
$399,990
3
bds
|
2
ba
|
1,631
sqft
|
built
2006
18102 E El Viejo Desierto, Gold Canyon, AZ 85118
$-718
Cash flow
-9.4%
Cash-on-Cash Return
3.5%
Cap rate
0.5%
Rent to Value Ratio
Active
$435,000
3
bds
|
3
ba
|
2,015
sqft
|
built
2015
894 S Buena Vista Dr, Apache Junction, AZ 85120
$-813
Cash flow
-9.8%
Cash-on-Cash Return
3.4%
Cap rate
0.5%
Rent to Value Ratio
Active
$325,000
4
bds
|
2
ba
|
1,917
sqft
|
built
2004
44188 W Cydnee Dr, Maricopa, AZ 85138
$-585
Cash flow
-9.4%
Cash-on-Cash Return
3.5%
Cap rate
0.6%
Rent to Value Ratio

Active
$526,500
4
bds
|
3
ba
|
1,942
sqft
|
built
2022
12176 E Chevelon Trl, Gold Canyon, AZ 85118
$-1,014
Cash flow
-10.0%
Cash-on-Cash Return
3.4%
Cap rate
0.5%
Rent to Value Ratio
Active
$409,000
2
bds
|
2
ba
|
1,433
sqft
|
built
2010
1768 E Grand Ridge Rd, Queen Creek, AZ 85140
$-677
Cash flow
-8.6%
Cash-on-Cash Return
3.7%
Cap rate
0.7%
Rent to Value Ratio
Active
$410,000
4
bds
|
2
ba
|
2,311
sqft
|
built
2003
418 E Clairidge Dr, San Tan Valley, AZ 85143
$-760
Cash flow
-9.7%
Cash-on-Cash Return
3.5%
Cap rate
0.5%
Rent to Value Ratio
Active
$410,000
3
bds
|
2
ba
|
2,004
sqft
|
built
2018
36203 N Urika Dr, San Tan Valley, AZ 85140
$-764
Cash flow
-9.7%
Cash-on-Cash Return
3.4%
Cap rate
0.5%
Rent to Value Ratio
Active
$545,000
4
bds
|
3
ba
|
2,775
sqft
|
built
2022
4283 W Nora Dr, San Tan Valley, AZ 85144
$-896
Cash flow
-8.6%
Cash-on-Cash Return
3.7%
Cap rate
0.5%
Rent to Value Ratio
Active
$345,000
3
bds
|
2
ba
|
1,966
sqft
|
built
2001
43727 W Wade Dr, Maricopa, AZ 85138
$-532
Cash flow
-8.0%
Cash-on-Cash Return
3.8%
Cap rate
0.6%
Rent to Value Ratio
Active
$515,000
3
bds
|
2
ba
|
1,512
sqft
|
built
2019
8912 N Johnson Rd, Maricopa, AZ 85139
$-715
Cash flow
-7.2%
Cash-on-Cash Return
4.0%
Cap rate
0.5%
Rent to Value Ratio
Active
$699,000
bds
|
0
ba
|
0
sqft
|
built
2002
8190 W Serena Dr, Arizona City, AZ 85123
$-2,553
Cash flow
-19.1%
Cash-on-Cash Return
1.3%
Cap rate
0.2%
Rent to Value Ratio
Active
$565,000
3
bds
|
3
ba
|
2,133
sqft
|
built
2023
1350 W Macaw Dr, Queen Creek, AZ 85140
$-1,233
Cash flow
-11.4%
Cash-on-Cash Return
3.1%
Cap rate
0.4%
Rent to Value Ratio
Active
$469,900
3
bds
|
2
ba
|
1,571
sqft
|
built
2022
8678 S John Jacob Astor Ave, Casa Grande, AZ 85193
$-428
Cash flow
-4.8%
Cash-on-Cash Return
4.6%
Cap rate
0.6%
Rent to Value Ratio
Active
$589,900
2
bds
|
3
ba
|
2,299
sqft
|
built
2013
1620 E Sattoo Way, Queen Creek, AZ 85140
$-1,413
Cash flow
-12.5%
Cash-on-Cash Return
2.8%
Cap rate
0.5%
Rent to Value Ratio
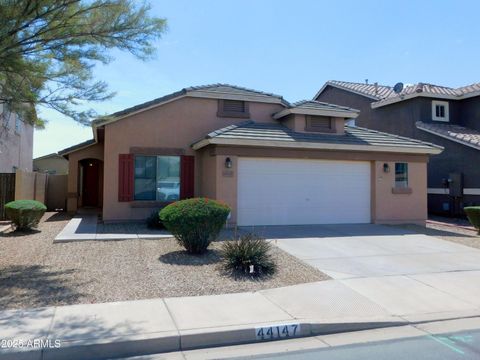
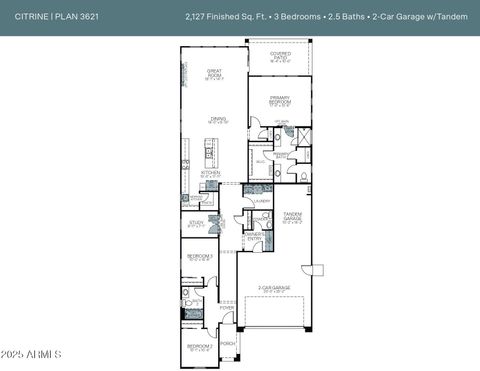
Active
$349,000
4
bds
|
2
ba
|
1,693
sqft
|
built
2004
44147 W Snow Dr, Maricopa, AZ 85138
$-736
Cash flow
-11.0%
Cash-on-Cash Return
3.1%
Cap rate
0.5%
Rent to Value Ratio
Active
$499,900
3
bds
|
2
ba
|
1,642
sqft
|
built
2002
10276 E Meandering Trail Ln, Gold Canyon, AZ 85118
$-1,052
Cash flow
-11.0%
Cash-on-Cash Return
3.2%
Cap rate
0.5%
Rent to Value Ratio
Active
$534,000
3
bds
|
3
ba
|
2,186
sqft
|
built
2016
36145 N Desert Tea Dr, Queen Creek, AZ 85140
$-1,431
Cash flow
-14.0%
Cash-on-Cash Return
2.5%
Cap rate
0.5%
Rent to Value Ratio
Active
$444,900
3
bds
|
2
ba
|
2,311
sqft
|
built
2007
2751 N Ralston Rd, Maricopa, AZ 85139
$-776
Cash flow
-9.1%
Cash-on-Cash Return
3.6%
Cap rate
0.5%
Rent to Value Ratio
Active
$289,900
3
bds
|
2
ba
|
1,368
sqft
|
built
2019
36454 W Picasso St, Maricopa, AZ 85138
$-353
Cash flow
-6.4%
Cash-on-Cash Return
4.2%
Cap rate
0.6%
Rent to Value Ratio
Active
$339,999
4
bds
|
2
ba
|
1,825
sqft
|
built
2023
3571 N Encanto St, Casa Grande, AZ 85122
$-311
Cash flow
-4.8%
Cash-on-Cash Return
4.6%
Cap rate
0.6%
Rent to Value Ratio
Active
$649,000
4
bds
|
2
ba
|
2,279
sqft
|
built
2020
27550 N Silverleaf Rd, San Tan Valley, AZ 85143
$-1,161
Cash flow
-9.3%
Cash-on-Cash Return
3.5%
Cap rate
0.5%
Rent to Value Ratio

Active
$310,000
3
bds
|
3
ba
|
2,194
sqft
|
built
2006
41227 W Granada Dr, Maricopa, AZ 85138
$-491
Cash flow
-8.3%
Cash-on-Cash Return
3.8%
Cap rate
0.6%
Rent to Value Ratio
Active
$308,000
4
bds
|
2
ba
|
1,710
sqft
|
built
1946
599 W Vah Ki Inn Rd, Coolidge, AZ 85128
$-274
Cash flow
-4.6%
Cash-on-Cash Return
4.6%
Cap rate
0.6%
Rent to Value Ratio
Active
$359,900
5
bds
|
3
ba
|
2,276
sqft
|
built
2006
21033 N Alexis Ave, Maricopa, AZ 85138
$-679
Cash flow
-9.8%
Cash-on-Cash Return
3.4%
Cap rate
0.5%
Rent to Value Ratio
Active
$665,000
2
bds
|
3
ba
|
2,143
sqft
|
built
2012
1787 E Sattoo Way, San Tan Valley, AZ 85140
$-2,214
Cash flow
-17.4%
Cash-on-Cash Return
1.7%
Cap rate
0.4%
Rent to Value Ratio
Active
$665,000
4
bds
|
3
ba
|
3,674
sqft
|
built
2004
43324 W Desert Fairways Dr, Maricopa, AZ 85138
$-1,865
Cash flow
-14.6%
Cash-on-Cash Return
2.3%
Cap rate
0.4%
Rent to Value Ratio
Active
$355,000
4
bds
|
2
ba
|
1,721
sqft
|
built
2022
1268 E Jahns Dr, Casa Grande, AZ 85122
$-666
Cash flow
-9.8%
Cash-on-Cash Return
3.4%
Cap rate
0.5%
Rent to Value Ratio

Active
$435,000
3
bds
|
2
ba
|
2,170
sqft
|
built
2007
42760 W Magnolia Rd, Maricopa, AZ 85138
$-951
Cash flow
-11.4%
Cash-on-Cash Return
3.1%
Cap rate
0.5%
Rent to Value Ratio
Active
$449,995
4
bds
|
2
ba
|
1,738
sqft
|
built
1973
930 E Friar Ave, Apache Junction, AZ 85119
$-623
Cash flow
-7.2%
Cash-on-Cash Return
4.0%
Cap rate
0.5%
Rent to Value Ratio
Active
$399,000
5
bds
|
4
ba
|
2,788
sqft
|
built
2007
36114 W Vera Cruz Dr, Maricopa, AZ 85138
$-630
Cash flow
-8.2%
Cash-on-Cash Return
3.8%
Cap rate
0.6%
Rent to Value Ratio
Active
$479,333
5
bds
|
3
ba
|
4,147
sqft
|
built
2005
43601 W Cowpath Rd, Maricopa, AZ 85138
$-1,001
Cash flow
-10.9%
Cash-on-Cash Return
3.2%
Cap rate
0.5%
Rent to Value Ratio
Active
$315,000
3
bds
|
2
ba
|
1,651
sqft
|
built
2009
40264 W Lococo St, Maricopa, AZ 85138
$-498
Cash flow
-8.2%
Cash-on-Cash Return
3.8%
Cap rate
0.6%
Rent to Value Ratio