Burbank, IL Investment Properties for Sale
Browse homes for sale and investment properties in Burbank, IL. Refine your search by price, property type, or more.
Best cash flowing properties in Burbank, IL
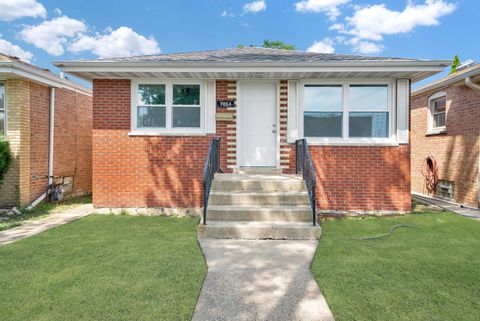
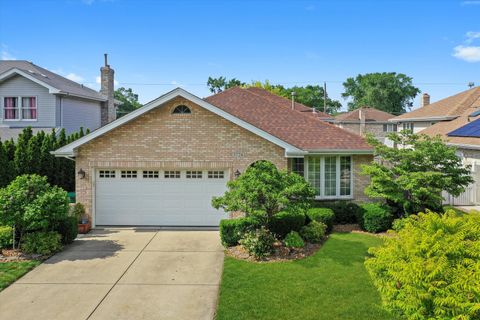
Active
$189,900
3
bds
|
2
ba
|
1,013
sqft
|
built
1962
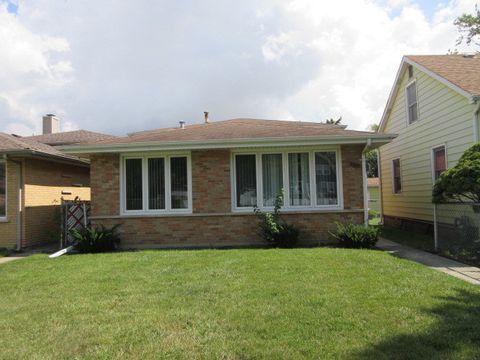
7745 Nashville Ave, Burbank, IL 60459
$67
Cash flow
1.8%
Cash-on-Cash Return
6.1%
Cap rate
1.2%
Rent to Value Ratio
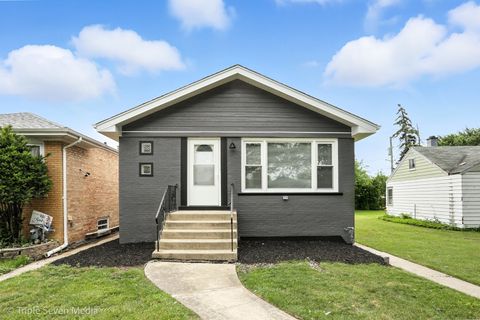
Active
$279,900
4
bds
|
1
ba
|
1,056
sqft
|
built
1957
7840 Massasoit Ave, Burbank, IL 60459
$37
Cash flow
0.7%
Cash-on-Cash Return
5.8%
Cap rate
0.9%
Rent to Value Ratio
16 out of 19 properties for sale in Burbank, IL
Limited Results Shown
Create a free account, or log in to reveal all property listings and enjoy the complete experience.
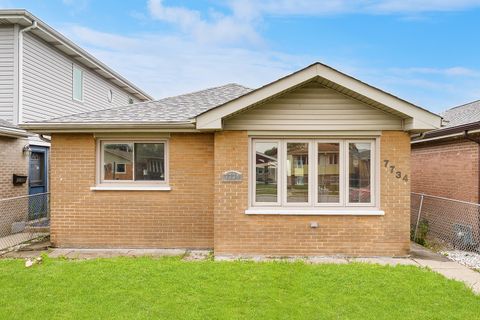
Active
$285,000
3
bds
|
1
ba
|
1,010
sqft
|
built
1962
7734 Melvina Ave, Burbank, IL 60459
$-348
Cash flow
-6.4%
Cash-on-Cash Return
4.2%
Cap rate
0.8%
Rent to Value Ratio
Active
$379,999
5
bds
|
2
ba
|
1,670
sqft
|
built
1946
8646 Nagle Ave, Burbank, IL 60459
$-128
Cash flow
-1.8%
Cash-on-Cash Return
5.3%
Cap rate
0.8%
Rent to Value Ratio
Active
$344,900
3
bds
|
2
ba
|
1,748
sqft
|
built
1962
7654 Lavergne Ave, Burbank, IL 60459
$-302
Cash flow
-4.6%
Cash-on-Cash Return
4.6%
Cap rate
0.6%
Rent to Value Ratio

Active
$299,000
3
bds
|
1
ba
|
1,058
sqft
|
built
1964
6425 W 83rd Pl, Burbank, IL 60459
$-260
Cash flow
-4.5%
Cash-on-Cash Return
4.6%
Cap rate
0.7%
Rent to Value Ratio

Active
$319,900
3
bds
|
1
ba
|
1,056
sqft
|
built
1964
7814 Major Ave, Burbank, IL 60459
$-324
Cash flow
-5.3%
Cash-on-Cash Return
4.5%
Cap rate
0.8%
Rent to Value Ratio
Active
$399,900
3
bds
|
2
ba
|
2,064
sqft
|
built
1959
7707 Linder Ave, Burbank, IL 60459
$-943
Cash flow
-12.3%
Cash-on-Cash Return
2.8%
Cap rate
0.6%
Rent to Value Ratio
Active
$375,000
3
bds
|
2
ba
|
1,327
sqft
|
built
1986
7542 Mason Ave, Burbank, IL 60459
$-138
Cash flow
-1.9%
Cash-on-Cash Return
5.2%
Cap rate
0.8%
Rent to Value Ratio

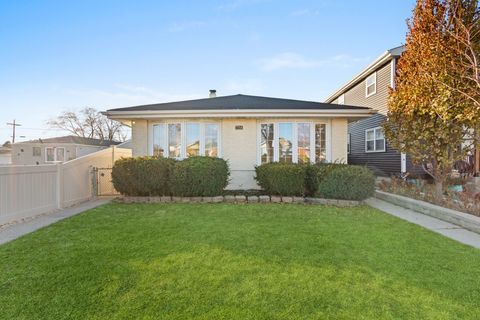
Active
$275,000
3
bds
|
1
ba
|
1,000
sqft
|
built
1963
7707 Mobile Ave, Burbank, IL 60459
$-171
Cash flow
-3.2%
Cash-on-Cash Return
4.9%
Cap rate
0.8%
Rent to Value Ratio
Active
$320,000
3
bds
|
2
ba
|
1,032
sqft
|
built
1958
7723 Melvina Ave, Burbank, IL 60459
$-38
Cash flow
-0.6%
Cash-on-Cash Return
5.5%
Cap rate
0.8%
Rent to Value Ratio
Active
$499,900
4
bds
|
3
ba
|
2,500
sqft
|
built
1997
5724 W 82nd Pl, Burbank, IL 60459
$-999
Cash flow
-10.4%
Cash-on-Cash Return
3.3%
Cap rate
0.6%
Rent to Value Ratio
Active
$349,000
3
bds
|
2
ba
|
1,080
sqft
|
built
1967
7754 Mc Vicker Ave, Burbank, IL 60459
$-311
Cash flow
-4.6%
Cash-on-Cash Return
4.6%
Cap rate
0.8%
Rent to Value Ratio
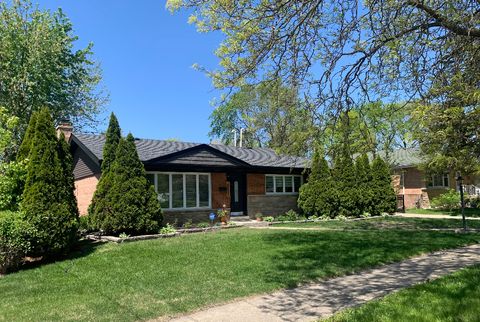
Active
$409,900
3
bds
|
2
ba
|
1,515
sqft
|
built
1962
8632 New England Ave, Burbank, IL 60459
$-620
Cash flow
-7.9%
Cash-on-Cash Return
3.9%
Cap rate
0.7%
Rent to Value Ratio
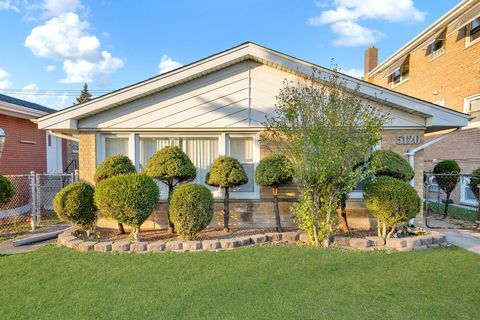
Active
$369,000
4
bds
|
2
ba
|
0
sqft
|
built
1965
5120 W 79th St, Burbank, IL 60459
$-332
Cash flow
-4.7%
Cash-on-Cash Return
4.6%
Cap rate
0.8%
Rent to Value Ratio
Active
$330,000
3
bds
|
3
ba
|
1,614
sqft
|
built
1957
8026 Linder Ave, Burbank, IL 60459
$-269
Cash flow
-4.3%
Cash-on-Cash Return
4.7%
Cap rate
0.8%
Rent to Value Ratio