Davenport, FL Investment Properties for Sale
Browse homes for sale and investment properties in Davenport, FL. Refine your search by price, property type, or more.
Best cash flowing properties in Davenport, FL
Active
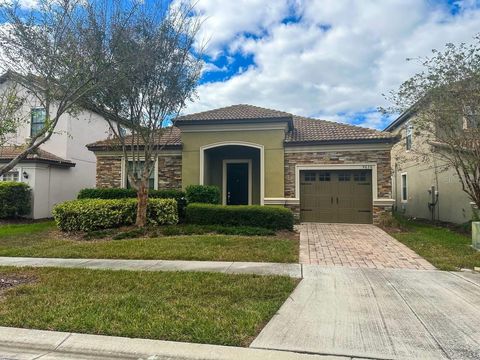
$211,000
3
bds
|
3
ba
|
1,217
sqft
|
built
2008
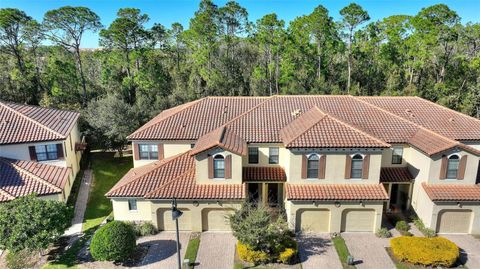
904 Charo Pkwy, Davenport, FL 33897
$142
Cash flow
3.5%
Cash-on-Cash Return
7.0%
Cap rate
1.0%
Rent to Value Ratio
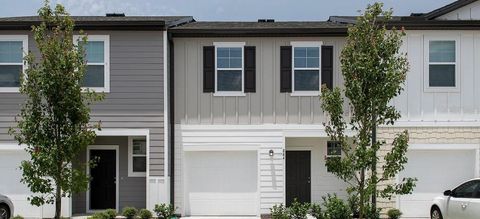
Active
$209,900
3
bds
|
3
ba
|
1,217
sqft
|
built
2008
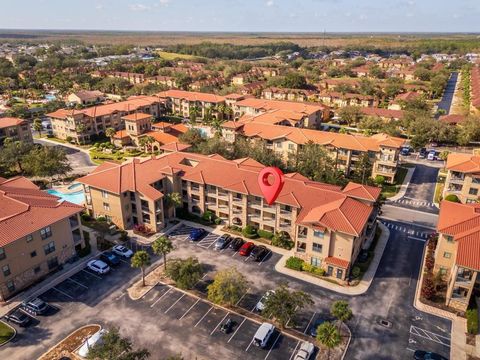
904 Charo Pkwy, Davenport, FL 33897
$21
Cash flow
0.5%
Cash-on-Cash Return
6.3%
Cap rate
0.9%
Rent to Value Ratio
804 out of 811 properties for sale in Davenport, FL
Limited Results Shown
Create a free account, or log in to reveal all property listings and enjoy the complete experience.
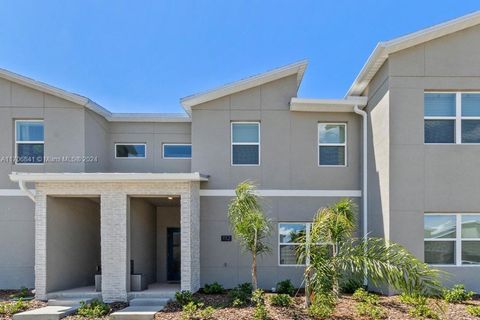
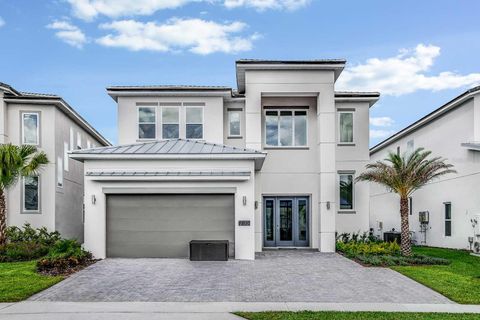
Active
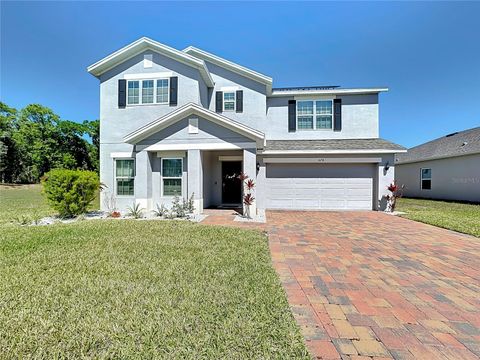
$399,999
4
bds
|
3
ba
|
1,750
sqft
|
built
2004
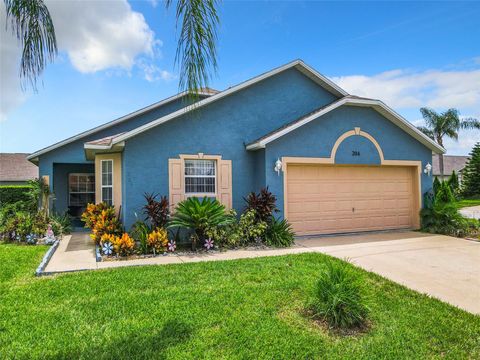
204 Fox Loop, Davenport, FL 33837
$-265
Cash flow
-3.5%
Cash-on-Cash Return
5.4%
Cap rate
0.7%
Rent to Value Ratio
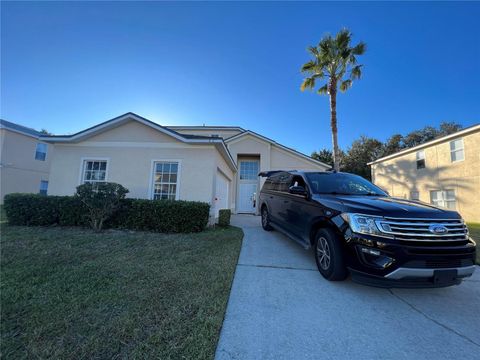
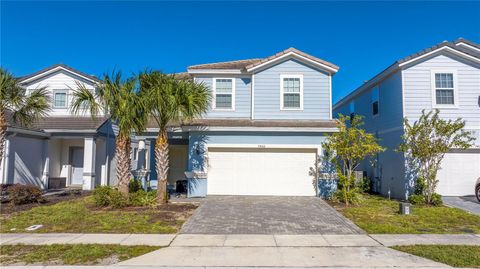
Active
$244,900
3
bds
|
2
ba
|
1,227
sqft
|
built
2003
411 Lucaya Loop, Davenport, FL 33897
$-614
Cash flow
-13.1%
Cash-on-Cash Return
3.1%
Cap rate
0.8%
Rent to Value Ratio
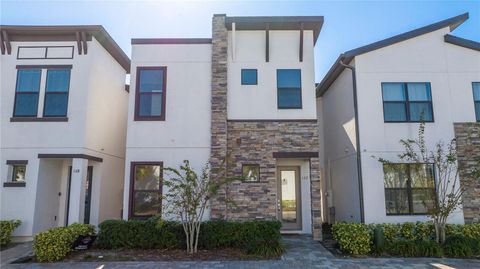
Active
$322,400
3
bds
|
3
ba
|
1,421
sqft
|
built
2022
445 Madison Dr, Davenport, FL 33837
$-380
Cash flow
-6.1%
Cash-on-Cash Return
4.7%
Cap rate
0.7%
Rent to Value Ratio
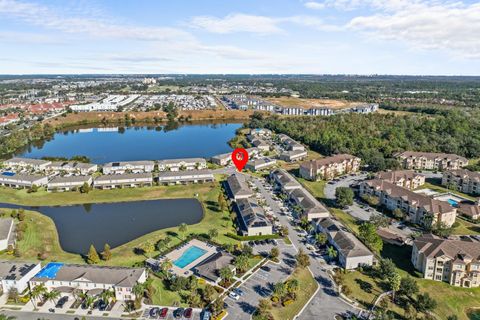
Active
$590,000
5
bds
|
5
ba
|
2,842
sqft
|
built
2014
9037 Shadow Mountain St, Davenport, FL 33896
$-1,633
Cash flow
-14.4%
Cash-on-Cash Return
2.8%
Cap rate
0.6%
Rent to Value Ratio
Active
$520,000
5
bds
|
4
ba
|
2,490
sqft
|
built
2022
7212 Oakmoss Loop, Davenport, FL 33837
$-1,323
Cash flow
-13.3%
Cash-on-Cash Return
3.1%
Cap rate
0.7%
Rent to Value Ratio
Active
$236,000
3
bds
|
3
ba
|
1,326
sqft
|
built
2008
904 Charo Pkwy, Davenport, FL 33897
$-631
Cash flow
-13.9%
Cash-on-Cash Return
2.9%
Cap rate
0.9%
Rent to Value Ratio
Active
$209,900
3
bds
|
3
ba
|
1,217
sqft
|
built
2008
904 Charo Pkwy, Davenport, FL 33897
$21
Cash flow
0.5%
Cash-on-Cash Return
6.3%
Cap rate
0.9%
Rent to Value Ratio
Active
$211,000
3
bds
|
3
ba
|
1,217
sqft
|
built
2008
904 Charo Pkwy, Davenport, FL 33897
$142
Cash flow
3.5%
Cash-on-Cash Return
7.0%
Cap rate
1.0%
Rent to Value Ratio
Active
$435,000
4
bds
|
3
ba
|
0
sqft
|
built
2022
1112 Kingsbarn St, Davenport, FL 33896
$-1,205
Cash flow
-14.5%
Cash-on-Cash Return
2.8%
Cap rate
0.7%
Rent to Value Ratio
Active
$430,000
4
bds
|
4
ba
|
1,823
sqft
|
built
2020
172 Villa Domani Cir, Davenport, FL 33896
$-965
Cash flow
-11.7%
Cash-on-Cash Return
3.5%
Cap rate
0.7%
Rent to Value Ratio
Active
$440,000
5
bds
|
4
ba
|
2,376
sqft
|
built
2004
612 Bloomingdale Dr, Davenport, FL 33897
$-1,036
Cash flow
-12.3%
Cash-on-Cash Return
3.3%
Cap rate
0.7%
Rent to Value Ratio
Active
$295,000
3
bds
|
3
ba
|
1,507
sqft
|
built
2018
355 Highcrest Rd, Davenport, FL 33896
$-575
Cash flow
-10.2%
Cash-on-Cash Return
3.8%
Cap rate
0.7%
Rent to Value Ratio
Active
$299,900
3
bds
|
3
ba
|
1,632
sqft
|
built
2015
8205 Roseville Blvd, Davenport, FL 33896
$-952
Cash flow
-16.6%
Cash-on-Cash Return
2.3%
Cap rate
0.7%
Rent to Value Ratio
Active
$194,900
3
bds
|
3
ba
|
1,217
sqft
|
built
2008
903 Charo Pkwy, Davenport, FL 33897
$-1,059
Cash flow
-28.3%
Cash-on-Cash Return
-0.4%
Cap rate
1.1%
Rent to Value Ratio
Active
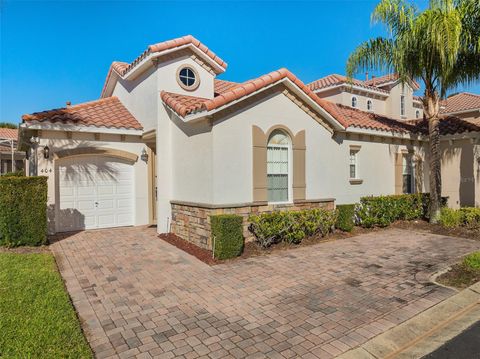
$384,995
3
bds
|
2
ba
|
1,373
sqft
|
built
2006
404 Brunello Dr, Davenport, FL 33897
$-892
Cash flow
-12.1%
Cash-on-Cash Return
3.4%
Cap rate
0.6%
Rent to Value Ratio
Active
$514,999
5
bds
|
3
ba
|
3,219
sqft
|
built
2021
678 Fiddlesticks Dr, Davenport, FL 33837
$-922
Cash flow
-9.3%
Cash-on-Cash Return
4.0%
Cap rate
0.7%
Rent to Value Ratio
Active
$584,000
4
bds
|
3
ba
|
2,381
sqft
|
built
2013
8914 Dove Valley Way, Davenport, FL 33896
$-1,943
Cash flow
-17.4%
Cash-on-Cash Return
2.2%
Cap rate
0.6%
Rent to Value Ratio
Active
$475,000
4
bds
|
3
ba
|
2,050
sqft
|
built
2004
344 Barbera Dr, Davenport, FL 33897
$-815
Cash flow
-9.0%
Cash-on-Cash Return
4.1%
Cap rate
0.7%
Rent to Value Ratio

Active
$210,000
2
bds
|
2
ba
|
1,134
sqft
|
built
2008
1301 Tuscan Ter, Davenport, FL 33896
$-730
Cash flow
-18.1%
Cash-on-Cash Return
2.0%
Cap rate
0.9%
Rent to Value Ratio
Active
$339,000
4
bds
|
3
ba
|
1,659
sqft
|
built
2005
1111 Royal Ridge Dr, Davenport, FL 33896
$-487
Cash flow
-7.5%
Cash-on-Cash Return
4.4%
Cap rate
0.7%
Rent to Value Ratio
Active
$542,500
5
bds
|
3
ba
|
3,084
sqft
|
built
2023
9660 Westside Hills Dr, Davenport, FL 33896
$-550
Cash flow
-5.3%
Cash-on-Cash Return
4.9%
Cap rate
0.6%
Rent to Value Ratio
Active
$429,900
4
bds
|
3
ba
|
2,267
sqft
|
built
2015
5307 Cortland Dr, Davenport, FL 33837
$-687
Cash flow
-8.3%
Cash-on-Cash Return
4.2%
Cap rate
0.7%
Rent to Value Ratio
Active
$525,000
5
bds
|
3
ba
|
2,512
sqft
|
built
1996
577 Sunridge Woods Blvd, Davenport, FL 33837
$-1,371
Cash flow
-13.6%
Cash-on-Cash Return
3.0%
Cap rate
0.5%
Rent to Value Ratio
Active
$430,000
4
bds
|
4
ba
|
2,174
sqft
|
built
2020
709 Benoi Dr, Davenport, FL 33896
$-1,405
Cash flow
-17.0%
Cash-on-Cash Return
2.2%
Cap rate
0.5%
Rent to Value Ratio
Active
$338,900
3
bds
|
2
ba
|
1,401
sqft
|
built
1993
218 Meadow Green Dr, Davenport, FL 33837
$-716
Cash flow
-11.0%
Cash-on-Cash Return
3.6%
Cap rate
0.6%
Rent to Value Ratio
Active
$485,000
4
bds
|
3
ba
|
2,225
sqft
|
built
2014
9030 Shadow Mountain St, Davenport, FL 33896
$-1,491
Cash flow
-16.0%
Cash-on-Cash Return
2.5%
Cap rate
0.6%
Rent to Value Ratio
Active
$312,000
3
bds
|
3
ba
|
1,480
sqft
|
built
2022
437 Madison Cir, Davenport, FL 33896
$-493
Cash flow
-8.2%
Cash-on-Cash Return
4.3%
Cap rate
0.7%
Rent to Value Ratio
Active
$950,000
6
bds
|
6
ba
|
3,780
sqft
|
built
2022
2133 Pine Oak Loop, Davenport, FL 33837
$-2,015
Cash flow
-11.1%
Cash-on-Cash Return
3.6%
Cap rate
0.7%
Rent to Value Ratio
Active
$597,000
6
bds
|
4
ba
|
3,176
sqft
|
built
2020
7400 Oakmoss Loop, Davenport, FL 33837
$-1,428
Cash flow
-12.5%
Cash-on-Cash Return
3.3%
Cap rate
0.7%
Rent to Value Ratio
Active
$295,000
4
bds
|
3
ba
|
1,492
sqft
|
built
2005
121 Palermo St, Davenport, FL 33897
$-851
Cash flow
-15.1%
Cash-on-Cash Return
2.7%
Cap rate
0.8%
Rent to Value Ratio
Active
$585,000
6
bds
|
6
ba
|
3,063
sqft
|
built
2014
1473 Moon Valley Dr, Davenport, FL 33896
$-1,820
Cash flow
-16.2%
Cash-on-Cash Return
2.4%
Cap rate
0.6%
Rent to Value Ratio
Active
$225,000
2
bds
|
3
ba
|
988
sqft
|
built
2006
652 Chelsea Dr, Davenport, FL 33897
$-477
Cash flow
-11.1%
Cash-on-Cash Return
3.6%
Cap rate
0.7%
Rent to Value Ratio
Active
$319,000
3
bds
|
2
ba
|
1,320
sqft
|
built
2004
806 Knightsbridge Cir, Davenport, FL 33896
$-647
Cash flow
-10.6%
Cash-on-Cash Return
3.7%
Cap rate
0.6%
Rent to Value Ratio
Active
$565,000
5
bds
|
5
ba
|
2,114
sqft
|
built
2015
5160 Oakbourne Ave, Davenport, FL 33837
$-1,438
Cash flow
-13.3%
Cash-on-Cash Return
3.1%
Cap rate
0.6%
Rent to Value Ratio
Active
$298,000
3
bds
|
2
ba
|
1,185
sqft
|
built
1999
212 Eckerd St, Davenport, FL 33837
$-486
Cash flow
-8.5%
Cash-on-Cash Return
4.2%
Cap rate
0.7%
Rent to Value Ratio
Active
$221,000
3
bds
|
2
ba
|
1,227
sqft
|
built
2006
511 Rum Run, Davenport, FL 33897
$-544
Cash flow
-12.8%
Cash-on-Cash Return
3.2%
Cap rate
0.9%
Rent to Value Ratio
Active
$745,000
9
bds
|
7
ba
|
4,594
sqft
|
built
2018
7004 Oakwood St, Davenport, FL 33837
$-2,033
Cash flow
-14.2%
Cash-on-Cash Return
2.9%
Cap rate
0.6%
Rent to Value Ratio
Active
$308,000
3
bds
|
2
ba
|
2,057
sqft
|
built
2005
669 Sierra Cir, Davenport, FL 33837
$-81
Cash flow
-1.4%
Cash-on-Cash Return
5.8%
Cap rate
0.7%
Rent to Value Ratio
Active
$849,000
8
bds
|
5
ba
|
3,909
sqft
|
built
2014
1430 Thunderbird Rd, Davenport, FL 33896
$-2,315
Cash flow
-14.2%
Cash-on-Cash Return
2.9%
Cap rate
0.6%
Rent to Value Ratio
Active
$445,000
4
bds
|
3
ba
|
1,914
sqft
|
built
2021
1144 Challenger Ave, Davenport, FL 33897
$-1,388
Cash flow
-16.3%
Cash-on-Cash Return
2.4%
Cap rate
0.6%
Rent to Value Ratio