Davenport, FL Investment Properties for Sale
Browse homes for sale and investment properties in Davenport, FL. Refine your search by price, property type, or more.
Best cash flowing properties in Davenport, FL
Active
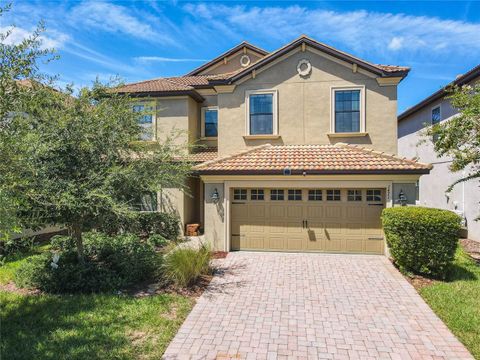
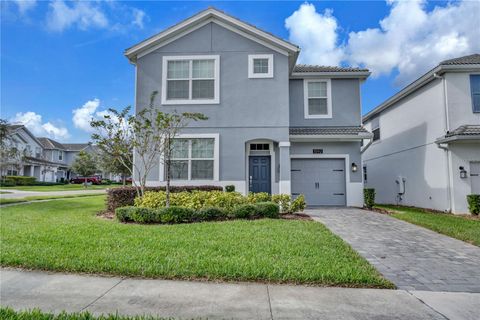
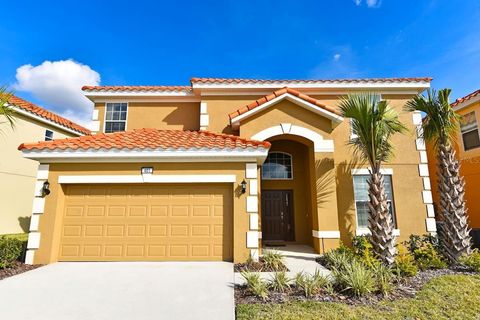
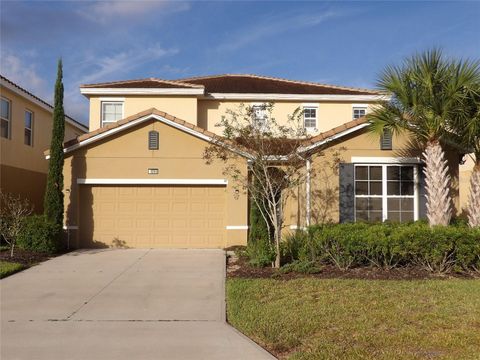
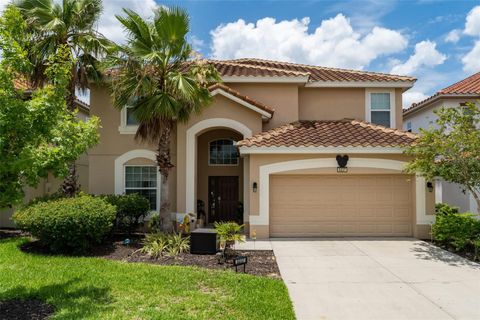
$203,000
3
bds
|
3
ba
|
1,217
sqft
|
built
2008
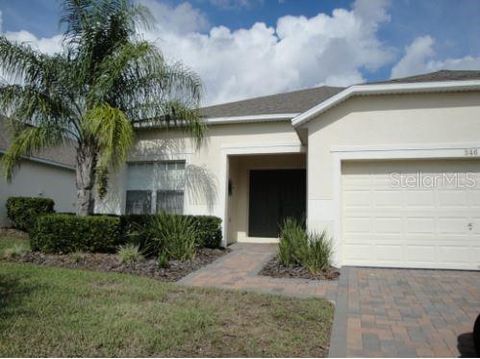
902 Charo Pkwy, Davenport, FL 33897
$-24
Cash flow
-0.6%
Cash-on-Cash Return
6.0%
Cap rate
0.9%
Rent to Value Ratio
Active
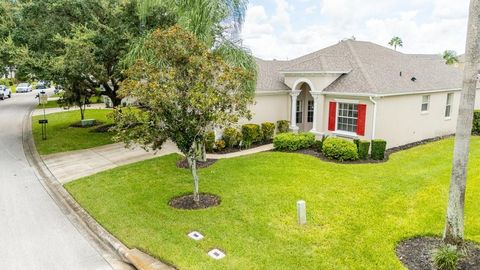
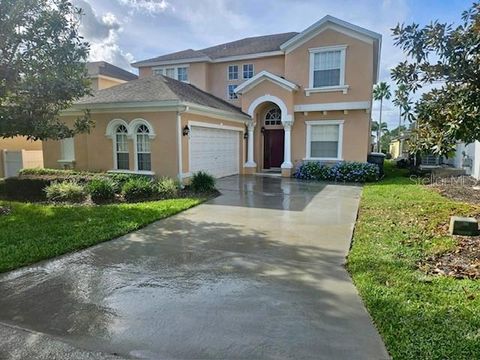
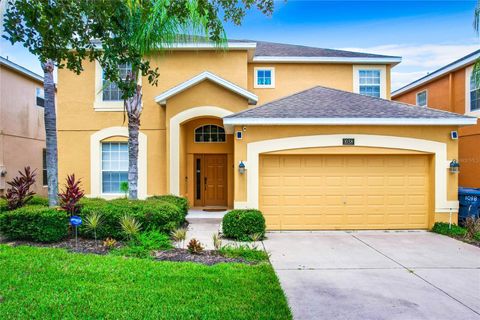
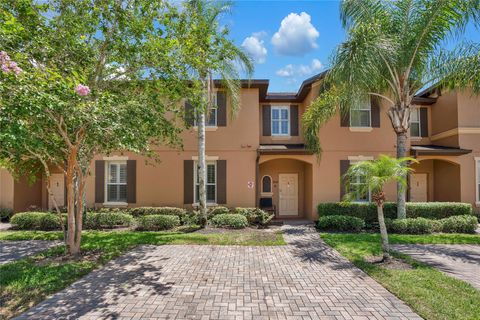
$310,000
4
bds
|
3
ba
|
1,664
sqft
|
built
2002
435 Caribbean Dr, Davenport, FL 33897
$-415
Cash flow
-7.0%
Cash-on-Cash Return
4.5%
Cap rate
0.7%
Rent to Value Ratio
804 out of 811 properties for sale in Davenport, FL
Limited Results Shown
Create a free account, or log in to reveal all property listings and enjoy the complete experience.
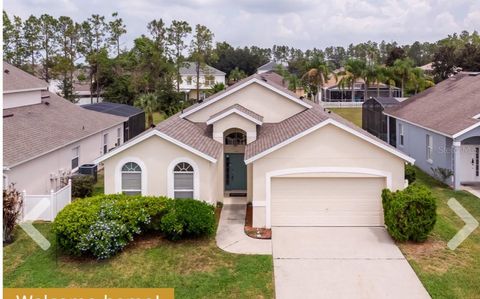
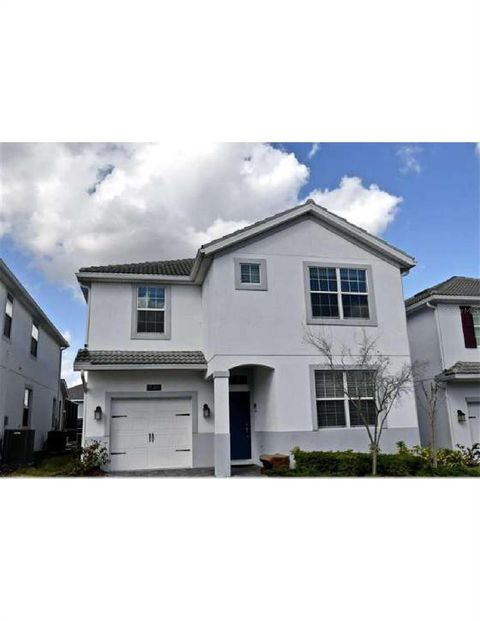
Active
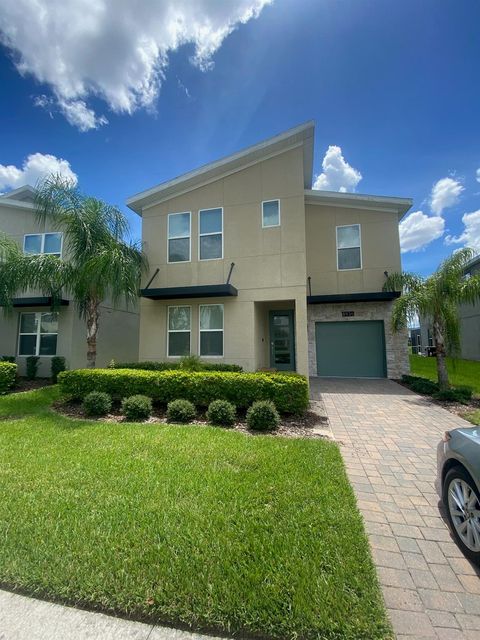
$570,800
5
bds
|
3
ba
|
2,772
sqft
|
built
2002
1740 N Hampton Dr, Davenport, FL 33897
$-759
Cash flow
-6.9%
Cash-on-Cash Return
4.6%
Cap rate
0.7%
Rent to Value Ratio
Active
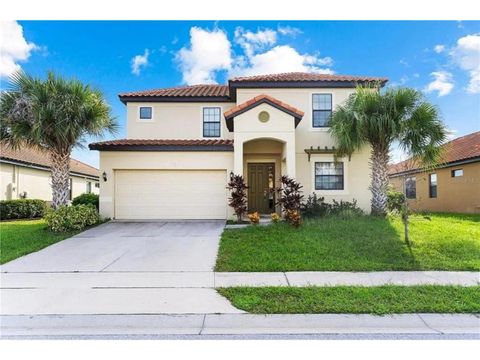
$520,000
6
bds
|
6
ba
|
3,579
sqft
|
built
2014
436 Orange Cosmos Blvd, Davenport, FL 33837
$-1,286
Cash flow
-12.9%
Cash-on-Cash Return
3.2%
Cap rate
0.7%
Rent to Value Ratio
Active
$185,000
2
bds
|
2
ba
|
1,134
sqft
|
built
2008
1301 Tuscan Ter, Davenport, FL 33896
$-602
Cash flow
-17.0%
Cash-on-Cash Return
2.2%
Cap rate
1.0%
Rent to Value Ratio

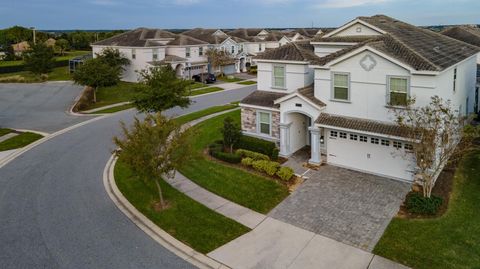
Active
$919,000
9
bds
|
5
ba
|
3,909
sqft
|
built
2013
1435 Moon Valley Dr, Davenport, FL 33896
$-2,397
Cash flow
-13.6%
Cash-on-Cash Return
3.0%
Cap rate
0.6%
Rent to Value Ratio
Active
$469,000
4
bds
|
3
ba
|
2,333
sqft
|
built
2020
1075 Trappers Trail Loop, Davenport, FL 33896
$-1,645
Cash flow
-18.3%
Cash-on-Cash Return
1.9%
Cap rate
0.6%
Rent to Value Ratio
Active
$387,200
4
bds
|
4
ba
|
2,094
sqft
|
built
2017
274 Captiva Dr, Davenport, FL 33896
$-918
Cash flow
-12.4%
Cash-on-Cash Return
3.3%
Cap rate
0.7%
Rent to Value Ratio
Active
$360,000
5
bds
|
3
ba
|
1,825
sqft
|
built
2005
1138 Knollwood Dr, Davenport, FL 33837
$-537
Cash flow
-7.8%
Cash-on-Cash Return
4.4%
Cap rate
0.7%
Rent to Value Ratio
Active
$625,000
6
bds
|
6
ba
|
3,339
sqft
|
built
2015
1471 Rolling Fairway Dr, Davenport, FL 33896
$-1,728
Cash flow
-14.4%
Cash-on-Cash Return
2.8%
Cap rate
0.6%
Rent to Value Ratio
Active
$429,900
4
bds
|
3
ba
|
1,903
sqft
|
built
2003
441 Montara Dr, Davenport, FL 33897
$-821
Cash flow
-10.0%
Cash-on-Cash Return
3.9%
Cap rate
0.7%
Rent to Value Ratio
Active
$284,900
3
bds
|
2
ba
|
1,893
sqft
|
built
2006
8311 Foster Dr, Davenport, FL 33896
$-662
Cash flow
-12.1%
Cash-on-Cash Return
3.4%
Cap rate
0.7%
Rent to Value Ratio
Active
$399,999
4
bds
|
3
ba
|
1,992
sqft
|
built
2001
443 Corvina Dr, Davenport, FL 33897
$-476
Cash flow
-6.2%
Cash-on-Cash Return
4.7%
Cap rate
0.7%
Rent to Value Ratio
Active
$670,000
6
bds
|
5
ba
|
3,291
sqft
|
built
2017
1592 Flange Dr, Davenport, FL 33896
$-1,907
Cash flow
-14.9%
Cash-on-Cash Return
2.7%
Cap rate
0.6%
Rent to Value Ratio
Active
$515,000
5
bds
|
4
ba
|
2,487
sqft
|
built
2002
476 Calabay Parc Blvd, Davenport, FL 33897
$-1,189
Cash flow
-12.0%
Cash-on-Cash Return
3.4%
Cap rate
0.6%
Rent to Value Ratio
Active
$645,000
6
bds
|
5
ba
|
3,291
sqft
|
built
2019
8936 Cabot Cliffs Dr, Davenport, FL 33896
$-1,994
Cash flow
-16.1%
Cash-on-Cash Return
2.4%
Cap rate
0.6%
Rent to Value Ratio

Active
$700,000
7
bds
|
5
ba
|
3,604
sqft
|
built
2013
9101 El Caro Ln, Davenport, FL 33896
$-2,090
Cash flow
-15.6%
Cash-on-Cash Return
2.6%
Cap rate
0.6%
Rent to Value Ratio
Active
$510,000
4
bds
|
4
ba
|
2,083
sqft
|
built
2015
2654 Rosemont Cir, Davenport, FL 33837
$-942
Cash flow
-9.6%
Cash-on-Cash Return
3.9%
Cap rate
0.6%
Rent to Value Ratio

Active
$345,000
4
bds
|
4
ba
|
2,156
sqft
|
built
2018
8502 Wingfoot Rd, Davenport, FL 33896
$-923
Cash flow
-14.0%
Cash-on-Cash Return
2.9%
Cap rate
0.7%
Rent to Value Ratio
Active
$203,000
3
bds
|
3
ba
|
1,217
sqft
|
built
2008
902 Charo Pkwy, Davenport, FL 33897
$-24
Cash flow
-0.6%
Cash-on-Cash Return
6.0%
Cap rate
0.9%
Rent to Value Ratio

Active
$299,000
3
bds
|
3
ba
|
1,632
sqft
|
built
2015
8110 Roseville Blvd, Davenport, FL 33896
$-954
Cash flow
-16.6%
Cash-on-Cash Return
2.3%
Cap rate
0.7%
Rent to Value Ratio
Active
$498,900
6
bds
|
6
ba
|
2,876
sqft
|
built
2016
401 Cabello Dr, Davenport, FL 33837
$-1,168
Cash flow
-12.2%
Cash-on-Cash Return
3.3%
Cap rate
0.6%
Rent to Value Ratio

Active
$392,500
5
bds
|
3
ba
|
2,522
sqft
|
built
2020
117 Eagleview Loop, Davenport, FL 33837
$-807
Cash flow
-10.7%
Cash-on-Cash Return
3.7%
Cap rate
0.7%
Rent to Value Ratio

Active
$1,145,000
6
bds
|
3
ba
|
2,850
sqft
|
built
1975
222 Rod Ln, Davenport, FL 33837
$-3,573
Cash flow
-16.3%
Cash-on-Cash Return
2.4%
Cap rate
0.3%
Rent to Value Ratio
Active
$490,000
5
bds
|
5
ba
|
2,554
sqft
|
built
2008
1038 Orange Cosmos Blvd, Davenport, FL 33837
$-1,226
Cash flow
-13.1%
Cash-on-Cash Return
3.1%
Cap rate
0.7%
Rent to Value Ratio

Active
$439,000
5
bds
|
3
ba
|
2,210
sqft
|
built
1999
241 Grosvenor Loop, Davenport, FL 33897
$-609
Cash flow
-7.2%
Cash-on-Cash Return
4.5%
Cap rate
0.7%
Rent to Value Ratio
Active
$209,990
3
bds
|
2
ba
|
1,244
sqft
|
built
2007
1370 Tuscan Ter, Davenport, FL 33896
$-416
Cash flow
-10.3%
Cash-on-Cash Return
3.8%
Cap rate
1.1%
Rent to Value Ratio
Active
$330,000
3
bds
|
2
ba
|
1,854
sqft
|
built
2016
8975 Azalea Sands Ln, Davenport, FL 33896
$-1,052
Cash flow
-16.6%
Cash-on-Cash Return
2.3%
Cap rate
0.7%
Rent to Value Ratio
Active
$529,897
6
bds
|
6
ba
|
3,270
sqft
|
built
2019
5265 Oakbourne Ave, Davenport, FL 33837
$-1,278
Cash flow
-12.6%
Cash-on-Cash Return
3.3%
Cap rate
0.6%
Rent to Value Ratio
Active
$379,990
4
bds
|
2
ba
|
1,562
sqft
|
built
2000
104 Langham Dr, Davenport, FL 33897
$-513
Cash flow
-7.0%
Cash-on-Cash Return
4.5%
Cap rate
0.7%
Rent to Value Ratio
Active
$385,000
3
bds
|
2
ba
|
1,787
sqft
|
built
2020
875 Ocean Course Ave, Davenport, FL 33896
$-1,191
Cash flow
-16.1%
Cash-on-Cash Return
2.4%
Cap rate
0.6%
Rent to Value Ratio
Active
$218,000
4
bds
|
3
ba
|
1,437
sqft
|
built
2008
901 Charo Pkwy, Davenport, FL 33897
$-1,109
Cash flow
-26.5%
Cash-on-Cash Return
0.0%
Cap rate
1.1%
Rent to Value Ratio
Active
$400,000
4
bds
|
3
ba
|
1,804
sqft
|
built
2004
346 Kildrummy Dr, Davenport, FL 33896
$-870
Cash flow
-11.3%
Cash-on-Cash Return
3.5%
Cap rate
0.7%
Rent to Value Ratio

Active
$464,000
5
bds
|
6
ba
|
2,460
sqft
|
built
2015
4791 Terrasonesta Dr, Davenport, FL 33837
$-1,376
Cash flow
-15.5%
Cash-on-Cash Return
2.6%
Cap rate
0.7%
Rent to Value Ratio

Active
$329,900
4
bds
|
3
ba
|
1,856
sqft
|
built
2005
744 La Mirage St, Davenport, FL 33897
$-940
Cash flow
-14.9%
Cash-on-Cash Return
2.7%
Cap rate
0.8%
Rent to Value Ratio
Active
$409,995
4
bds
|
3
ba
|
1,774
sqft
|
built
2002
475 Windsor Pl, Davenport, FL 33896
$-1,245
Cash flow
-15.8%
Cash-on-Cash Return
2.5%
Cap rate
0.5%
Rent to Value Ratio
Active
$690,000
6
bds
|
5
ba
|
3,291
sqft
|
built
2017
1585 Mulligan Blvd, Davenport, FL 33896
$-2,086
Cash flow
-15.8%
Cash-on-Cash Return
2.5%
Cap rate
0.6%
Rent to Value Ratio
Active
$860,000
8
bds
|
5
ba
|
3,909
sqft
|
built
2017
9076 Hazard St, Davenport, FL 33896
$-2,186
Cash flow
-13.3%
Cash-on-Cash Return
3.1%
Cap rate
0.6%
Rent to Value Ratio
Active
$530,000
6
bds
|
5
ba
|
2,815
sqft
|
built
2015
5237 Oakbourne Ave, Davenport, FL 33837
$-1,332
Cash flow
-13.1%
Cash-on-Cash Return
3.1%
Cap rate
0.7%
Rent to Value Ratio
Active
$350,000
3
bds
|
2
ba
|
1,408
sqft
|
built
2005
619 Kensington Dr, Davenport, FL 33897
$-587
Cash flow
-8.8%
Cash-on-Cash Return
4.1%
Cap rate
0.7%
Rent to Value Ratio
Active
$310,000
4
bds
|
3
ba
|
1,664
sqft
|
built
2002
435 Caribbean Dr, Davenport, FL 33897
$-415
Cash flow
-7.0%
Cash-on-Cash Return
4.5%
Cap rate
0.7%
Rent to Value Ratio
Active
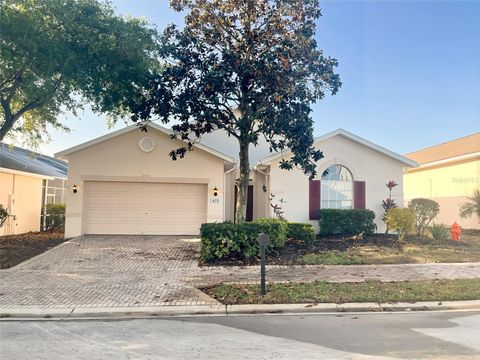
$229,000
4
bds
|
3
ba
|
1,425
sqft
|
built
2007
3622 Calabria Ave, Davenport, FL 33897
$-1,065
Cash flow
-24.3%
Cash-on-Cash Return
0.6%
Cap rate
1.0%
Rent to Value Ratio