Davenport, FL Investment Properties for Sale
Browse homes for sale and investment properties in Davenport, FL. Refine your search by price, property type, or more.
Best cash flowing properties in Davenport, FL
Active
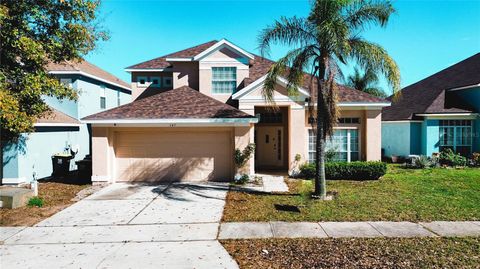
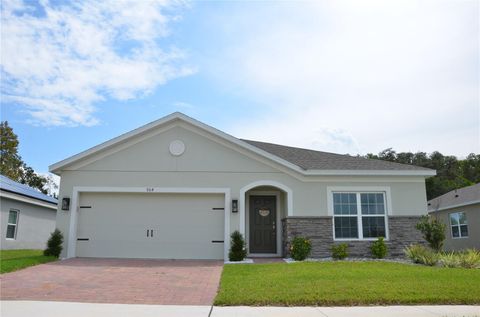
$370,000
4
bds
|
2
ba
|
1,864
sqft
|
built
1992
132 Robbins Rest Cir, Davenport, FL 33896
$-239
Cash flow
-3.4%
Cash-on-Cash Return
5.4%
Cap rate
0.7%
Rent to Value Ratio
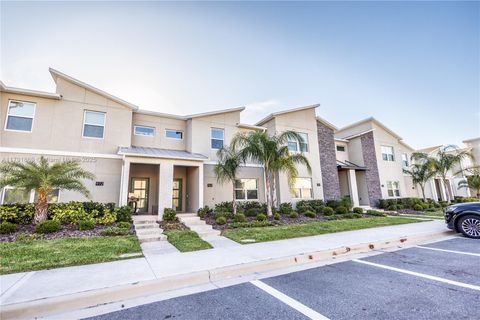
Active
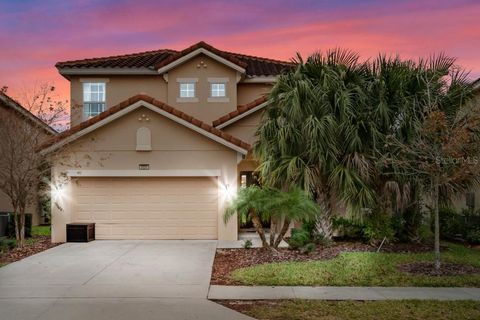
$219,000
3
bds
|
2
ba
|
1,244
sqft
|
built
2007
8020 Tuscany Way, Davenport, FL 33896
$-330
Cash flow
-7.9%
Cash-on-Cash Return
4.3%
Cap rate
0.8%
Rent to Value Ratio
804 out of 811 properties for sale in Davenport, FL
Limited Results Shown
Create a free account, or log in to reveal all property listings and enjoy the complete experience.
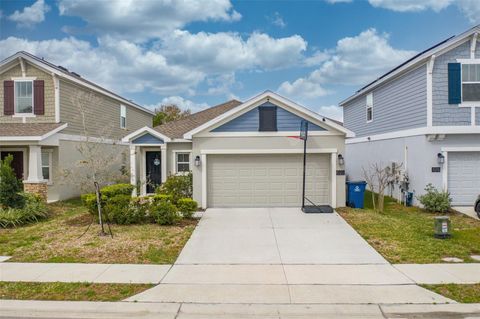
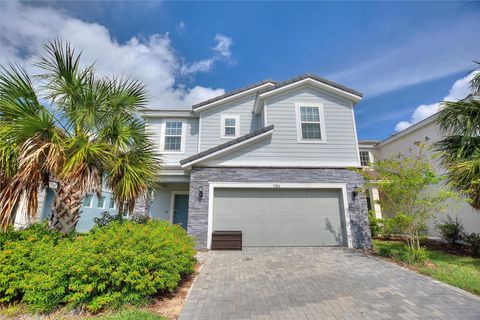
Active
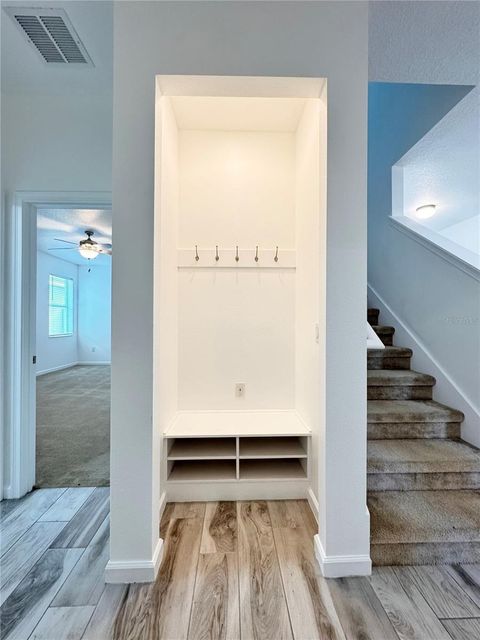
$275,000
4
bds
|
3
ba
|
1,492
sqft
|
built
2005
244 Capri Dr, Davenport, FL 33897
$-605
Cash flow
-11.5%
Cash-on-Cash Return
3.5%
Cap rate
0.9%
Rent to Value Ratio
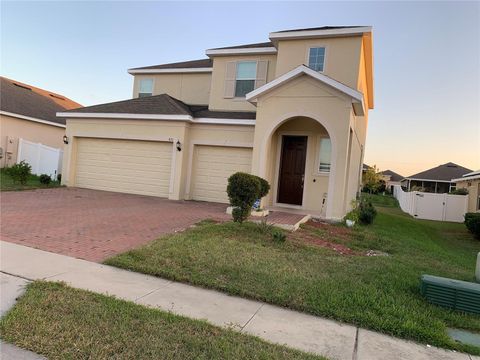
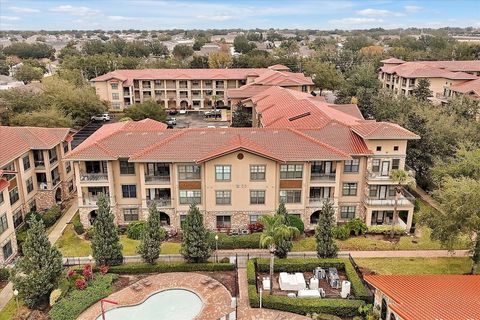
Active
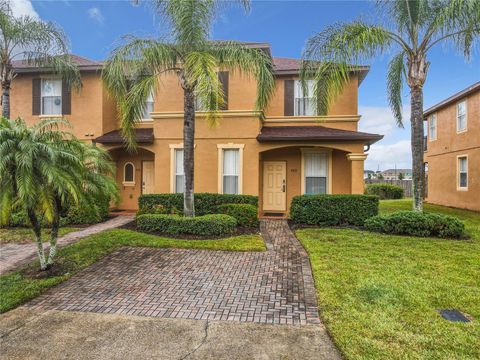
$497,499
4
bds
|
3
ba
|
2,120
sqft
|
built
2015
4036 Oakrise Loop, Davenport, FL 33837
$-1,317
Cash flow
-13.8%
Cash-on-Cash Return
3.0%
Cap rate
0.6%
Rent to Value Ratio
Active
$219,000
3
bds
|
2
ba
|
1,244
sqft
|
built
2007
8020 Tuscany Way, Davenport, FL 33896
$-330
Cash flow
-7.9%
Cash-on-Cash Return
4.3%
Cap rate
0.8%
Rent to Value Ratio
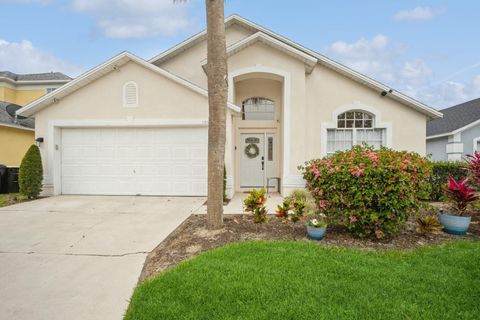
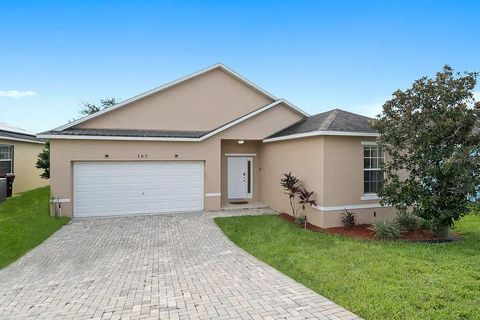
Active
$339,000
4
bds
|
2
ba
|
1,354
sqft
|
built
2000
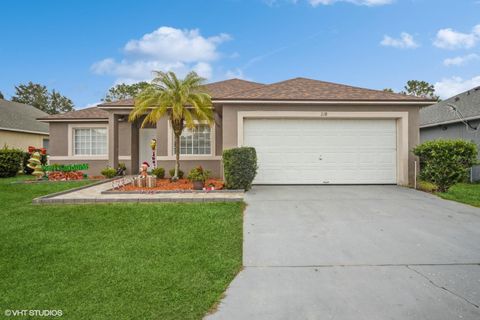
218 Hillcrest Dr, Davenport, FL 33897
$-348
Cash flow
-5.4%
Cash-on-Cash Return
4.9%
Cap rate
0.7%
Rent to Value Ratio
Active
$236,900
2
bds
|
2
ba
|
600
sqft
|
built
1962
1526 Lakewood Rd, Davenport, FL 33837
$-349
Cash flow
-7.7%
Cash-on-Cash Return
4.4%
Cap rate
0.6%
Rent to Value Ratio
Active
$415,000
4
bds
|
3
ba
|
1,902
sqft
|
built
2000
340 Troon Cir, Davenport, FL 33897
$-623
Cash flow
-7.8%
Cash-on-Cash Return
4.3%
Cap rate
0.7%
Rent to Value Ratio
Active
$524,500
5
bds
|
3
ba
|
3,282
sqft
|
built
2017
172 Seville Dr, Davenport, FL 33837
$-939
Cash flow
-9.3%
Cash-on-Cash Return
4.0%
Cap rate
0.6%
Rent to Value Ratio

Active
$425,000
4
bds
|
4
ba
|
2,094
sqft
|
built
2016
301 Captiva Dr, Davenport, FL 33896
$-1,230
Cash flow
-15.1%
Cash-on-Cash Return
2.7%
Cap rate
0.6%
Rent to Value Ratio
Active
$370,000
4
bds
|
2
ba
|
1,864
sqft
|
built
1992
132 Robbins Rest Cir, Davenport, FL 33896
$-239
Cash flow
-3.4%
Cash-on-Cash Return
5.4%
Cap rate
0.7%
Rent to Value Ratio
Active
$469,000
5
bds
|
4
ba
|
2,984
sqft
|
built
2008
573 Viola Dr, Davenport, FL 33837
$-718
Cash flow
-8.0%
Cash-on-Cash Return
4.3%
Cap rate
0.7%
Rent to Value Ratio
Active
$689,000
8
bds
|
5
ba
|
3,922
sqft
|
built
2020
8834 Cabot Cliffs Dr, Davenport, FL 33896
$-2,063
Cash flow
-15.6%
Cash-on-Cash Return
2.6%
Cap rate
0.6%
Rent to Value Ratio
Active
$1,165,000
12
bds
|
12
ba
|
4,887
sqft
|
built
2019
5300 Oakbourne Ave, Davenport, FL 33837
$-5,009
Cash flow
-22.4%
Cash-on-Cash Return
1.0%
Cap rate
0.3%
Rent to Value Ratio
Active
$479,990
5
bds
|
5
ba
|
2,076
sqft
|
built
2018
4611 Terrasonesta Dr, Davenport, FL 33837
$-1,582
Cash flow
-17.2%
Cash-on-Cash Return
2.2%
Cap rate
0.6%
Rent to Value Ratio
Active
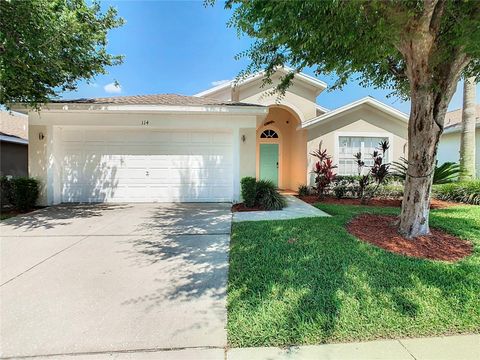
$419,000
4
bds
|
3
ba
|
1,672
sqft
|
built
2000
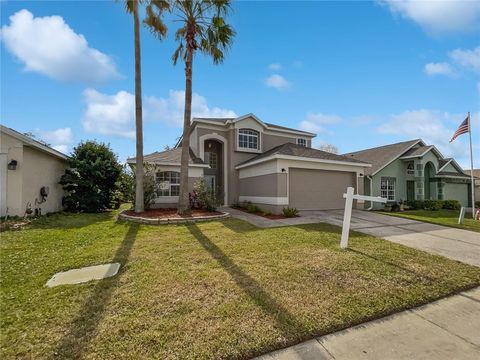
114 Castlemain Cir, Davenport, FL 33897
$-720
Cash flow
-9.0%
Cash-on-Cash Return
4.1%
Cap rate
0.7%
Rent to Value Ratio
Active
$389,990
4
bds
|
2
ba
|
2,182
sqft
|
built
2021
875 Fillmore Ct, Davenport, FL 33837
$-965
Cash flow
-12.9%
Cash-on-Cash Return
3.2%
Cap rate
0.7%
Rent to Value Ratio
Active
$220,000
3
bds
|
2
ba
|
1,244
sqft
|
built
2007
8010 Tuscany Way, Davenport, FL 33896
$-335
Cash flow
-7.9%
Cash-on-Cash Return
4.3%
Cap rate
0.8%
Rent to Value Ratio
Active
$360,000
4
bds
|
2
ba
|
1,882
sqft
|
built
1995
923 Downing Cir, Davenport, FL 33897
$-498
Cash flow
-7.2%
Cash-on-Cash Return
4.5%
Cap rate
0.7%
Rent to Value Ratio
Active
$460,000
4
bds
|
3
ba
|
0
sqft
|
built
2021
968 Leader St, Davenport, FL 33896
$-1,410
Cash flow
-16.0%
Cash-on-Cash Return
2.5%
Cap rate
0.6%
Rent to Value Ratio
Active
$425,500
4
bds
|
2
ba
|
1,940
sqft
|
built
1999
155 Holborn Loop, Davenport, FL 33897
$-657
Cash flow
-8.1%
Cash-on-Cash Return
4.3%
Cap rate
0.7%
Rent to Value Ratio

Active
$949,000
10
bds
|
8
ba
|
4,399
sqft
|
built
2022
4289 Lana Ave, Davenport, FL 33897
$-2,537
Cash flow
-13.9%
Cash-on-Cash Return
2.9%
Cap rate
0.6%
Rent to Value Ratio
Active
$385,000
4
bds
|
3
ba
|
1,935
sqft
|
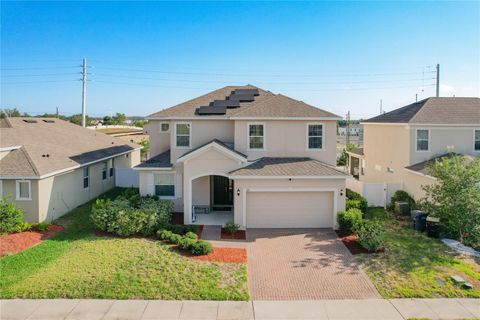
built
2017
431 Aragosa Dr, Davenport, FL 33837
$-668
Cash flow
-9.1%
Cash-on-Cash Return
4.1%
Cap rate
0.6%
Rent to Value Ratio
Active
$314,990
3
bds
|
2
ba
|
1,432
sqft
|
built
2022
522 Jett Ln, Davenport, FL 33837
$-557
Cash flow
-9.2%
Cash-on-Cash Return
4.0%
Cap rate
0.7%
Rent to Value Ratio

Active
$729,800
6
bds
|
6
ba
|
3,339
sqft
|
built
2019
8854 Cabot Cliffs Dr, Davenport, FL 33896
$-1,981
Cash flow
-14.2%
Cash-on-Cash Return
2.9%
Cap rate
0.5%
Rent to Value Ratio
Active
$238,000
2
bds
|
2
ba
|
1,435
sqft
|
built
2007
8316 Fontera Dr, Davenport, FL 33896
$-842
Cash flow
-18.5%
Cash-on-Cash Return
1.9%
Cap rate
0.8%
Rent to Value Ratio
Active
$1,250,000
13
bds
|
11
ba
|
6,542
sqft
|
built
2021
1758 Oak Blossom Dr, Davenport, FL 33837
$-5,265
Cash flow
-22.0%
Cash-on-Cash Return
1.1%
Cap rate
0.4%
Rent to Value Ratio

Active
$635,000
5
bds
|
5
ba
|
3,081
sqft
|
built
2020
751 Drop Shot Dr, Davenport, FL 33896
$-1,760
Cash flow
-14.5%
Cash-on-Cash Return
2.8%
Cap rate
0.6%
Rent to Value Ratio
Active
$421,985
5
bds
|
5
ba
|
2,281
sqft
|
built
2020
7455 Oakmoss Loop, Davenport, FL 33837
$-1,102
Cash flow
-13.6%
Cash-on-Cash Return
3.0%
Cap rate
0.8%
Rent to Value Ratio
Active
$480,000
6
bds
|
5
ba
|
2,821
sqft
|
built
2015
1019 Orange Cosmos Blvd, Davenport, FL 33837
$-1,123
Cash flow
-12.2%
Cash-on-Cash Return
3.3%
Cap rate
0.7%
Rent to Value Ratio
Active
$445,000
5
bds
|
3
ba
|
2,269
sqft
|
built
1998
347 Riggs Cir, Davenport, FL 33897
$-743
Cash flow
-8.7%
Cash-on-Cash Return
4.1%
Cap rate
0.6%
Rent to Value Ratio
Active
$674,000
7
bds
|
5
ba
|
3,629
sqft
|
built
2016
5220 Oakbourne Ave, Davenport, FL 33837
$-1,463
Cash flow
-11.3%
Cash-on-Cash Return
3.5%
Cap rate
0.7%
Rent to Value Ratio
Active
$420,000
4
bds
|
3
ba
|
2,415
sqft
|
built
2019
224 Trinity Ridge Cir, Davenport, FL 33897
$-888
Cash flow
-11.0%
Cash-on-Cash Return
3.6%
Cap rate
0.6%
Rent to Value Ratio
Active
$325,000
4
bds
|
4
ba
|
1,856
sqft
|
built
2006
702 Calabria Ave, Davenport, FL 33897
$-844
Cash flow
-13.5%
Cash-on-Cash Return
3.0%
Cap rate
0.8%
Rent to Value Ratio
Active
$435,000
4
bds
|
2
ba
|
2,112
sqft
|
built
2021
964 Avenal Ln, Davenport, FL 33837
$-571
Cash flow
-6.8%
Cash-on-Cash Return
4.6%
Cap rate
0.6%
Rent to Value Ratio
Active
$640,000
7
bds
|
6
ba
|
3,176
sqft
|
built
2020
7380 Oakmoss Loop, Davenport, FL 33837
$-1,548
Cash flow
-12.6%
Cash-on-Cash Return
3.2%
Cap rate
0.6%
Rent to Value Ratio
Active
$186,900
3
bds
|
3
ba
|
1,326
sqft
|
built
2008
904 Charo Pkwy, Davenport, FL 33897
$-981
Cash flow
-27.4%
Cash-on-Cash Return
-0.2%
Cap rate
1.2%
Rent to Value Ratio

Active
$375,000
4
bds
|
2
ba
|
1,950
sqft
|
built
2007
662 Rosselli Blvd, Davenport, FL 33896
$-394
Cash flow
-5.5%
Cash-on-Cash Return
4.9%
Cap rate
0.7%
Rent to Value Ratio
Active
$375,000
4
bds
|
3
ba
|
1,829
sqft
|
built
2008
165 Captain Hook Way, Davenport, FL 33837
$-783
Cash flow
-10.9%
Cash-on-Cash Return
3.6%
Cap rate
0.6%
Rent to Value Ratio
Active
$340,000
2
bds
|
2
ba
|
1,388
sqft
|
built
2022
8879 Cabot Cliffs Dr, Davenport, FL 33896
$-462
Cash flow
-7.1%
Cash-on-Cash Return
4.5%
Cap rate
0.7%
Rent to Value Ratio

Active
$385,839
5
bds
|
3
ba
|
1,680
sqft
|
built
2008
2005 Royal Ridge Dr, Davenport, FL 33896
$-635
Cash flow
-8.6%
Cash-on-Cash Return
4.2%
Cap rate
0.6%
Rent to Value Ratio

Active
$794,900
8
bds
|
5
ba
|
3,909
sqft
|
built
2017
9098 Hazard St, Davenport, FL 33896
$-963
Cash flow
-6.3%
Cash-on-Cash Return
4.7%
Cap rate
0.8%
Rent to Value Ratio