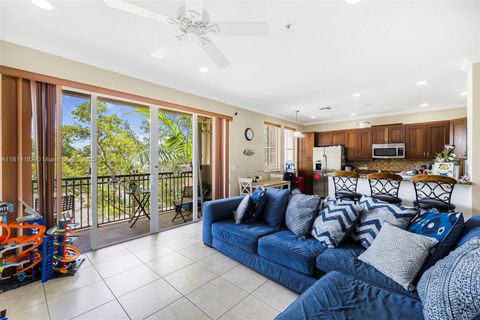
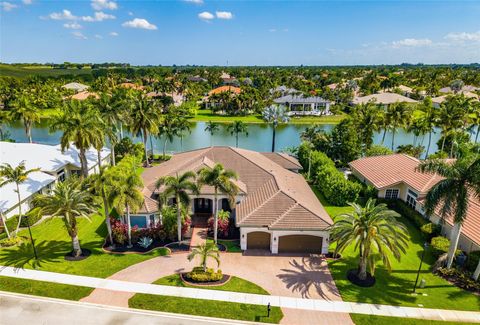
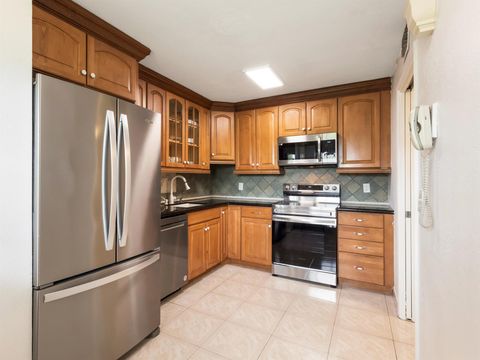
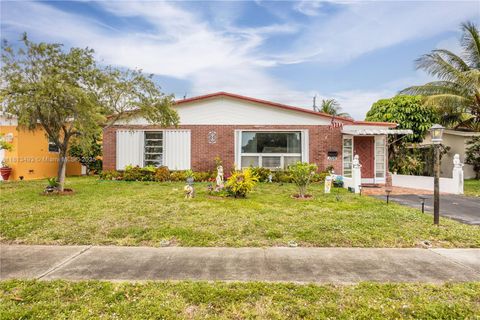
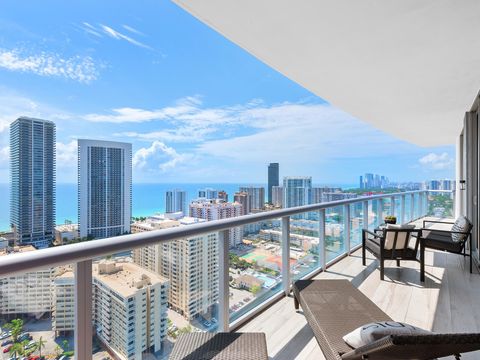
Broward County Investment Properties for Sale
Browse homes for sale and investment properties in Broward County. Refine your search by price, property type, or more.
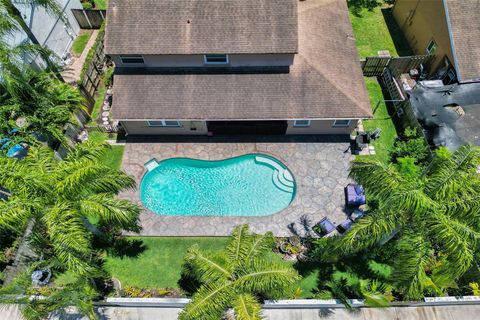
Best cash flowing properties in Broward County
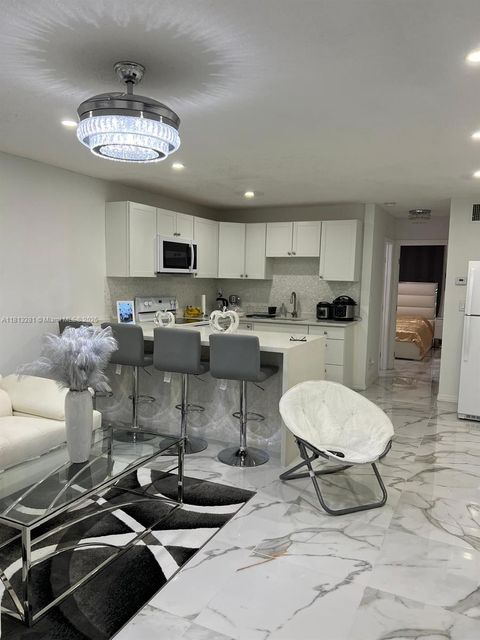
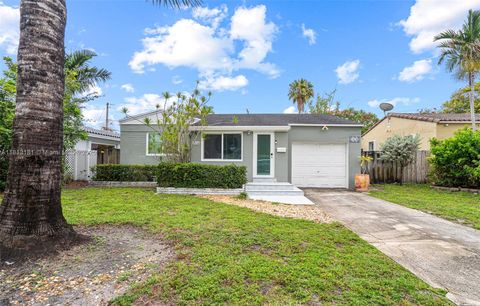
Active
$180,000
1
bds
|
1
ba
|
552
sqft
|
built
1969
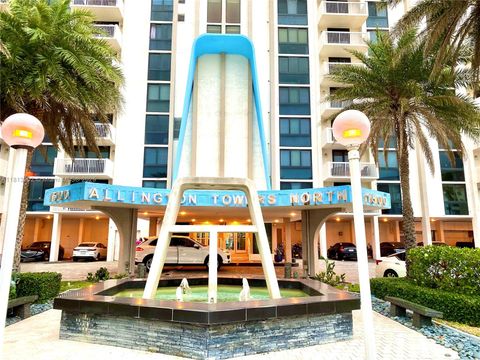
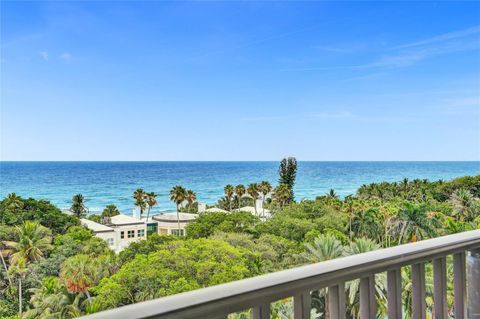
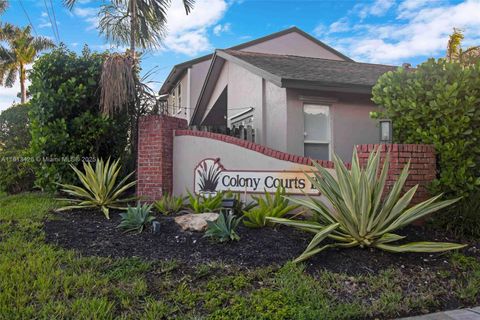
2905 Pierce St, Hollywood, FL 33020
$-282
Cash flow
-8.2%
Cash-on-Cash Return
4.3%
Cap rate
1.0%
Rent to Value Ratio
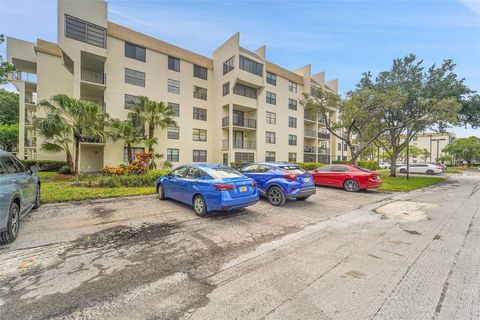
Active
$180,000
2
bds
|
2
ba
|
1,030
sqft
|
built
1978
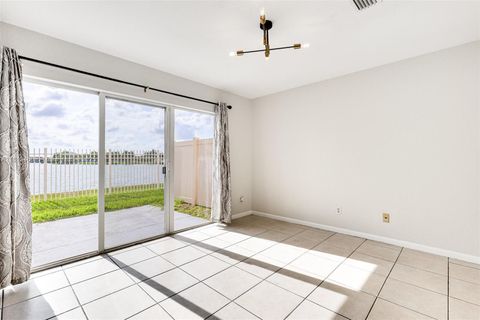
6193 Rock Island Rd, Tamarac, FL 33319
$-474
Cash flow
-13.7%
Cash-on-Cash Return
3.0%
Cap rate
1.1%
Rent to Value Ratio
8,187 out of 9,558 properties for sale in Broward County
Limited Results Shown
Create a free account, or log in to reveal all property listings and enjoy the complete experience.
Active
$795,000
4
bds
|
3
ba
|
2,110
sqft
|
built
1963
6640 SW 7th St, Pembroke Pines, FL 33023
$-2,689
Cash flow
-17.6%
Cash-on-Cash Return
2.1%
Cap rate
0.4%
Rent to Value Ratio
Active
$560,000
2
bds
|
2
ba
|
1,120
sqft
|
built
1967
3111 N Ocean Dr, Hollywood, FL 33019
$-2,243
Cash flow
-20.9%
Cash-on-Cash Return
1.3%
Cap rate
0.7%
Rent to Value Ratio
Active
$535,000
2
bds
|
1
ba
|
1,137
sqft
|
built
1940
1636 Arthur St, Hollywood, FL 33020
$-1,115
Cash flow
-10.9%
Cash-on-Cash Return
3.6%
Cap rate
0.7%
Rent to Value Ratio
Active
$685,000
4
bds
|
2
ba
|
2,131
sqft
|
built
1986
3985 NW 73rd Way, Coral Springs, FL 33065
$-694
Cash flow
-5.3%
Cash-on-Cash Return
4.9%
Cap rate
0.7%
Rent to Value Ratio
Active
$489,000
3
bds
|
2
ba
|
1,484
sqft
|
built
1973
520 SW 13th Pl, Deerfield Beach, FL 33441
$-869
Cash flow
-9.3%
Cash-on-Cash Return
4.0%
Cap rate
0.7%
Rent to Value Ratio
Active
$850,000
3
bds
|
3
ba
|
1,740
sqft
|
built
1972
1985 S Ocean Dr, Hallandale Beach, FL 33009
$-2,921
Cash flow
-17.9%
Cash-on-Cash Return
2.0%
Cap rate
0.7%
Rent to Value Ratio
Active
$499,000
2
bds
|
2
ba
|
1,254
sqft
|
built
1973
1500 S Ocean Dr, Hollywood, FL 33019
$-1,857
Cash flow
-19.4%
Cash-on-Cash Return
1.7%
Cap rate
0.8%
Rent to Value Ratio
Active
$309,999
2
bds
|
2
ba
|
1,220
sqft
|
built
1980
296 Racquet Club Rd, Weston, FL 33326
$-665
Cash flow
-11.2%
Cash-on-Cash Return
3.6%
Cap rate
0.8%
Rent to Value Ratio
Active
$570,000
2
bds
|
2
ba
|
1,100
sqft
|
built
1976
2841 N Ocean Blvd, Fort Lauderdale, FL 33308
$-2,438
Cash flow
-22.3%
Cash-on-Cash Return
1.0%
Cap rate
0.6%
Rent to Value Ratio
Active
$255,000
1
bds
|
1
ba
|
436
sqft
|
built
2020
4100 SW 64th Ave, Davie, FL 33314
$-867
Cash flow
-17.7%
Cash-on-Cash Return
2.1%
Cap rate
0.7%
Rent to Value Ratio
Active
$499,900
3
bds
|
3
ba
|
1,865
sqft
|
built
2008
3055 NW 126th Ave, Sunrise, FL 33323
$-1,977
Cash flow
-20.6%
Cash-on-Cash Return
1.4%
Cap rate
0.7%
Rent to Value Ratio
Active
$1,999,900
5
bds
|
4
ba
|
4,150
sqft
|
built
2004
14904 SW 35th St, Davie, FL 33331
$-7,018
Cash flow
-18.3%
Cash-on-Cash Return
1.9%
Cap rate
0.3%
Rent to Value Ratio
Active
$274,900
2
bds
|
2
ba
|
1,216
sqft
|
built
1980
4030 W Palm Aire Dr, Pompano Beach, FL 33069
$-899
Cash flow
-17.1%
Cash-on-Cash Return
2.2%
Cap rate
0.8%
Rent to Value Ratio
Active
$625,000
3
bds
|
3
ba
|
2,387
sqft
|
built
1961
1706 N 45th Ave, Hollywood, FL 33021
$-1,547
Cash flow
-12.9%
Cash-on-Cash Return
3.2%
Cap rate
0.6%
Rent to Value Ratio
Active
$694,999
4
bds
|
2
ba
|
2,188
sqft
|
built
2000
5445 NW 122nd Dr, Coral Springs, FL 33076
$-847
Cash flow
-6.4%
Cash-on-Cash Return
4.7%
Cap rate
0.7%
Rent to Value Ratio
Active
$480,000
3
bds
|
3
ba
|
1,584
sqft
|
built
2001
1114 NW 100th Ave, Pembroke Pines, FL 33024
$-1,273
Cash flow
-13.8%
Cash-on-Cash Return
3.0%
Cap rate
0.6%
Rent to Value Ratio
Active
$240,000
3
bds
|
3
ba
|
1,740
sqft
|
built
1977
6649 Racquet Club Dr, Lauderhill, FL 33319
$-475
Cash flow
-10.3%
Cash-on-Cash Return
3.8%
Cap rate
1.1%
Rent to Value Ratio
Active
$345,000
3
bds
|
3
ba
|
1,245
sqft
|
built
1984
7750 NW 79th Ave, Tamarac, FL 33321
$-880
Cash flow
-13.3%
Cash-on-Cash Return
3.1%
Cap rate
0.7%
Rent to Value Ratio
Active
$625,000
4
bds
|
2
ba
|
2,200
sqft
|
built
1966
4709 Washington St, Hollywood, FL 33021
$-716
Cash flow
-6.0%
Cash-on-Cash Return
4.8%
Cap rate
0.8%
Rent to Value Ratio
Active
$549,000
2
bds
|
1
ba
|
1,086
sqft
|
built
2006
1800 S Ocean Dr, Hallandale Beach, FL 33009
$-2,110
Cash flow
-20.1%
Cash-on-Cash Return
1.5%
Cap rate
0.7%
Rent to Value Ratio
Active
$1,095,000
2
bds
|
2
ba
|
0
sqft
|
built
1936
801 SE 7th St, Fort Lauderdale, FL 33301
$-1,911
Cash flow
-9.1%
Cash-on-Cash Return
4.1%
Cap rate
0.5%
Rent to Value Ratio
Active
$418,500
2
bds
|
2
ba
|
1,094
sqft
|
built
1970
1410 S Ocean Dr, Hollywood, FL 33019
$-788
Cash flow
-9.8%
Cash-on-Cash Return
3.9%
Cap rate
0.7%
Rent to Value Ratio
Active
$950,000
3
bds
|
3
ba
|
1,737
sqft
|
built
2013
2600 E Hallandale Beach Blvd, Hallandale Beach, FL 33009
$-3,551
Cash flow
-19.5%
Cash-on-Cash Return
1.7%
Cap rate
0.7%
Rent to Value Ratio
Active
$12,995,000
6
bds
|
8
ba
|
7,190
sqft
|
built
2020
2519 Lucille Dr, Fort Lauderdale, FL 33316
$-75,352
Cash flow
-30.3%
Cash-on-Cash Return
-0.8%
Cap rate
0.1%
Rent to Value Ratio
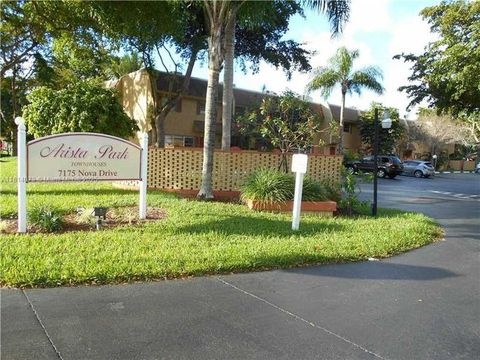
Active
$270,000
2
bds
|
2
ba
|
1,250
sqft
|
built
1977
7175 Nova Dr, Davie, FL 33317
$-797
Cash flow
-15.4%
Cash-on-Cash Return
2.6%
Cap rate
0.9%
Rent to Value Ratio
Active
$415,000
5
bds
|
2
ba
|
1,703
sqft
|
built
1970
766 NW 35th Ave, Lauderhill, FL 33311
$-982
Cash flow
-12.3%
Cash-on-Cash Return
3.3%
Cap rate
0.7%
Rent to Value Ratio
Active
$724,900
4
bds
|
3
ba
|
2,376
sqft
|
built
1988
1325 SW 151st Way, Sunrise, FL 33326
$-1,445
Cash flow
-10.4%
Cash-on-Cash Return
3.8%
Cap rate
0.5%
Rent to Value Ratio
Active
$375,000
2
bds
|
2
ba
|
1,335
sqft
|
built
2007
510 NW 84th Ave, Plantation, FL 33324
$-1,775
Cash flow
-24.7%
Cash-on-Cash Return
0.5%
Cap rate
0.9%
Rent to Value Ratio
Active
$385,000
3
bds
|
3
ba
|
1,219
sqft
|
built
2004
8244 Prestige Commons Dr, Tamarac, FL 33321
$-1,054
Cash flow
-14.3%
Cash-on-Cash Return
2.9%
Cap rate
0.6%
Rent to Value Ratio
Active
$1,495,003
5
bds
|
4
ba
|
3,148
sqft
|
built
1979
5790 SW 37th Ter, Fort Lauderdale, FL 33312
$-4,814
Cash flow
-16.8%
Cash-on-Cash Return
2.3%
Cap rate
0.3%
Rent to Value Ratio
Active
$650,000
2
bds
|
2
ba
|
1,330
sqft
|
built
1974
1150 Hillsboro Mile, Hillsboro Beach, FL 33062
$-2,043
Cash flow
-16.4%
Cash-on-Cash Return
2.4%
Cap rate
0.6%
Rent to Value Ratio
Active
$435,000
3
bds
|
3
ba
|
1,474
sqft
|
built
2006
2053 SW 87th Ter, Miramar, FL 33025
$-1,086
Cash flow
-13.0%
Cash-on-Cash Return
3.2%
Cap rate
0.6%
Rent to Value Ratio
Active
$350,000
2
bds
|
2
ba
|
1,400
sqft
|
built
1970
3100 NE 49th St, Fort Lauderdale, FL 33308
$-1,664
Cash flow
-24.8%
Cash-on-Cash Return
0.4%
Cap rate
0.8%
Rent to Value Ratio
Active
$345,000
2
bds
|
2
ba
|
1,100
sqft
|
built
1972
1833 S Ocean Dr, Hallandale Beach, FL 33009
$-1,315
Cash flow
-19.9%
Cash-on-Cash Return
1.6%
Cap rate
0.8%
Rent to Value Ratio
Active
$395,000
2
bds
|
2
ba
|
1,388
sqft
|
built
1993
3897 NW 122nd Ter, Sunrise, FL 33323
$-599
Cash flow
-7.9%
Cash-on-Cash Return
4.3%
Cap rate
0.7%
Rent to Value Ratio

Active
$795,000
4
bds
|
3
ba
|
2,391
sqft
|
built
2001
4946 SW 166th Ave, Miramar, FL 33027
$-2,319
Cash flow
-15.2%
Cash-on-Cash Return
2.6%
Cap rate
0.6%
Rent to Value Ratio
Active
$240,000
2
bds
|
2
ba
|
967
sqft
|
built
2000
4828 N State Road 7, Coconut Creek, FL 33073
$-833
Cash flow
-18.1%
Cash-on-Cash Return
2.0%
Cap rate
0.8%
Rent to Value Ratio
Active
$470,000
3
bds
|
3
ba
|
1,361
sqft
|
built
1998
20816 NW 2nd St, Pembroke Pines, FL 33029
$-1,333
Cash flow
-14.8%
Cash-on-Cash Return
2.7%
Cap rate
0.6%
Rent to Value Ratio