Broward County Investment Properties for Sale
Browse homes for sale and investment properties in Broward County. Refine your search by price, property type, or more.
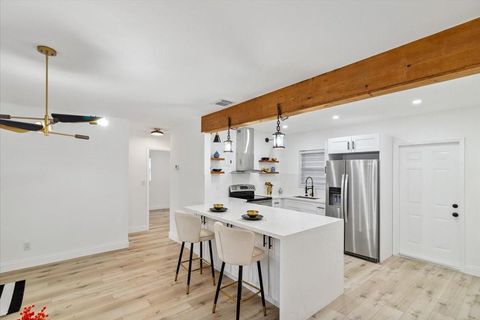
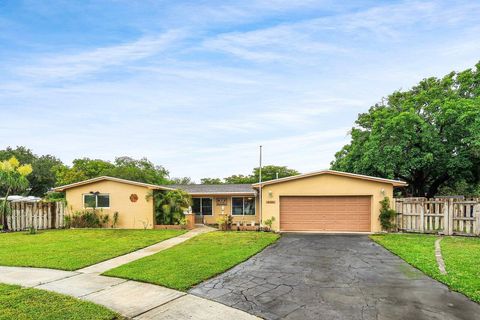
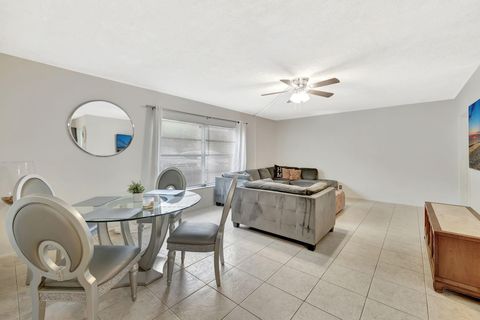
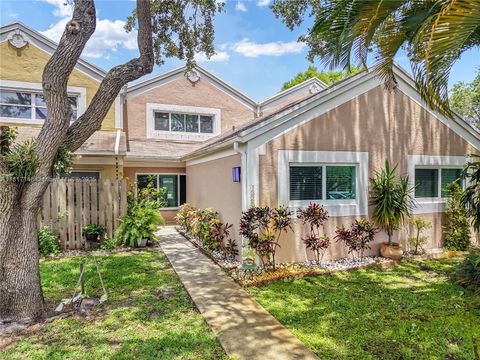
Best cash flowing properties in Broward County

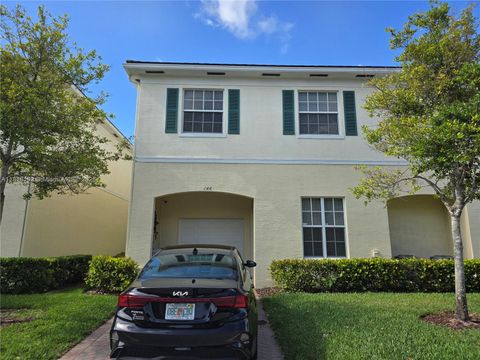
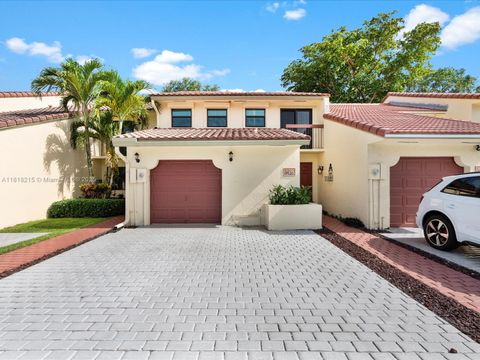
Active
$205,000
2
bds
|
2
ba
|
1,102
sqft
|
built
1973
7503 Kimberly Blvd, North Lauderdale, FL 33068
$-93
Cash flow
-2.4%
Cash-on-Cash Return
5.6%
Cap rate
1.0%
Rent to Value Ratio

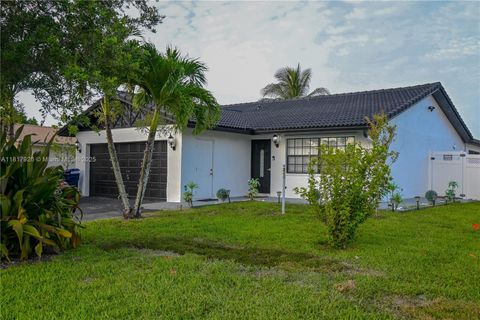
Active
$138,000
1
bds
|
2
ba
|
800
sqft
|
built
1973
3740 Inverrary Dr, Lauderhill, FL 33319
$-263
Cash flow
-9.9%
Cash-on-Cash Return
3.9%
Cap rate
1.2%
Rent to Value Ratio
8,979 out of 10,461 properties for sale in Broward County
Limited Results Shown
Create a free account, or log in to reveal all property listings and enjoy the complete experience.
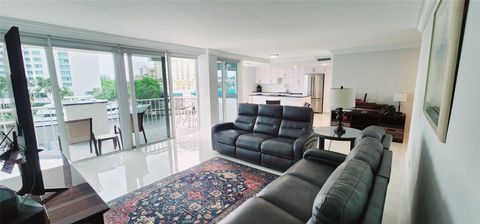
Active
$180,000
2
bds
|
2
ba
|
1,025
sqft
|
built
1976
8350 Sands Point Blvd, Tamarac, FL 33321
$-570
Cash flow
-16.5%
Cash-on-Cash Return
2.3%
Cap rate
1.1%
Rent to Value Ratio
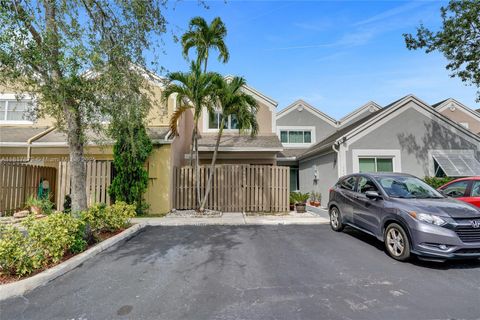
Active
$299,900
2
bds
|
3
ba
|
1,190
sqft
|
built
1988
10803 Cypress Glen Dr, Coral Springs, FL 33071
$-1,198
Cash flow
-20.8%
Cash-on-Cash Return
1.4%
Cap rate
0.8%
Rent to Value Ratio
Active
$210,000
2
bds
|
1
ba
|
903
sqft
|
built
1986
1235 SW 46th Ave, Pompano Beach, FL 33069
$-468
Cash flow
-11.6%
Cash-on-Cash Return
3.5%
Cap rate
1.0%
Rent to Value Ratio

Active
$585,000
3
bds
|
3
ba
|
1,793
sqft
|
built
1956
1433 NE 5th Ave, Fort Lauderdale, FL 33304
$-572
Cash flow
-5.1%
Cash-on-Cash Return
5.0%
Cap rate
0.8%
Rent to Value Ratio

Active
$128,000
1
bds
|
2
ba
|
783
sqft
|
built
1974
4160 Inverrary Dr, Lauderhill, FL 33319
$-405
Cash flow
-16.5%
Cash-on-Cash Return
2.4%
Cap rate
1.2%
Rent to Value Ratio
Active
$3,900,000
5
bds
|
6
ba
|
4,703
sqft
|
built
2001
10392 Harrier St, Plantation, FL 33324
$-17,675
Cash flow
-23.6%
Cash-on-Cash Return
0.7%
Cap rate
0.3%
Rent to Value Ratio

Active
$459,000
3
bds
|
2
ba
|
1,278
sqft
|
built
1962
5291 Flagler St, Hollywood, FL 33021
$-954
Cash flow
-10.8%
Cash-on-Cash Return
3.7%
Cap rate
0.6%
Rent to Value Ratio

Active
$198,500
2
bds
|
2
ba
|
970
sqft
|
built
1978
9460 Poinciana Pl, Davie, FL 33324
$-502
Cash flow
-13.2%
Cash-on-Cash Return
3.1%
Cap rate
1.0%
Rent to Value Ratio

Active
$320,000
2
bds
|
2
ba
|
1,176
sqft
|
built
1969
1825 S Ocean Dr, Hallandale Beach, FL 33009
$-1,351
Cash flow
-22.0%
Cash-on-Cash Return
1.1%
Cap rate
0.8%
Rent to Value Ratio

Active
$895,000
5
bds
|
3
ba
|
3,417
sqft
|
built
1999
17947 SW 36th St, Miramar, FL 33029
$-2,044
Cash flow
-11.9%
Cash-on-Cash Return
3.4%
Cap rate
0.6%
Rent to Value Ratio
Active
$519,000
3
bds
|
3
ba
|
2,036
sqft
|
built
2014
146 SW 7th Ct, Pompano Beach, FL 33060
$-1,383
Cash flow
-13.9%
Cash-on-Cash Return
3.0%
Cap rate
0.6%
Rent to Value Ratio
Active
$624,000
3
bds
|
2
ba
|
1,405
sqft
|
built
1979
2449 NW 123rd Ave, Coral Springs, FL 33065
$-1,020
Cash flow
-8.5%
Cash-on-Cash Return
4.2%
Cap rate
0.7%
Rent to Value Ratio
Active
$648,900
2
bds
|
2
ba
|
1,575
sqft
|
built
1970
2800 E Sunrise Blvd, Fort Lauderdale, FL 33304
$-2,415
Cash flow
-19.4%
Cash-on-Cash Return
1.7%
Cap rate
0.7%
Rent to Value Ratio
Active
$426,000
2
bds
|
3
ba
|
1,348
sqft
|
built
1987
1449 NW 122nd Ter, Pembroke Pines, FL 33026
$-1,004
Cash flow
-12.3%
Cash-on-Cash Return
3.3%
Cap rate
0.7%
Rent to Value Ratio

Active
$685,000
3
bds
|
3
ba
|
1,986
sqft
|
built
2001
13148 SW 23rd St, Miramar, FL 33027
$-1,596
Cash flow
-12.2%
Cash-on-Cash Return
3.4%
Cap rate
0.5%
Rent to Value Ratio
Active
$540,000
3
bds
|
3
ba
|
1,866
sqft
|
built
1981
9530 Alcazar Ln, Davie, FL 33324
$-872
Cash flow
-8.4%
Cash-on-Cash Return
4.2%
Cap rate
0.6%
Rent to Value Ratio
Active
$399,000
1
bds
|
2
ba
|
905
sqft
|
built
1969
4001 S Ocean Dr, Hollywood, FL 33019
$-1,535
Cash flow
-20.1%
Cash-on-Cash Return
1.5%
Cap rate
0.9%
Rent to Value Ratio
Active
$499,900
3
bds
|
2
ba
|
1,218
sqft
|
built
1961
3731 SW 58th Ter, Davie, FL 33314
$-768
Cash flow
-8.0%
Cash-on-Cash Return
4.3%
Cap rate
0.7%
Rent to Value Ratio

Active
$1,350,000
5
bds
|
3
ba
|
3,324
sqft
|
built
1986
8250 NW 49th Mnr, Coral Springs, FL 33067
$-2,335
Cash flow
-9.0%
Cash-on-Cash Return
4.1%
Cap rate
0.6%
Rent to Value Ratio
Active
$485,000
3
bds
|
2
ba
|
1,036
sqft
|
built
1950
6044 SW 37th St, Miramar, FL 33023
$-1,443
Cash flow
-15.5%
Cash-on-Cash Return
2.6%
Cap rate
0.5%
Rent to Value Ratio

Active
$260,000
2
bds
|
2
ba
|
1,332
sqft
|
built
1970
1811 Jefferson St, Hollywood, FL 33020
$-1,177
Cash flow
-23.6%
Cash-on-Cash Return
0.7%
Cap rate
1.0%
Rent to Value Ratio
Active
$450,000
3
bds
|
2
ba
|
984
sqft
|
built
1953
1032 NW 11th Pl, Fort Lauderdale, FL 33311
$-717
Cash flow
-8.3%
Cash-on-Cash Return
4.2%
Cap rate
0.7%
Rent to Value Ratio
Active
$660,000
3
bds
|
2
ba
|
1,907
sqft
|
built
1969
8330 NW 23rd St, Pembroke Pines, FL 33024
$-1,285
Cash flow
-10.2%
Cash-on-Cash Return
3.8%
Cap rate
0.5%
Rent to Value Ratio

Active
$415,000
3
bds
|
2
ba
|
1,754
sqft
|
built
1971
4841 NW 19th St, Lauderhill, FL 33313
$-763
Cash flow
-9.6%
Cash-on-Cash Return
3.9%
Cap rate
0.7%
Rent to Value Ratio
Active
$235,000
2
bds
|
2
ba
|
1,000
sqft
|
built
1968
600 Pine Dr, Pompano Beach, FL 33060
$-311
Cash flow
-6.9%
Cash-on-Cash Return
4.6%
Cap rate
1.0%
Rent to Value Ratio

Active
$379,000
4
bds
|
2
ba
|
1,326
sqft
|
built
1952
1212 NW 11th Ct, Fort Lauderdale, FL 33311
$-879
Cash flow
-12.1%
Cash-on-Cash Return
3.4%
Cap rate
0.6%
Rent to Value Ratio
Active
$499,000
3
bds
|
3
ba
|
1,802
sqft
|
built
1986
1325 NW 123rd Ter, Pembroke Pines, FL 33026
$-846
Cash flow
-8.8%
Cash-on-Cash Return
4.1%
Cap rate
0.7%
Rent to Value Ratio

Active
$605,000
3
bds
|
3
ba
|
1,262
sqft
|
built
2020
2000 Metropica Way, Sunrise, FL 33323
$-2,481
Cash flow
-21.4%
Cash-on-Cash Return
1.2%
Cap rate
0.7%
Rent to Value Ratio

Active
$1,749,000
4
bds
|
4
ba
|
2,160
sqft
|
built
1955
1948 Coco Palm Pl, Pompano Beach, FL 33062
$-3,671
Cash flow
-11.0%
Cash-on-Cash Return
3.6%
Cap rate
0.5%
Rent to Value Ratio

Active
$799,000
3
bds
|
2
ba
|
1,413
sqft
|
built
1957
5230 NE 20th Ave, Fort Lauderdale, FL 33308
$-1,364
Cash flow
-8.9%
Cash-on-Cash Return
4.1%
Cap rate
0.7%
Rent to Value Ratio
Active
$875,000
3
bds
|
2
ba
|
1,681
sqft
|
built
1961
5930 NE 21st Dr, Fort Lauderdale, FL 33308
$-2,477
Cash flow
-14.8%
Cash-on-Cash Return
2.7%
Cap rate
0.5%
Rent to Value Ratio
Active
$430,000
4
bds
|
2
ba
|
1,230
sqft
|
built
2011
2235 NW 25th Pl, Oakland Park, FL 33311
$-591
Cash flow
-7.2%
Cash-on-Cash Return
4.5%
Cap rate
0.7%
Rent to Value Ratio

Active
$399,000
1
bds
|
1
ba
|
570
sqft
|
built
1956
2701 Yacht Club Blvd, Fort Lauderdale, FL 33304
$-639
Cash flow
-8.4%
Cash-on-Cash Return
4.2%
Cap rate
0.8%
Rent to Value Ratio

Active
$3,150,000
5
bds
|
4
ba
|
3,673
sqft
|
built
1957
325 Bontona Ave, Fort Lauderdale, FL 33301
$-10,778
Cash flow
-17.9%
Cash-on-Cash Return
2.0%
Cap rate
0.3%
Rent to Value Ratio
Active
$889,000
5
bds
|
3
ba
|
3,469
sqft
|
built
2004
5382 SW 158th Ave, Miramar, FL 33027
$-2,624
Cash flow
-15.4%
Cash-on-Cash Return
2.6%
Cap rate
0.6%
Rent to Value Ratio
Active
$382,000
2
bds
|
3
ba
|
1,264
sqft
|
built
1985
4167 Forest Hill Dr, Hollywood, FL 33026
$-922
Cash flow
-12.6%
Cash-on-Cash Return
3.3%
Cap rate
0.7%
Rent to Value Ratio
Active
$315,000
2
bds
|
2
ba
|
867
sqft
|
built
1996
460 S Park Rd, Hollywood, FL 33021
$-819
Cash flow
-13.6%
Cash-on-Cash Return
3.0%
Cap rate
0.7%
Rent to Value Ratio

Active
$139,000
1
bds
|
1
ba
|
660
sqft
|
built
1967
180 NE 12th Ave, Hallandale Beach, FL 33009
$-543
Cash flow
-20.4%
Cash-on-Cash Return
1.5%
Cap rate
1.2%
Rent to Value Ratio