Broward County Investment Properties for Sale
Browse homes for sale and investment properties in Broward County. Refine your search by price, property type, or more.
Best cash flowing properties in Broward County

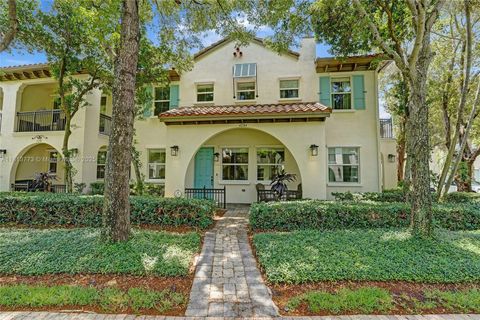
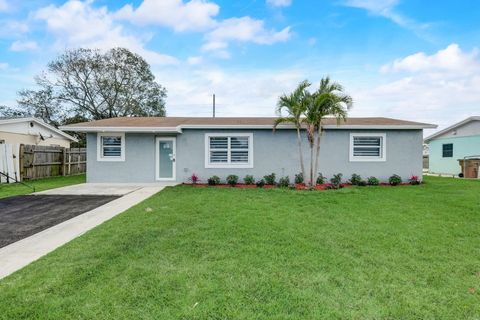
Active
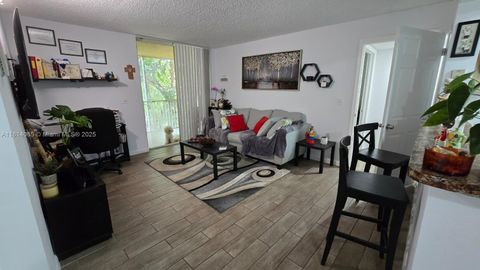
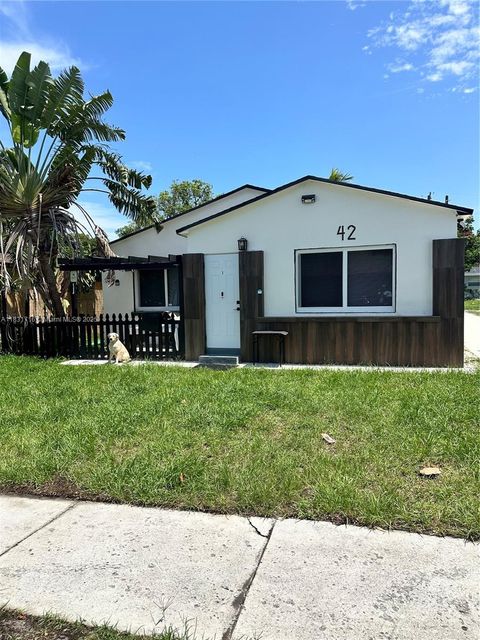
$152,000
1
bds
|
2
ba
|
700
sqft
|
built
1973
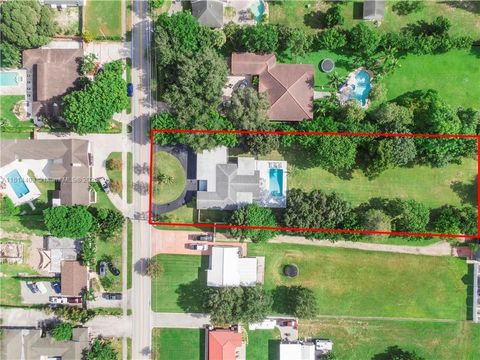
1040 SE 4th Ave, Deerfield Beach, FL 33441
$-106
Cash flow
-3.6%
Cash-on-Cash Return
5.3%
Cap rate
1.2%
Rent to Value Ratio

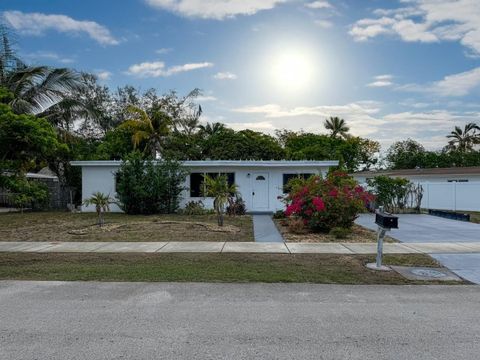
Active
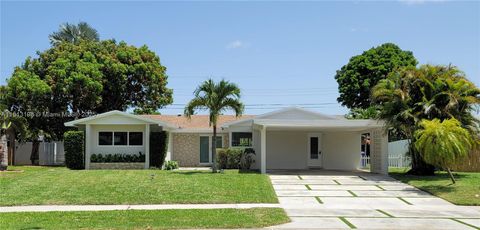
$220,000
1
bds
|
1
ba
|
683
sqft
|
built
1968
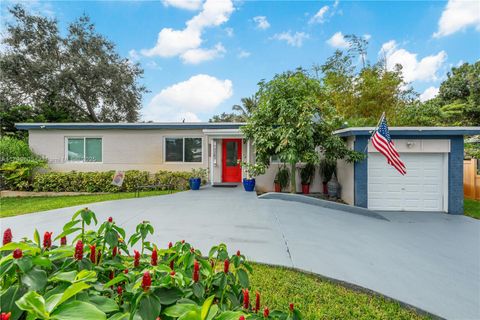
705 NE 2nd St, Hallandale Beach, FL 33009
$-295
Cash flow
-7.0%
Cash-on-Cash Return
4.5%
Cap rate
0.9%
Rent to Value Ratio
8,749 out of 10,198 properties for sale in Broward County
Limited Results Shown
Create a free account, or log in to reveal all property listings and enjoy the complete experience.

Active
$499,000
2
bds
|
2
ba
|
1,300
sqft
|
built
1963
818 SE 4th St, Fort Lauderdale, FL 33301
$-1,482
Cash flow
-15.5%
Cash-on-Cash Return
2.6%
Cap rate
0.8%
Rent to Value Ratio
Active
$169,000
2
bds
|
2
ba
|
1,057
sqft
|
built
1991
3995 W Mc Nab Rd, Pompano Beach, FL 33069
$-412
Cash flow
-12.7%
Cash-on-Cash Return
3.2%
Cap rate
1.2%
Rent to Value Ratio

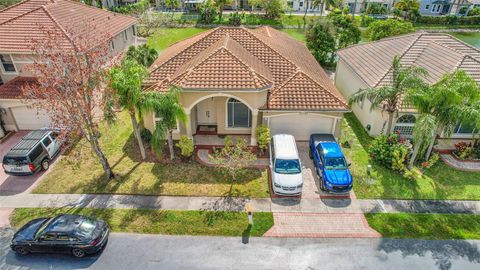
Active
$1,690,000
3
bds
|
3
ba
|
1,900
sqft
|
built
2015
151 Isle Of Venice Dr, Fort Lauderdale, FL 33301
$-7,012
Cash flow
-21.6%
Cash-on-Cash Return
1.2%
Cap rate
0.5%
Rent to Value Ratio

Active
$845,000
5
bds
|
3
ba
|
3,123
sqft
|
built
2002
5320 SW 130th Ter, Miramar, FL 33027
$-2,430
Cash flow
-15.0%
Cash-on-Cash Return
2.7%
Cap rate
0.5%
Rent to Value Ratio
Active
$634,800
4
bds
|
2
ba
|
2,048
sqft
|
built
2001
12340 NW 26th St, Coral Springs, FL 33065
$-1,626
Cash flow
-13.4%
Cash-on-Cash Return
3.1%
Cap rate
0.6%
Rent to Value Ratio

Active
$530,000
3
bds
|
3
ba
|
2,034
sqft
|
built
2003
16316 SW 48th St, Miramar, FL 33027
$-1,399
Cash flow
-13.8%
Cash-on-Cash Return
3.0%
Cap rate
0.5%
Rent to Value Ratio

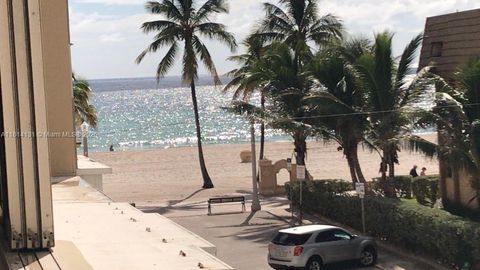
Active
$259,000
1
bds
|
1
ba
|
749
sqft
|
built
1968
1893 S Ocean Dr, Hallandale Beach, FL 33009
$-675
Cash flow
-13.6%
Cash-on-Cash Return
3.0%
Cap rate
0.9%
Rent to Value Ratio
Active
$345,000
2
bds
|
2
ba
|
1,200
sqft
|
built
1987
1672 Cypress Pointe Dr, Coral Springs, FL 33071
$-1,130
Cash flow
-17.1%
Cash-on-Cash Return
2.2%
Cap rate
0.8%
Rent to Value Ratio
Active
$495,000
4
bds
|
3
ba
|
1,848
sqft
|
built
2002
3860 NW 90th Way, Sunrise, FL 33351
$-1,338
Cash flow
-14.1%
Cash-on-Cash Return
2.9%
Cap rate
0.6%
Rent to Value Ratio
Active
$229,900
3
bds
|
2
ba
|
1,350
sqft
|
built
1972
2601 S Palm Aire Dr, Pompano Beach, FL 33069
$-1,099
Cash flow
-24.9%
Cash-on-Cash Return
0.4%
Cap rate
1.0%
Rent to Value Ratio

Active
$125,000
2
bds
|
2
ba
|
940
sqft
|
built
1980
6075 N Sabal Palm Blvd, Tamarac, FL 33319
$-483
Cash flow
-20.2%
Cash-on-Cash Return
1.5%
Cap rate
1.4%
Rent to Value Ratio
Active
$895,000
4
bds
|
3
ba
|
2,219
sqft
|
built
1983
875 NW 108th Ln, Coral Springs, FL 33071
$-2,476
Cash flow
-14.4%
Cash-on-Cash Return
2.8%
Cap rate
0.4%
Rent to Value Ratio

Active
$295,000
2
bds
|
3
ba
|
1,120
sqft
|
built
2014
3578 NW 13th St, Lauderhill, FL 33311
$-624
Cash flow
-11.0%
Cash-on-Cash Return
3.6%
Cap rate
0.8%
Rent to Value Ratio

Active
$195,000
1
bds
|
1
ba
|
685
sqft
|
built
1967
2426 SE 17th St, Fort Lauderdale, FL 33316
$-576
Cash flow
-15.4%
Cash-on-Cash Return
2.6%
Cap rate
1.1%
Rent to Value Ratio
Active
$409,000
3
bds
|
3
ba
|
2,170
sqft
|
built
1977
958 Mockingbird Ln, Plantation, FL 33324
$-1,257
Cash flow
-16.0%
Cash-on-Cash Return
2.5%
Cap rate
0.8%
Rent to Value Ratio
Active
$1,600,000
5
bds
|
4
ba
|
3,911
sqft
|
built
1978
3030 SW 117th Ave, Davie, FL 33330
$-3,135
Cash flow
-10.2%
Cash-on-Cash Return
3.8%
Cap rate
0.5%
Rent to Value Ratio

Active
$649,900
4
bds
|
3
ba
|
2,213
sqft
|
built
1993
495 SW 183rd Way, Pembroke Pines, FL 33029
$-1,695
Cash flow
-13.6%
Cash-on-Cash Return
3.0%
Cap rate
0.6%
Rent to Value Ratio
Active
$560,000
3
bds
|
3
ba
|
1,770
sqft
|
built
2011
4284 Cascada Cir, Hollywood, FL 33024
$-1,410
Cash flow
-13.1%
Cash-on-Cash Return
3.1%
Cap rate
0.7%
Rent to Value Ratio
Active
$419,900
3
bds
|
3
ba
|
1,245
sqft
|
built
1956
4341 NE 18th Ave, Pompano Beach, FL 33064
$-662
Cash flow
-8.2%
Cash-on-Cash Return
4.3%
Cap rate
0.7%
Rent to Value Ratio

Active
$220,000
2
bds
|
2
ba
|
970
sqft
|
built
1974
3711 NW 95th Ter, Sunrise, FL 33351
$-541
Cash flow
-12.8%
Cash-on-Cash Return
3.2%
Cap rate
0.9%
Rent to Value Ratio

Active
$630,000
bds
|
0
ba
|
1,642
sqft
|
built
1957
1309 NE 3rd Ave, Fort Lauderdale, FL 33304
$-1,945
Cash flow
-16.1%
Cash-on-Cash Return
2.4%
Cap rate
0.4%
Rent to Value Ratio
Active
$464,999
1
bds
|
1
ba
|
750
sqft
|
built
1968
320 S Surf Rd, Hollywood, FL 33019
$-1,922
Cash flow
-21.6%
Cash-on-Cash Return
1.2%
Cap rate
0.5%
Rent to Value Ratio
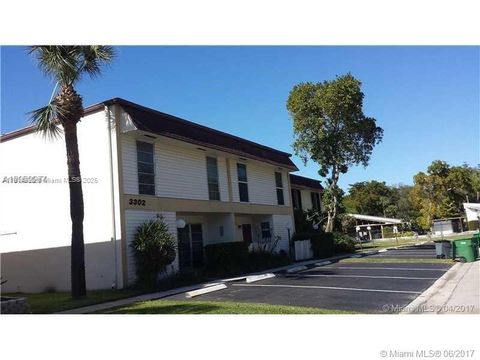
Active
$497,000
4
bds
|
3
ba
|
1,889
sqft
|
built
1975
3302 Farragut St, Hollywood, FL 33021
$-1,847
Cash flow
-19.4%
Cash-on-Cash Return
1.7%
Cap rate
0.6%
Rent to Value Ratio
Active
$1,399,999
5
bds
|
3
ba
|
0
sqft
|
built
1952
224 E Acre Dr, Plantation, FL 33317
$-2,567
Cash flow
-9.6%
Cash-on-Cash Return
3.9%
Cap rate
0.7%
Rent to Value Ratio

Active
$450,000
4
bds
|
2
ba
|
1,383
sqft
|
built
1984
312 NW 18th Ct, Pompano Beach, FL 33060
$-526
Cash flow
-6.1%
Cash-on-Cash Return
4.7%
Cap rate
0.7%
Rent to Value Ratio
Active
$695,000
3
bds
|
2
ba
|
1,222
sqft
|
built
1956
5189 SW 28th Ave, Fort Lauderdale, FL 33312
$-703
Cash flow
-5.3%
Cash-on-Cash Return
4.9%
Cap rate
0.6%
Rent to Value Ratio
Active
$665,000
3
bds
|
2
ba
|
1,902
sqft
|
built
1986
8706 NW 83rd St, Tamarac, FL 33321
$-1,539
Cash flow
-12.1%
Cash-on-Cash Return
3.4%
Cap rate
0.5%
Rent to Value Ratio
Active
$849,000
3
bds
|
2
ba
|
1,406
sqft
|
built
1951
1319 Buchanan St, Hollywood, FL 33019
$-1,928
Cash flow
-11.8%
Cash-on-Cash Return
3.4%
Cap rate
0.5%
Rent to Value Ratio
Active
$896,000
6
bds
|
4
ba
|
2,702
sqft
|
built
1958
42 SE 10th Ter, Dania Beach, FL 33004
$-4,226
Cash flow
-24.6%
Cash-on-Cash Return
0.5%
Cap rate
0.2%
Rent to Value Ratio
Active
$299,900
1
bds
|
2
ba
|
900
sqft
|
built
1972
1350 River Reach Dr, Fort Lauderdale, FL 33315
$-1,195
Cash flow
-20.8%
Cash-on-Cash Return
1.4%
Cap rate
0.7%
Rent to Value Ratio
Active
$560,000
2
bds
|
2
ba
|
1,120
sqft
|
built
1967
3111 N Ocean Dr, Hollywood, FL 33019
$-2,243
Cash flow
-20.9%
Cash-on-Cash Return
1.3%
Cap rate
0.7%
Rent to Value Ratio

Active
$384,900
3
bds
|
3
ba
|
1,462
sqft
|
built
1995
370 SE 2nd Ave, Deerfield Beach, FL 33441
$-1,022
Cash flow
-13.9%
Cash-on-Cash Return
3.0%
Cap rate
0.7%
Rent to Value Ratio

Active
$575,000
2
bds
|
2
ba
|
1,585
sqft
|
built
1959
333 Sunset Dr, Fort Lauderdale, FL 33301
$-2,619
Cash flow
-23.8%
Cash-on-Cash Return
0.7%
Cap rate
0.7%
Rent to Value Ratio
Active
$795,000
4
bds
|
3
ba
|
2,110
sqft
|
built
1963
6640 SW 7th St, Pembroke Pines, FL 33023
$-2,689
Cash flow
-17.6%
Cash-on-Cash Return
2.1%
Cap rate
0.4%
Rent to Value Ratio
Active
$489,000
3
bds
|
2
ba
|
1,484
sqft
|
built
1973
520 SW 13th Pl, Deerfield Beach, FL 33441
$-869
Cash flow
-9.3%
Cash-on-Cash Return
4.0%
Cap rate
0.7%
Rent to Value Ratio
Active
$535,000
2
bds
|
1
ba
|
1,137
sqft
|
built
1940
1636 Arthur St, Hollywood, FL 33020
$-1,115
Cash flow
-10.9%
Cash-on-Cash Return
3.6%
Cap rate
0.7%
Rent to Value Ratio
Active
$685,000
4
bds
|
2
ba
|
2,131
sqft
|
built
1986
3985 NW 73rd Way, Coral Springs, FL 33065
$-694
Cash flow
-5.3%
Cash-on-Cash Return
4.9%
Cap rate
0.7%
Rent to Value Ratio
Active
$850,000
3
bds
|
3
ba
|
1,740
sqft
|
built
1972
1985 S Ocean Dr, Hallandale Beach, FL 33009
$-2,921
Cash flow
-17.9%
Cash-on-Cash Return
2.0%
Cap rate
0.7%
Rent to Value Ratio