Broward County Investment Properties for Sale
Browse homes for sale and investment properties in Broward County. Refine your search by price, property type, or more.
Best cash flowing properties in Broward County
Active
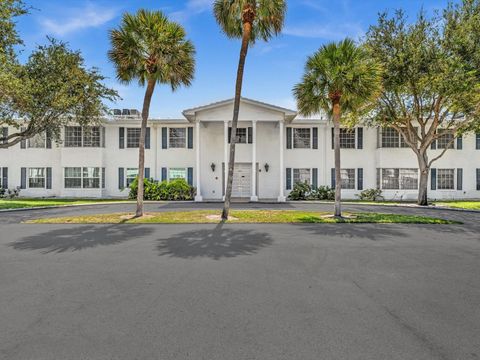
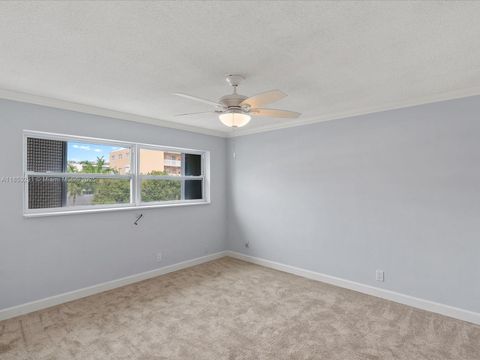
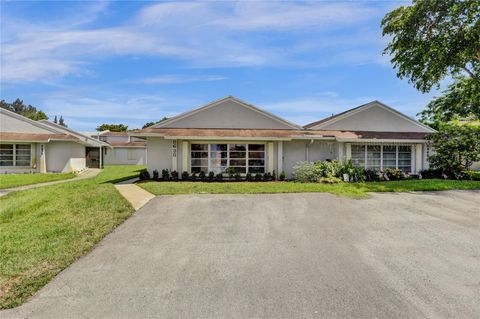
$155,000
2
bds
|
2
ba
|
1,030
sqft
|
built
1972
6600 NE 22nd Way, Fort Lauderdale, FL 33308
$-239
Cash flow
-8.0%
Cash-on-Cash Return
4.3%
Cap rate
1.3%
Rent to Value Ratio
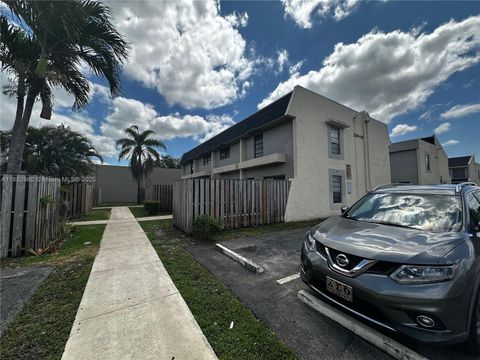
Active
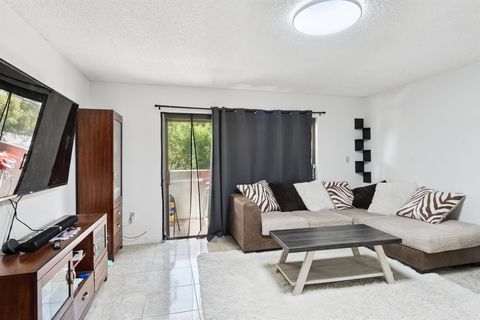
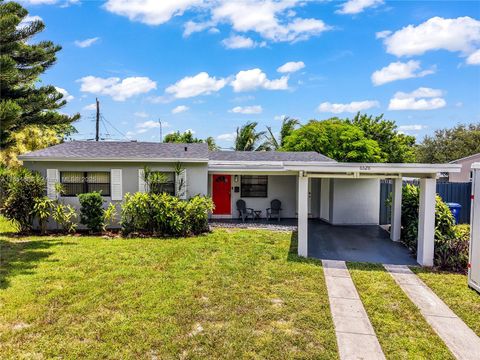
$184,999
1
bds
|
1
ba
|
717
sqft
|
built
1984
1891 N 61st Ave, Hollywood, FL 33024
$-243
Cash flow
-6.9%
Cash-on-Cash Return
4.6%
Cap rate
1.1%
Rent to Value Ratio
8,187 out of 9,558 properties for sale in Broward County
Limited Results Shown
Create a free account, or log in to reveal all property listings and enjoy the complete experience.
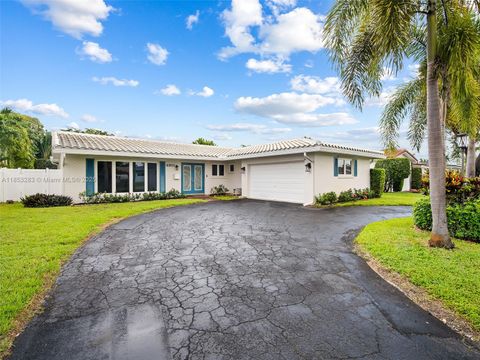
Active
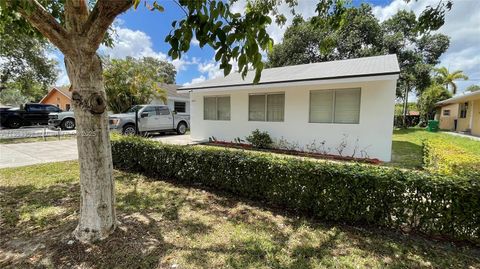
$415,000
2
bds
|
2
ba
|
1,050
sqft
|
built
1970
1435 SE 15th St, Fort Lauderdale, FL 33316
$-1,467
Cash flow
-18.4%
Cash-on-Cash Return
1.9%
Cap rate
0.6%
Rent to Value Ratio
Active
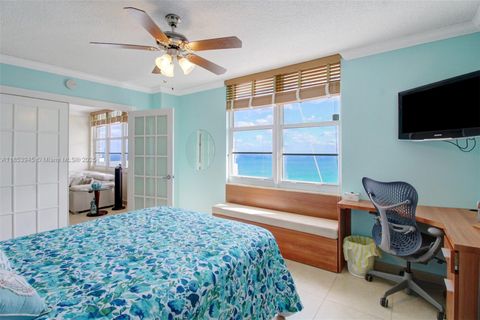
$919,000
3
bds
|
2
ba
|
1,998
sqft
|
built
1968
5100 Arthur St, Hollywood, FL 33021
$-2,069
Cash flow
-11.7%
Cash-on-Cash Return
3.4%
Cap rate
0.6%
Rent to Value Ratio
Active
$599,000
2
bds
|
2
ba
|
1,590
sqft
|
built
2020
4256 Marina Way, Deerfield Beach, FL 33064
$-1,526
Cash flow
-13.3%
Cash-on-Cash Return
3.1%
Cap rate
0.7%
Rent to Value Ratio

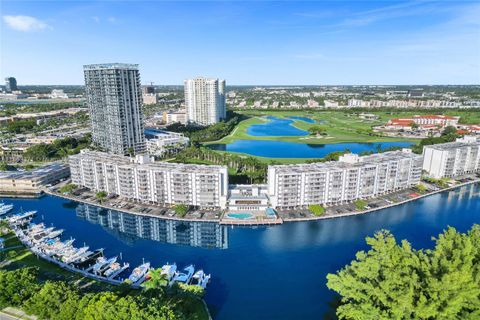
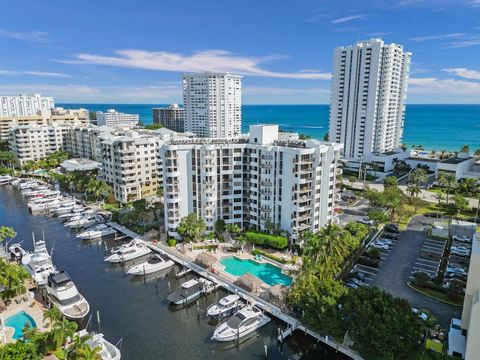
Active
$214,900
1
bds
|
2
ba
|
828
sqft
|
built
1974
500 Three Islands Blvd, Hallandale Beach, FL 33009
$-953
Cash flow
-23.1%
Cash-on-Cash Return
0.8%
Cap rate
0.9%
Rent to Value Ratio
Active
$504,000
3
bds
|
3
ba
|
1,365
sqft
|
built
1971
7200 NW 68th St, Tamarac, FL 33321
$-621
Cash flow
-6.4%
Cash-on-Cash Return
4.7%
Cap rate
0.7%
Rent to Value Ratio

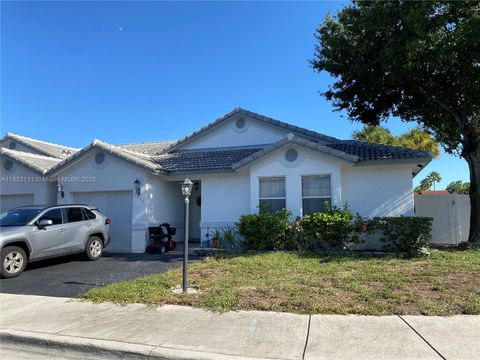
Active
$250,000
2
bds
|
2
ba
|
1,400
sqft
|
built
2000
7763 Southampton Ter, Tamarac, FL 33321
$-589
Cash flow
-12.3%
Cash-on-Cash Return
3.3%
Cap rate
0.9%
Rent to Value Ratio
Active
$150,000
2
bds
|
2
ba
|
0
sqft
|
built
1981
3141 NW 47th Ter, Lauderdale Lakes, FL 33319
$-477
Cash flow
-16.6%
Cash-on-Cash Return
2.3%
Cap rate
1.3%
Rent to Value Ratio
Active
$355,000
2
bds
|
1
ba
|
810
sqft
|
built
1983
708 NW 6th St, Hallandale Beach, FL 33009
$-665
Cash flow
-9.8%
Cash-on-Cash Return
3.9%
Cap rate
0.6%
Rent to Value Ratio
Active
$365,000
2
bds
|
2
ba
|
1,430
sqft
|
built
1976
800 Parkview Dr, Hallandale Beach, FL 33009
$-1,071
Cash flow
-15.3%
Cash-on-Cash Return
2.6%
Cap rate
0.9%
Rent to Value Ratio
Active
$209,000
0
bds
|
1
ba
|
262
sqft
|
built
1956
322 Harding St, Hollywood, FL 33019
$-632
Cash flow
-15.8%
Cash-on-Cash Return
2.5%
Cap rate
1.1%
Rent to Value Ratio
Active
$449,000
2
bds
|
2
ba
|
1,242
sqft
|
built
1970
1401 S Ocean Dr, Hollywood, FL 33019
$-604
Cash flow
-7.0%
Cash-on-Cash Return
4.5%
Cap rate
0.8%
Rent to Value Ratio
Active
$185,000
2
bds
|
2
ba
|
768
sqft
|
built
1982
1006 Twin Lakes Dr, Coral Springs, FL 33071
$-504
Cash flow
-14.2%
Cash-on-Cash Return
2.9%
Cap rate
1.1%
Rent to Value Ratio
Active
$720,000
3
bds
|
2
ba
|
1,262
sqft
|
built
1993
18336 NW 6th St, Pembroke Pines, FL 33029
$-1,795
Cash flow
-13.0%
Cash-on-Cash Return
3.2%
Cap rate
0.5%
Rent to Value Ratio
Active
$385,000
3
bds
|
2
ba
|
1,471
sqft
|
built
1980
8382 NW 37th St, Sunrise, FL 33351
$-895
Cash flow
-12.1%
Cash-on-Cash Return
3.4%
Cap rate
0.7%
Rent to Value Ratio
Active
$650,000
3
bds
|
2
ba
|
1,882
sqft
|
built
1957
3900 SW 30th St, West Park, FL 33023
$-2,260
Cash flow
-18.1%
Cash-on-Cash Return
2.0%
Cap rate
0.3%
Rent to Value Ratio
Active
$427,900
2
bds
|
2
ba
|
1,500
sqft
|
built
1981
1201 River Reach Dr, Fort Lauderdale, FL 33315
$-1,730
Cash flow
-21.1%
Cash-on-Cash Return
1.3%
Cap rate
0.7%
Rent to Value Ratio
Active
$510,000
4
bds
|
2
ba
|
1,515
sqft
|
built
1999
4926 Pelican St, Coconut Creek, FL 33073
$-1,026
Cash flow
-10.5%
Cash-on-Cash Return
3.7%
Cap rate
0.7%
Rent to Value Ratio
Active
$790,000
3
bds
|
2
ba
|
1,423
sqft
|
built
1950
1708 NE 16th Ter, Fort Lauderdale, FL 33305
$-1,491
Cash flow
-9.8%
Cash-on-Cash Return
3.9%
Cap rate
0.6%
Rent to Value Ratio
Active
$875,000
3
bds
|
2
ba
|
1,814
sqft
|
built
1997
5355 SW 34th Way, Fort Lauderdale, FL 33312
$-2,905
Cash flow
-17.3%
Cash-on-Cash Return
2.2%
Cap rate
0.5%
Rent to Value Ratio
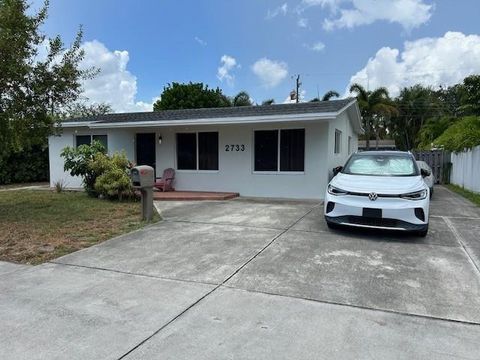
Active
$555,000
2
bds
|
1
ba
|
1,810
sqft
|
built
1959
2733 NE 6th Ave, Wilton Manors, FL 33334
$-1,297
Cash flow
-12.2%
Cash-on-Cash Return
3.3%
Cap rate
0.7%
Rent to Value Ratio
Active
$275,000
2
bds
|
2
ba
|
1,070
sqft
|
built
1966
200 NE 12th Ave, Hallandale Beach, FL 33009
$-912
Cash flow
-17.3%
Cash-on-Cash Return
2.2%
Cap rate
0.9%
Rent to Value Ratio
Active
$540,000
3
bds
|
2
ba
|
1,262
sqft
|
built
1956
6528 SW 26th St, Miramar, FL 33023
$-1,072
Cash flow
-10.4%
Cash-on-Cash Return
3.8%
Cap rate
0.6%
Rent to Value Ratio
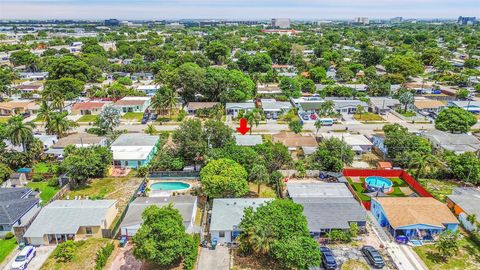
Active
$387,000
2
bds
|
1
ba
|
780
sqft
|
built
1952
6021 SW 38th St, Miramar, FL 33023
$-417
Cash flow
-5.6%
Cash-on-Cash Return
4.9%
Cap rate
0.6%
Rent to Value Ratio
Active
$619,999
2
bds
|
2
ba
|
1,095
sqft
|
built
1971
3725 S Ocean Dr, Hollywood, FL 33019
$-2,389
Cash flow
-20.1%
Cash-on-Cash Return
1.5%
Cap rate
0.6%
Rent to Value Ratio
Active
$2,300,000
3
bds
|
4
ba
|
2,162
sqft
|
built
2023
1116 N Ocean Blvd, Pompano Beach, FL 33062
$-11,397
Cash flow
-25.9%
Cash-on-Cash Return
0.2%
Cap rate
0.4%
Rent to Value Ratio
Active
$825,000
2
bds
|
2
ba
|
988
sqft
|
built
1952
713 NE 17th Ter, Fort Lauderdale, FL 33304
$-1,899
Cash flow
-12.0%
Cash-on-Cash Return
3.4%
Cap rate
0.5%
Rent to Value Ratio
Active
$509,000
3
bds
|
1
ba
|
1,012
sqft
|
built
1960
311 SW 68th Ter, Pembroke Pines, FL 33023
$-1,214
Cash flow
-12.4%
Cash-on-Cash Return
3.3%
Cap rate
0.6%
Rent to Value Ratio
Active
$599,000
3
bds
|
2
ba
|
1,538
sqft
|
built
1960
988 NW 10th St, Hallandale Beach, FL 33009
$-943
Cash flow
-8.2%
Cash-on-Cash Return
4.3%
Cap rate
0.7%
Rent to Value Ratio
Active
$257,000
1
bds
|
2
ba
|
850
sqft
|
built
1970
200 Diplomat Pkwy, Hallandale Beach, FL 33009
$-1,051
Cash flow
-21.3%
Cash-on-Cash Return
1.2%
Cap rate
0.8%
Rent to Value Ratio
Active
$499,000
3
bds
|
3
ba
|
1,281
sqft
|
built
1992
7872 NW 34th Pl, Hollywood, FL 33024
$-756
Cash flow
-7.9%
Cash-on-Cash Return
4.3%
Cap rate
0.6%
Rent to Value Ratio
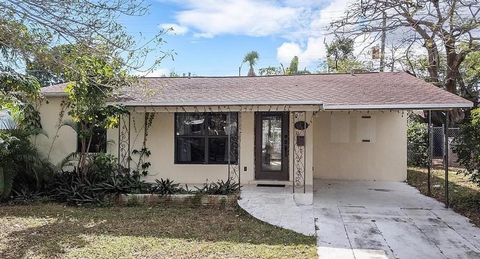
Active
$395,000
2
bds
|
1
ba
|
966
sqft
|
built
1956
230 NW 52nd Ct, Oakland Park, FL 33309
$-598
Cash flow
-7.9%
Cash-on-Cash Return
4.3%
Cap rate
0.7%
Rent to Value Ratio
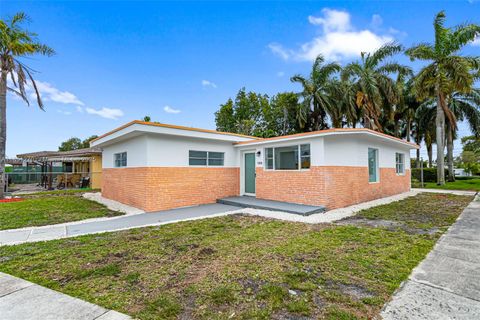
Active
$390,000
3
bds
|
2
ba
|
916
sqft
|
built
1957
100 NE 51st St, Oakland Park, FL 33334
$-446
Cash flow
-6.0%
Cash-on-Cash Return
4.8%
Cap rate
0.7%
Rent to Value Ratio
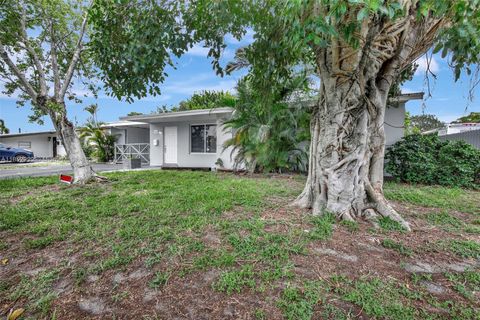
Active
$425,000
3
bds
|
2
ba
|
1,630
sqft
|
built
1981
8638 Bridle Path Ct, Davie, FL 33328
$-813
Cash flow
-10.0%
Cash-on-Cash Return
3.9%
Cap rate
0.8%
Rent to Value Ratio
Active
$715,000
2
bds
|
2
ba
|
1,200
sqft
|
built
1981
1361 S Ocean Blvd, Pompano Beach, FL 33062
$-2,968
Cash flow
-21.7%
Cash-on-Cash Return
1.2%
Cap rate
0.5%
Rent to Value Ratio
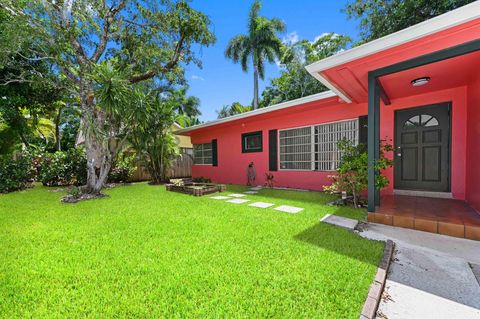
Active
$899,000
4
bds
|
3
ba
|
2,076
sqft
|
built
1967
4901 Hayes St, Hollywood, FL 33021
$-1,872
Cash flow
-10.9%
Cash-on-Cash Return
3.6%
Cap rate
0.5%
Rent to Value Ratio
Active
$190,000
2
bds
|
2
ba
|
1,020
sqft
|
built
1980
2300 NW 52nd Ave, Lauderhill, FL 33313
$-506
Cash flow
-13.9%
Cash-on-Cash Return
2.9%
Cap rate
1.0%
Rent to Value Ratio
Active
$2,500,000
4
bds
|
4
ba
|
4,006
sqft
|
built
1955
518 N Riverside Dr, Pompano Beach, FL 33062
$-10,649
Cash flow
-22.2%
Cash-on-Cash Return
1.0%
Cap rate
0.3%
Rent to Value Ratio
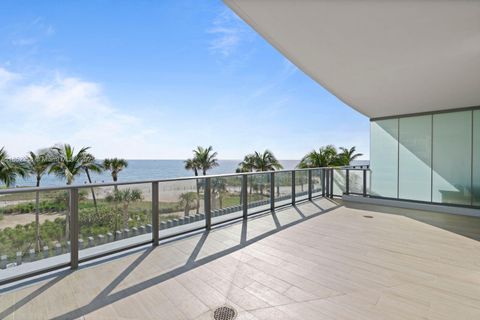
Active
$2,550,000
3
bds
|
3
ba
|
2,380
sqft
|
built
2007
101 S Fort Lauderdale Beach Blvd, Fort Lauderdale, FL 33316
$-12,188
Cash flow
-24.9%
Cash-on-Cash Return
0.4%
Cap rate
0.4%
Rent to Value Ratio