Broward County Investment Properties for Sale
Browse homes for sale and investment properties in Broward County. Refine your search by price, property type, or more.
Best cash flowing properties in Broward County
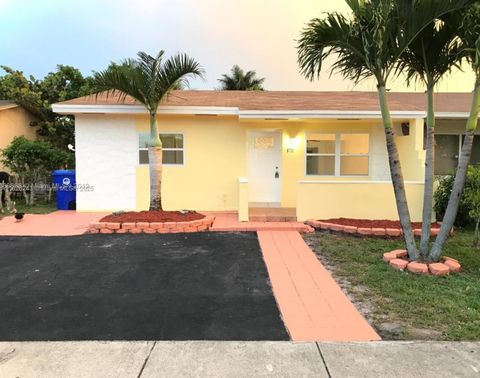
Active
$179,900
1
bds
|
1
ba
|
650
sqft
|
built
1970
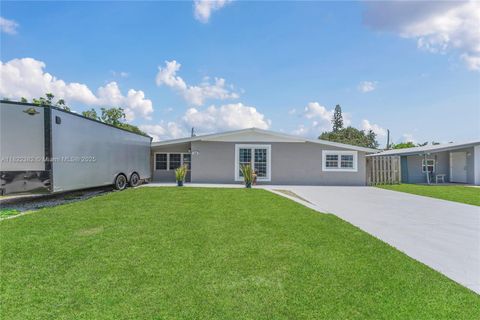
3201 NE 14th Street Cswy, Pompano Beach, FL 33062
$-195
Cash flow
-5.7%
Cash-on-Cash Return
4.8%
Cap rate
1.1%
Rent to Value Ratio
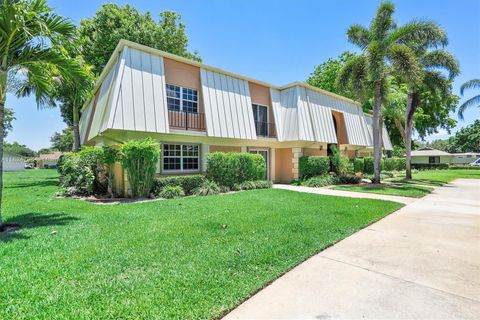
Active
$161,999
1
bds
|
2
ba
|
960
sqft
|
built
1973
7100 NW 17th St, Plantation, FL 33313
$-201
Cash flow
-6.5%
Cash-on-Cash Return
4.7%
Cap rate
1.1%
Rent to Value Ratio
8,674 out of 10,116 properties for sale in Broward County
Limited Results Shown
Create a free account, or log in to reveal all property listings and enjoy the complete experience.
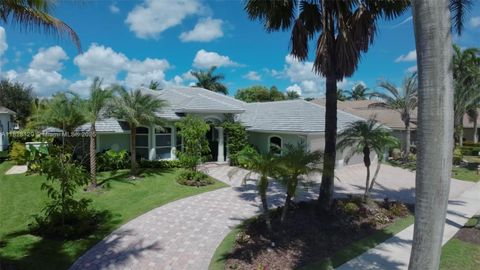
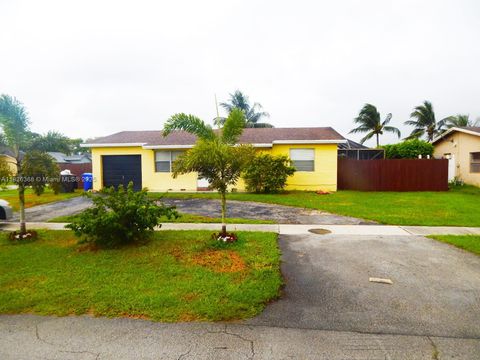
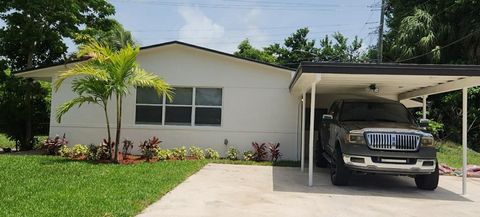
Active
$485,000
3
bds
|
2
ba
|
1,360
sqft
|
built
1967
6441 NW 26th St, Sunrise, FL 33313
$-868
Cash flow
-9.3%
Cash-on-Cash Return
4.0%
Cap rate
0.7%
Rent to Value Ratio
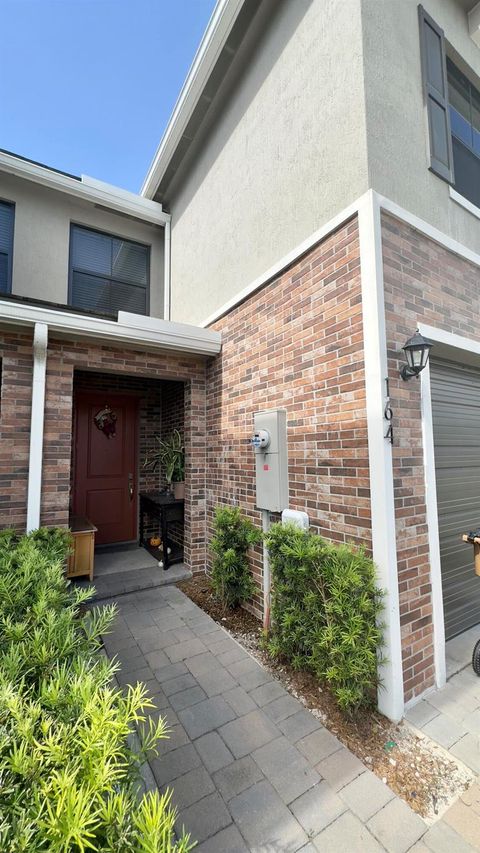
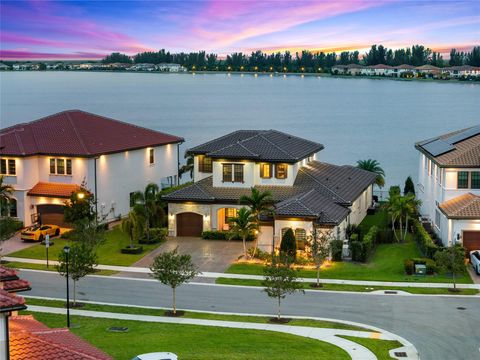
Active
$450,000
3
bds
|
3
ba
|
1,554
sqft
|
built
2022
164 SE 5th Ct, Deerfield Beach, FL 33441
$-1,104
Cash flow
-12.8%
Cash-on-Cash Return
3.2%
Cap rate
0.7%
Rent to Value Ratio
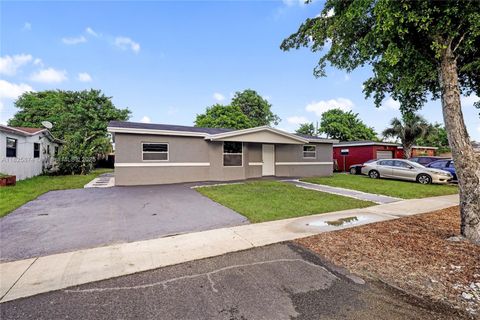
Active
$375,000
2
bds
|
1
ba
|
1,000
sqft
|
built
1972
6710 SW 18th Ct, North Lauderdale, FL 33068
$-775
Cash flow
-10.8%
Cash-on-Cash Return
3.7%
Cap rate
0.7%
Rent to Value Ratio
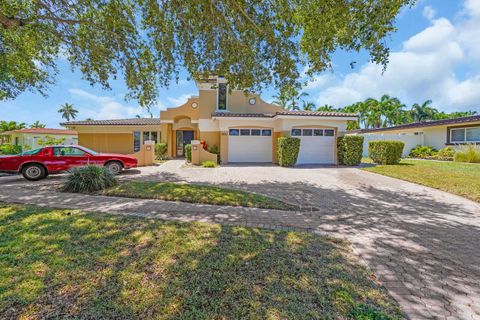
Active
$335,000
2
bds
|
2
ba
|
1,358
sqft
|
built
1973
3660 Citrus Trce, Davie, FL 33328
$-879
Cash flow
-13.7%
Cash-on-Cash Return
3.0%
Cap rate
0.7%
Rent to Value Ratio
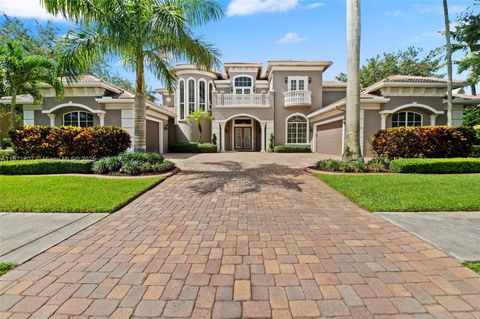
Active
$3,150,000
5
bds
|
5
ba
|
4,316
sqft
|
built
1996
2493 Poinciana Dr, Weston, FL 33327
$-11,827
Cash flow
-19.6%
Cash-on-Cash Return
1.6%
Cap rate
0.4%
Rent to Value Ratio
Active
$1,999,900
4
bds
|
4
ba
|
4,229
sqft
|
built
2020
9295 Parkland Bay Dr, Parkland, FL 33076
$-7,738
Cash flow
-20.2%
Cash-on-Cash Return
1.5%
Cap rate
0.3%
Rent to Value Ratio
Active
$524,999
3
bds
|
2
ba
|
1,301
sqft
|
built
1960
7540 Simms St, Hollywood, FL 33024
$-975
Cash flow
-9.7%
Cash-on-Cash Return
3.9%
Cap rate
0.6%
Rent to Value Ratio
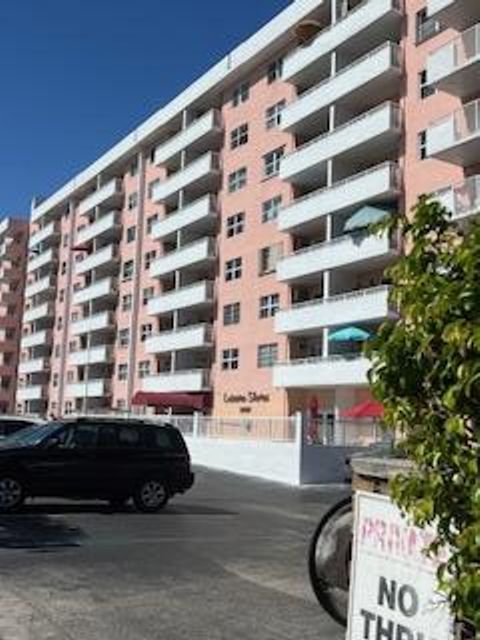
Active
$220,000
1
bds
|
1
ba
|
530
sqft
|
built
1962
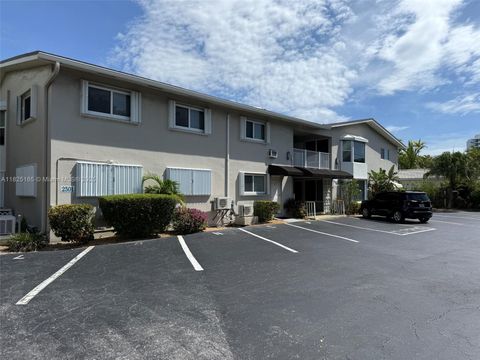
2501 N Ocean Blvd, Pompano Beach, FL 33062
$-624
Cash flow
-14.8%
Cash-on-Cash Return
2.7%
Cap rate
0.8%
Rent to Value Ratio
Active
$370,000
2
bds
|
2
ba
|
1,165
sqft
|
built
2009
2641 N Flamingo Rd, Sunrise, FL 33323
$-1,650
Cash flow
-23.3%
Cash-on-Cash Return
0.8%
Cap rate
0.8%
Rent to Value Ratio
Active
$599,000
3
bds
|
1
ba
|
1,160
sqft
|
built
1960
1408 SW 1st Ter, Deerfield Beach, FL 33441
$-1,388
Cash flow
-12.1%
Cash-on-Cash Return
3.4%
Cap rate
0.5%
Rent to Value Ratio
Active
$1,950,000
3
bds
|
3
ba
|
2,392
sqft
|
built
2002
1555 SE 7th St, Deerfield Beach, FL 33441
$-3,914
Cash flow
-10.5%
Cash-on-Cash Return
3.7%
Cap rate
0.5%
Rent to Value Ratio
Active
$1,499,999
5
bds
|
3
ba
|
3,971
sqft
|
built
1972
2691 SW 110th Way, Davie, FL 33328
$-2,413
Cash flow
-8.4%
Cash-on-Cash Return
4.2%
Cap rate
0.6%
Rent to Value Ratio
Active
$545,000
4
bds
|
2
ba
|
1,108
sqft
|
built
1959
2506 Havana Dr, Miramar, FL 33023
$-1,608
Cash flow
-15.4%
Cash-on-Cash Return
2.6%
Cap rate
0.5%
Rent to Value Ratio
Active
$339,500
1
bds
|
1
ba
|
864
sqft
|
built
1982
1201 S Ocean Dr, Hollywood, FL 33019
$-1,131
Cash flow
-17.4%
Cash-on-Cash Return
2.1%
Cap rate
0.7%
Rent to Value Ratio
Active
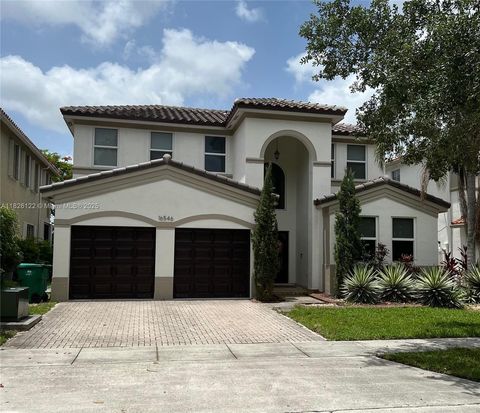
$845,000
4
bds
|
4
ba
|
3,410
sqft
|
built
1999
16546 SW 39th St, Miramar, FL 33027
$-1,961
Cash flow
-12.1%
Cash-on-Cash Return
3.4%
Cap rate
0.7%
Rent to Value Ratio
Active
$415,000
5
bds
|
2
ba
|
1,448
sqft
|
built
1970
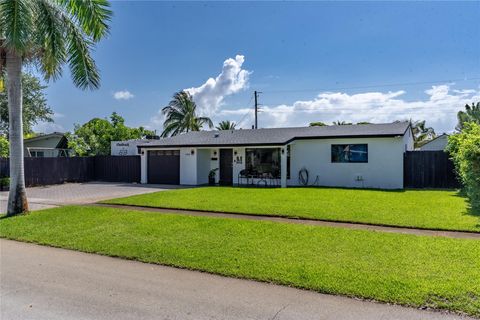
538 NW 18th Ave, Fort Lauderdale, FL 33311
$-669
Cash flow
-8.4%
Cash-on-Cash Return
4.2%
Cap rate
0.7%
Rent to Value Ratio
Active
$609,000
3
bds
|
2
ba
|
1,740
sqft
|
built
1955
919 NE 4th St, Hallandale Beach, FL 33009
$-1,421
Cash flow
-12.2%
Cash-on-Cash Return
3.3%
Cap rate
0.6%
Rent to Value Ratio
Active
$345,000
3
bds
|
2
ba
|
1,250
sqft
|
built
1986
3074 S Oakland Forest Dr, Oakland Park, FL 33309
$-915
Cash flow
-13.8%
Cash-on-Cash Return
3.0%
Cap rate
0.8%
Rent to Value Ratio
Active
$329,900
3
bds
|
2
ba
|
1,350
sqft
|
built
1978
9480 Poinciana Pl, Davie, FL 33324
$-933
Cash flow
-14.8%
Cash-on-Cash Return
2.8%
Cap rate
0.8%
Rent to Value Ratio
Active
$260,000
2
bds
|
2
ba
|
1,124
sqft
|
built
1998
2640 S University Dr, Davie, FL 33328
$-696
Cash flow
-14.0%
Cash-on-Cash Return
2.9%
Cap rate
0.9%
Rent to Value Ratio
Active
$462,000
2
bds
|
1
ba
|
1,040
sqft
|
built
1956
2180 SW 37th Ave, Fort Lauderdale, FL 33312
$-845
Cash flow
-9.5%
Cash-on-Cash Return
4.0%
Cap rate
0.6%
Rent to Value Ratio
Active
$239,000
2
bds
|
1
ba
|
749
sqft
|
built
1994
3660 N 56th Ave, Hollywood, FL 33021
$-529
Cash flow
-11.5%
Cash-on-Cash Return
3.5%
Cap rate
0.8%
Rent to Value Ratio
Active
$399,000
2
bds
|
4
ba
|
1,498
sqft
|
built
2003
11380 NW 34th Pl, Sunrise, FL 33323
$-893
Cash flow
-11.7%
Cash-on-Cash Return
3.5%
Cap rate
0.7%
Rent to Value Ratio
Active
$2,195,000
3
bds
|
2
ba
|
1,900
sqft
|
built
1967
4220 NE 24th Ave, Lighthouse Point, FL 33064
$-6,777
Cash flow
-16.1%
Cash-on-Cash Return
2.4%
Cap rate
0.4%
Rent to Value Ratio
Active
$2,890,000
3
bds
|
4
ba
|
2,003
sqft
|
built
2018
401 N Birch Rd, Fort Lauderdale, FL 33304
$-13,294
Cash flow
-24.0%
Cash-on-Cash Return
0.6%
Cap rate
0.3%
Rent to Value Ratio
Active
$739,000
3
bds
|
4
ba
|
2,005
sqft
|
built
2007
721 SE 12th Ct, Fort Lauderdale, FL 33316
$-1,625
Cash flow
-11.5%
Cash-on-Cash Return
3.5%
Cap rate
0.7%
Rent to Value Ratio
Active
$455,000
3
bds
|
2
ba
|
1,384
sqft
|
built
1977
7301 SW 8th St, North Lauderdale, FL 33068
$-465
Cash flow
-5.3%
Cash-on-Cash Return
4.9%
Cap rate
0.7%
Rent to Value Ratio
Active
$699,999
2
bds
|
2
ba
|
1,200
sqft
|
built
1972
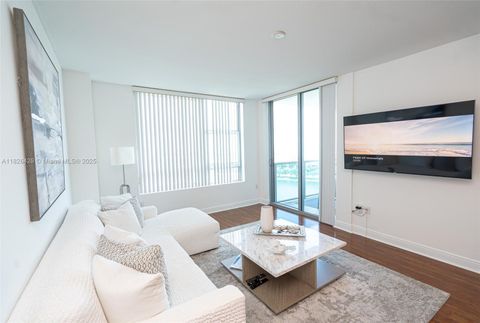
2701 N Ocean Blvd, Fort Lauderdale, FL 33308
$-1,757
Cash flow
-13.1%
Cash-on-Cash Return
3.1%
Cap rate
0.7%
Rent to Value Ratio
Active
$495,000
1
bds
|
1
ba
|
890
sqft
|
built
2005
2011 N Ocean Blvd, Fort Lauderdale, FL 33305
$-1,210
Cash flow
-12.8%
Cash-on-Cash Return
3.2%
Cap rate
0.9%
Rent to Value Ratio
Active
$269,900
2
bds
|
2
ba
|
1,300
sqft
|
built
1984
101 Liberty Ct, Deerfield Beach, FL 33442
$-706
Cash flow
-13.6%
Cash-on-Cash Return
3.0%
Cap rate
1.0%
Rent to Value Ratio
Active
$499,000
4
bds
|
2
ba
|
1,488
sqft
|
built
1960
2909 NW 13th St, Fort Lauderdale, FL 33311
$-1,380
Cash flow
-14.4%
Cash-on-Cash Return
2.8%
Cap rate
0.5%
Rent to Value Ratio
Active
$472,000
3
bds
|
2
ba
|
1,520
sqft
|
built
1967
4290 NW 38th Ave, Fort Lauderdale, FL 33309
$-1,037
Cash flow
-11.5%
Cash-on-Cash Return
3.5%
Cap rate
0.6%
Rent to Value Ratio
Active
$849,000
3
bds
|
2
ba
|
1,768
sqft
|
built
1957
2651 NE 49th St, Lighthouse Point, FL 33064
$-2,561
Cash flow
-15.7%
Cash-on-Cash Return
2.5%
Cap rate
0.5%
Rent to Value Ratio
Active
$2,725,000
6
bds
|
8
ba
|
6,424
sqft
|
built
2007
12608 S Stonebrook Cir, Davie, FL 33330
$-10,370
Cash flow
-19.9%
Cash-on-Cash Return
1.6%
Cap rate
0.4%
Rent to Value Ratio
Active
$617,000
3
bds
|
2
ba
|
1,502
sqft
|
built
1979
50 Forest Cir, Hollywood, FL 33026
$-1,629
Cash flow
-13.8%
Cash-on-Cash Return
3.0%
Cap rate
0.6%
Rent to Value Ratio
Active
$749,000
2
bds
|
2
ba
|
1,355
sqft
|
built
1969
3901 S Ocean Dr, Hollywood, FL 33019
$-2,531
Cash flow
-17.6%
Cash-on-Cash Return
2.1%
Cap rate
0.7%
Rent to Value Ratio
Active
$349,000
2
bds
|
2
ba
|
1,280
sqft
|
built
1980
2500 Parkview Dr, Hallandale Beach, FL 33009
$-404
Cash flow
-6.0%
Cash-on-Cash Return
4.8%
Cap rate
0.8%
Rent to Value Ratio
Active
$2,695,000
4
bds
|
5
ba
|
2,633
sqft
|
built
1956
2432 Bayview Dr, Fort Lauderdale, FL 33305
$-7,459
Cash flow
-14.4%
Cash-on-Cash Return
2.8%
Cap rate
0.4%
Rent to Value Ratio