Broward County Investment Properties for Sale
Browse homes for sale and investment properties in Broward County. Refine your search by price, property type, or more.
Best cash flowing properties in Broward County

Active
$145,000
1
bds
|
1
ba
|
750
sqft
|
built
1970
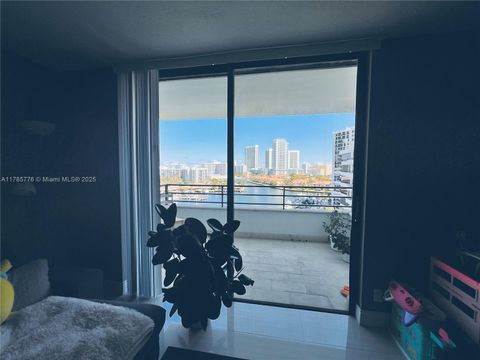
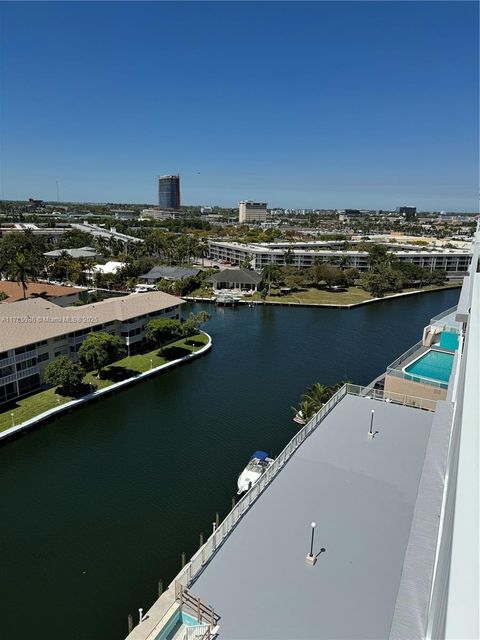
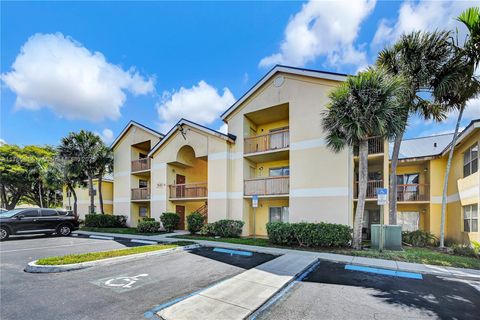
1950 N Andrews Ave, Wilton Manors, FL 33311
$159
Cash flow
5.7%
Cash-on-Cash Return
7.5%
Cap rate
1.1%
Rent to Value Ratio
Active
$132,000
1
bds
|
1
ba
|
595
sqft
|
built
1965
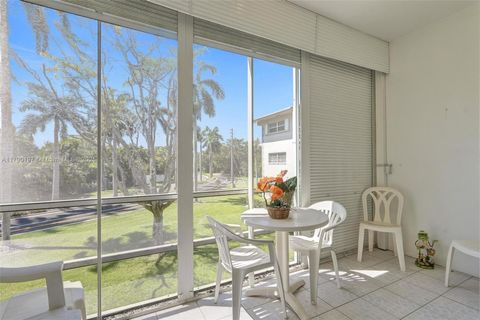
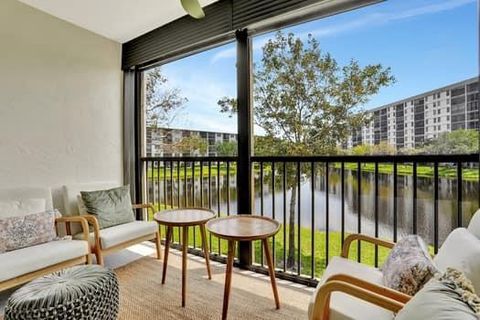
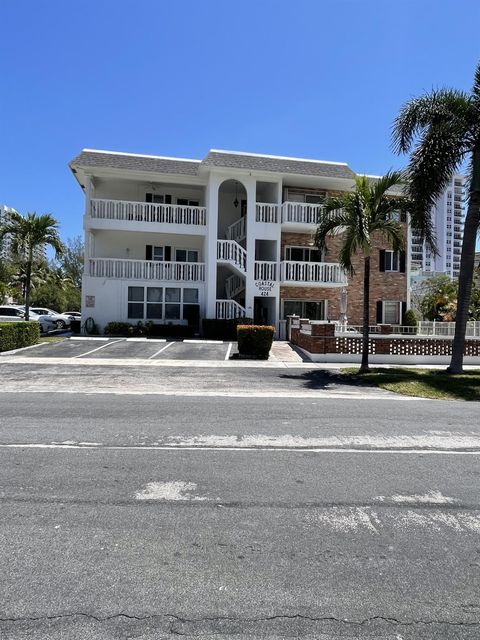
6510 Winfield Blvd, Margate, FL 33063
$-34
Cash flow
-1.3%
Cash-on-Cash Return
5.8%
Cap rate
1.2%
Rent to Value Ratio
7,582 out of 8,882 properties for sale in Broward County
Limited Results Shown
Create a free account, or log in to reveal all property listings and enjoy the complete experience.
Active
$1,349,000
4
bds
|
3
ba
|
2,591
sqft
|
built
1955
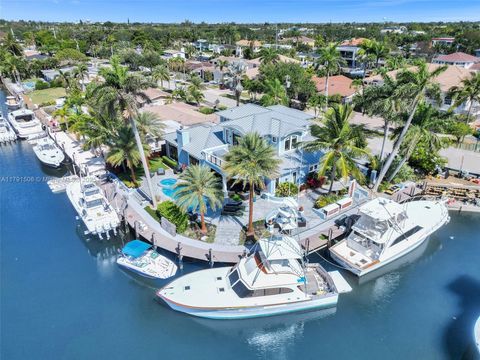
2709 NE 30th St, Fort Lauderdale, FL 33306
$-2,947
Cash flow
-11.4%
Cash-on-Cash Return
3.5%
Cap rate
0.6%
Rent to Value Ratio
Active
$749,000
2
bds
|
2
ba
|
1,680
sqft
|
built
1980
2667 S Parkview Dr, Hallandale Beach, FL 33009
$-903
Cash flow
-6.3%
Cash-on-Cash Return
4.7%
Cap rate
0.9%
Rent to Value Ratio
Active
$177,000
1
bds
|
2
ba
|
720
sqft
|
built
1981
5377 SW 40th Ave, Davie, FL 33314
$-185
Cash flow
-5.5%
Cash-on-Cash Return
4.9%
Cap rate
1.0%
Rent to Value Ratio
Active
$325,000
1
bds
|
2
ba
|
828
sqft
|
built
1974
500 Three Islands Blvd, Hallandale Beach, FL 33009
$-1,165
Cash flow
-18.7%
Cash-on-Cash Return
1.8%
Cap rate
0.8%
Rent to Value Ratio
Active
$150,000
1
bds
|
1
ba
|
720
sqft
|
built
1965
700 Layne Blvd, Hallandale Beach, FL 33009
$-394
Cash flow
-13.7%
Cash-on-Cash Return
3.0%
Cap rate
1.3%
Rent to Value Ratio

Active
$2,150,000
3
bds
|
3
ba
|
2,342
sqft
|
built
1956
2809 NE 25th St, Fort Lauderdale, FL 33305
$-5,691
Cash flow
-13.8%
Cash-on-Cash Return
3.0%
Cap rate
0.5%
Rent to Value Ratio

Active
$499,000
1
bds
|
2
ba
|
1,088
sqft
|
built
1975
3900 Galt Ocean Dr, Fort Lauderdale, FL 33308
$-1,836
Cash flow
-19.2%
Cash-on-Cash Return
1.7%
Cap rate
0.6%
Rent to Value Ratio

Active
$320,000
2
bds
|
3
ba
|
1,280
sqft
|
built
2004
703 NW 42nd Ave, Plantation, FL 33317
$-774
Cash flow
-12.6%
Cash-on-Cash Return
3.2%
Cap rate
0.7%
Rent to Value Ratio

Active
$295,000
2
bds
|
2
ba
|
1,246
sqft
|
built
2002
5051 Wiles Rd, Coconut Creek, FL 33073
$-1,015
Cash flow
-18.0%
Cash-on-Cash Return
2.0%
Cap rate
0.8%
Rent to Value Ratio
Active
$194,895
2
bds
|
2
ba
|
970
sqft
|
built
1969
1040 SE 4th Ave, Deerfield Beach, FL 33441
$-131
Cash flow
-3.5%
Cash-on-Cash Return
5.3%
Cap rate
1.0%
Rent to Value Ratio

Active
$289,900
2
bds
|
2
ba
|
900
sqft
|
built
1983
1284 S Military Trl, Deerfield Beach, FL 33442
$-859
Cash flow
-15.5%
Cash-on-Cash Return
2.6%
Cap rate
0.8%
Rent to Value Ratio
Active
$389,000
2
bds
|
2
ba
|
1,241
sqft
|
built
1995
1634 N 15th Ter, Hollywood, FL 33020
$-1,045
Cash flow
-14.0%
Cash-on-Cash Return
2.9%
Cap rate
0.6%
Rent to Value Ratio
Active
$299,000
2
bds
|
2
ba
|
1,150
sqft
|
built
1972
427 Golden Isles Dr, Hallandale Beach, FL 33009
$-627
Cash flow
-10.9%
Cash-on-Cash Return
3.6%
Cap rate
1.0%
Rent to Value Ratio
Active
$5,295,000
4
bds
|
4
ba
|
3,478
sqft
|
built
2018
2340 NE 48th St, Lighthouse Point, FL 33064
$-24,817
Cash flow
-24.5%
Cash-on-Cash Return
0.5%
Cap rate
0.1%
Rent to Value Ratio

Active
$180,000
1
bds
|
1
ba
|
655
sqft
|
built
1970
348 S Federal Hwy, Dania Beach, FL 33004
$-292
Cash flow
-8.5%
Cash-on-Cash Return
4.2%
Cap rate
0.9%
Rent to Value Ratio

Active
$3,500,000
5
bds
|
6
ba
|
4,182
sqft
|
built
2007
2409 NE 12th St, Fort Lauderdale, FL 33304
$-13,996
Cash flow
-20.9%
Cash-on-Cash Return
1.3%
Cap rate
0.3%
Rent to Value Ratio
Active
$249,000
2
bds
|
2
ba
|
840
sqft
|
built
1989
2228 N Cypress Bend Dr, Pompano Beach, FL 33069
$-654
Cash flow
-13.7%
Cash-on-Cash Return
3.0%
Cap rate
0.9%
Rent to Value Ratio
Active
$575,000
4
bds
|
2
ba
|
1,656
sqft
|
built
1960
3141 Riverland Rd, Fort Lauderdale, FL 33312
$-885
Cash flow
-8.0%
Cash-on-Cash Return
4.3%
Cap rate
0.6%
Rent to Value Ratio
Active
$214,900
2
bds
|
2
ba
|
984
sqft
|
built
1991
7640 Westwood Dr, Tamarac, FL 33321
$-751
Cash flow
-18.2%
Cash-on-Cash Return
2.0%
Cap rate
0.9%
Rent to Value Ratio
Active
$249,999
2
bds
|
2
ba
|
820
sqft
|
built
1971
424 N Riverside Dr, Pompano Beach, FL 33062
$-619
Cash flow
-12.9%
Cash-on-Cash Return
3.2%
Cap rate
0.9%
Rent to Value Ratio

Active
$9,750,000
5
bds
|
5
ba
|
5,299
sqft
|
built
1982
2561 Lucille Dr, Fort Lauderdale, FL 33316
$-51,281
Cash flow
-27.4%
Cash-on-Cash Return
-0.2%
Cap rate
0.1%
Rent to Value Ratio

Active
$325,000
2
bds
|
2
ba
|
1,080
sqft
|
built
1967
1967 S Ocean Blvd, Pompano Beach, FL 33062
$-1,405
Cash flow
-22.6%
Cash-on-Cash Return
1.0%
Cap rate
0.8%
Rent to Value Ratio
Active
$759,000
3
bds
|
3
ba
|
0
sqft
|
built
1956
1163 Johnson St, Hollywood, FL 33019
$-701
Cash flow
-4.8%
Cash-on-Cash Return
5.0%
Cap rate
0.7%
Rent to Value Ratio

Active
$674,700
2
bds
|
2
ba
|
1,950
sqft
|
built
2005
9 NE 20th Ave, Deerfield Beach, FL 33441
$-3,464
Cash flow
-26.8%
Cash-on-Cash Return
0.0%
Cap rate
0.6%
Rent to Value Ratio
Active
$990,000
5
bds
|
4
ba
|
2,030
sqft
|
built
1972
1640 Washington St, Hollywood, FL 33020
$-3,277
Cash flow
-17.3%
Cash-on-Cash Return
2.2%
Cap rate
0.4%
Rent to Value Ratio

Active
$1,399,999
5
bds
|
4
ba
|
4,176
sqft
|
built
2017
9800 S Miralago Way, Parkland, FL 33076
$-4,160
Cash flow
-15.5%
Cash-on-Cash Return
2.6%
Cap rate
0.6%
Rent to Value Ratio

Active
$569,900
3
bds
|
2
ba
|
1,657
sqft
|
built
2001
4803 NW 59th Ct, Coconut Creek, FL 33073
$-1,431
Cash flow
-13.1%
Cash-on-Cash Return
3.1%
Cap rate
0.7%
Rent to Value Ratio

Active
$1,100,000
5
bds
|
4
ba
|
3,345
sqft
|
built
2002
1322 NW 139th Ave, Pembroke Pines, FL 33028
$-3,374
Cash flow
-16.0%
Cash-on-Cash Return
2.5%
Cap rate
0.5%
Rent to Value Ratio

Active
$209,000
1
bds
|
2
ba
|
700
sqft
|
built
2006
101 SE 6th Ave, Pompano Beach, FL 33060
$-422
Cash flow
-10.5%
Cash-on-Cash Return
3.7%
Cap rate
0.9%
Rent to Value Ratio
Active
$425,000
4
bds
|
2
ba
|
1,268
sqft
|
built
1955
6328 Garfield St, Hollywood, FL 33024
$-1,028
Cash flow
-12.6%
Cash-on-Cash Return
3.2%
Cap rate
0.7%
Rent to Value Ratio

Active
$399,000
3
bds
|
1
ba
|
1,171
sqft
|
built
1957
3200 NW 5th St, Lauderhill, FL 33311
$-511
Cash flow
-6.7%
Cash-on-Cash Return
4.6%
Cap rate
0.6%
Rent to Value Ratio

Active
$295,000
2
bds
|
2
ba
|
1,242
sqft
|
built
1983
1359 Hampton Blvd, North Lauderdale, FL 33068
$-401
Cash flow
-7.1%
Cash-on-Cash Return
4.5%
Cap rate
0.8%
Rent to Value Ratio

Active
$495,000
1
bds
|
2
ba
|
955
sqft
|
built
1963
888 Intracoastal Dr, Fort Lauderdale, FL 33304
$-2,255
Cash flow
-23.8%
Cash-on-Cash Return
0.7%
Cap rate
0.6%
Rent to Value Ratio

Active
$898,000
2
bds
|
3
ba
|
1,650
sqft
|
built
1974
1360 S Ocean Blvd, Pompano Beach, FL 33062
$-3,252
Cash flow
-18.9%
Cash-on-Cash Return
1.8%
Cap rate
0.6%
Rent to Value Ratio

Active
$334,000
2
bds
|
2
ba
|
1,256
sqft
|
built
1980
342 Lakeview Dr, Weston, FL 33326
$-882
Cash flow
-13.8%
Cash-on-Cash Return
3.0%
Cap rate
0.7%
Rent to Value Ratio
Active
$649,900
4
bds
|
4
ba
|
2,253
sqft
|
built
1954
2869 SW 13th Ct, Fort Lauderdale, FL 33312
$-1,205
Cash flow
-9.7%
Cash-on-Cash Return
3.9%
Cap rate
0.7%
Rent to Value Ratio
Active
$455,000
2
bds
|
1
ba
|
854
sqft
|
built
1960
7531 Tropicana St, Miramar, FL 33023
$-463
Cash flow
-5.3%
Cash-on-Cash Return
4.9%
Cap rate
0.6%
Rent to Value Ratio
Active
$545,000
1
bds
|
2
ba
|
820
sqft
|
built
1970
400 N Surf Rd, Hollywood, FL 33019
$-1,458
Cash flow
-14.0%
Cash-on-Cash Return
2.9%
Cap rate
0.6%
Rent to Value Ratio