Broward County Investment Properties for Sale
Browse homes for sale and investment properties in Broward County. Refine your search by price, property type, or more.
Best cash flowing properties in Broward County
Active
$159,000
1
bds
|
1
ba
|
320
sqft
|
built
1960
26 Diplomat Pkwy, Hallandale Beach, FL 33009
$-170
Cash flow
-5.6%
Cash-on-Cash Return
4.9%
Cap rate
1.1%
Rent to Value Ratio
Active
$174,800
2
bds
|
1
ba
|
850
sqft
|
built
1978
4140 NW 90th Ave, Coral Springs, FL 33065
$-208
Cash flow
-6.2%
Cash-on-Cash Return
4.7%
Cap rate
1.0%
Rent to Value Ratio
7,582 out of 8,882 properties for sale in Broward County
Limited Results Shown
Create a free account, or log in to reveal all property listings and enjoy the complete experience.

Active
$625,000
3
bds
|
3
ba
|
1,968
sqft
|
built
2001
2031 SW 104th Ave, Miramar, FL 33025
$-1,694
Cash flow
-14.1%
Cash-on-Cash Return
2.9%
Cap rate
0.6%
Rent to Value Ratio
Active
$310,000
2
bds
|
2
ba
|
1,110
sqft
|
built
1995
8132 San Carlos Cir, Tamarac, FL 33321
$-698
Cash flow
-11.7%
Cash-on-Cash Return
3.4%
Cap rate
0.8%
Rent to Value Ratio
Active
$385,000
1
bds
|
1
ba
|
883
sqft
|
built
1966
3001 S Ocean Dr, Hollywood, FL 33019
$-1,695
Cash flow
-23.0%
Cash-on-Cash Return
0.9%
Cap rate
0.7%
Rent to Value Ratio

Active
$359,000
3
bds
|
2
ba
|
1,333
sqft
|
built
1975
2360 SW 70th Ter, Davie, FL 33317
$-731
Cash flow
-10.6%
Cash-on-Cash Return
3.7%
Cap rate
0.7%
Rent to Value Ratio

Active
$820,000
4
bds
|
3
ba
|
1,902
sqft
|
built
1998
4242 Magnolia Ridge Dr, Weston, FL 33331
$-2,246
Cash flow
-14.3%
Cash-on-Cash Return
2.9%
Cap rate
0.6%
Rent to Value Ratio
Active
$713,000
3
bds
|
2
ba
|
1,947
sqft
|
built
1993
13331 SW 17th Ct, Miramar, FL 33027
$-1,581
Cash flow
-11.6%
Cash-on-Cash Return
3.5%
Cap rate
0.5%
Rent to Value Ratio

Active
$2,100,000
3
bds
|
5
ba
|
4,389
sqft
|
built
2005
301 Hendricks Isle, Fort Lauderdale, FL 33301
$-10,011
Cash flow
-24.9%
Cash-on-Cash Return
0.4%
Cap rate
0.4%
Rent to Value Ratio
Active
$447,500
4
bds
|
2
ba
|
910
sqft
|
built
1955
2649 NE 14th Ter, Pompano Beach, FL 33064
$-780
Cash flow
-9.1%
Cash-on-Cash Return
4.1%
Cap rate
0.7%
Rent to Value Ratio

Active
$599,900
2
bds
|
2
ba
|
1,987
sqft
|
built
1972
8520 SW 26th St, Davie, FL 33324
$-1,198
Cash flow
-10.4%
Cash-on-Cash Return
3.8%
Cap rate
0.6%
Rent to Value Ratio
Active
$280,000
2
bds
|
2
ba
|
975
sqft
|
built
1976
112 Royal Park Dr, Oakland Park, FL 33309
$-978
Cash flow
-18.2%
Cash-on-Cash Return
2.0%
Cap rate
0.8%
Rent to Value Ratio
Active
$895,000
4
bds
|
3
ba
|
1,742
sqft
|
built
1954
3345 NE 20th Ave, Oakland Park, FL 33306
$-2,574
Cash flow
-15.0%
Cash-on-Cash Return
2.7%
Cap rate
0.5%
Rent to Value Ratio
Active
$399,990
2
bds
|
2
ba
|
1,052
sqft
|
built
2007
1755 E Hallandale Beach Blvd, Hallandale Beach, FL 33009
$-1,517
Cash flow
-19.8%
Cash-on-Cash Return
1.6%
Cap rate
0.8%
Rent to Value Ratio

Active
$269,000
3
bds
|
2
ba
|
1,390
sqft
|
built
1972
2851 S Palm Aire Dr, Pompano Beach, FL 33069
$-1,129
Cash flow
-21.9%
Cash-on-Cash Return
1.1%
Cap rate
0.9%
Rent to Value Ratio

Active
$549,000
3
bds
|
2
ba
|
1,582
sqft
|
built
1973
6924 NW 8th Ct, Margate, FL 33063
$-882
Cash flow
-8.4%
Cash-on-Cash Return
4.2%
Cap rate
0.7%
Rent to Value Ratio

Active
$460,000
2
bds
|
2
ba
|
1,270
sqft
|
built
1973
3800 S Ocean Dr, Hollywood, FL 33019
$-1,754
Cash flow
-19.9%
Cash-on-Cash Return
1.6%
Cap rate
0.8%
Rent to Value Ratio
Active
$499,900
3
bds
|
3
ba
|
1,380
sqft
|
built
1993
1163 SE 6th Ct, Dania Beach, FL 33004
$-1,834
Cash flow
-19.1%
Cash-on-Cash Return
1.7%
Cap rate
0.5%
Rent to Value Ratio

Active
$8,500,000
3
bds
|
4
ba
|
4,056
sqft
|
built
2007
1 N Fort Lauderdale Beach Blvd, Fort Lauderdale, FL 33304
$-41,407
Cash flow
-25.4%
Cash-on-Cash Return
0.3%
Cap rate
0.1%
Rent to Value Ratio

Active
$445,500
3
bds
|
2
ba
|
1,416
sqft
|
built
1958
3830 NW 7th Ct, Lauderhill, FL 33311
$-1,126
Cash flow
-13.2%
Cash-on-Cash Return
3.1%
Cap rate
0.6%
Rent to Value Ratio

Active
$2,345,000
4
bds
|
4
ba
|
2,960
sqft
|
built
2006
701 SE 21st Ave, Deerfield Beach, FL 33441
$-9,809
Cash flow
-21.8%
Cash-on-Cash Return
1.1%
Cap rate
0.4%
Rent to Value Ratio

Active
$439,900
1
bds
|
2
ba
|
1,049
sqft
|
built
2006
2631 NE 14th Ave, Wilton Manors, FL 33334
$-1,721
Cash flow
-20.4%
Cash-on-Cash Return
1.5%
Cap rate
0.7%
Rent to Value Ratio

Active
$220,000
2
bds
|
2
ba
|
870
sqft
|
built
1972
1061 NW 45th St, Deerfield Beach, FL 33064
$-610
Cash flow
-14.5%
Cash-on-Cash Return
2.8%
Cap rate
0.9%
Rent to Value Ratio

Active
$189,900
2
bds
|
2
ba
|
1,290
sqft
|
built
1981
5530 NW 44th St, Lauderhill, FL 33319
$-908
Cash flow
-24.9%
Cash-on-Cash Return
0.4%
Cap rate
1.1%
Rent to Value Ratio

Active
$300,000
2
bds
|
2
ba
|
1,100
sqft
|
built
1980
2273 SW 15th St, Deerfield Beach, FL 33442
$-765
Cash flow
-13.3%
Cash-on-Cash Return
3.1%
Cap rate
0.8%
Rent to Value Ratio
Active
$345,000
2
bds
|
3
ba
|
1,242
sqft
|
built
1985
1339 Sussex Dr, North Lauderdale, FL 33068
$-326
Cash flow
-4.9%
Cash-on-Cash Return
5.0%
Cap rate
0.7%
Rent to Value Ratio

Active
$784,900
3
bds
|
3
ba
|
2,069
sqft
|
built
1994
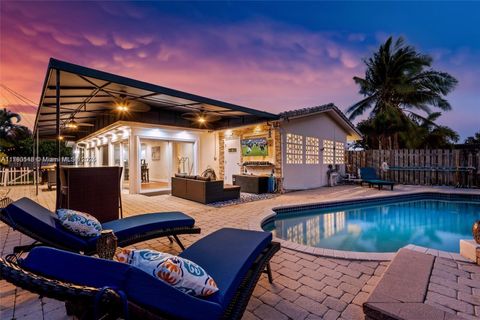
975 Weeping Willow Way, Hollywood, FL 33019
$-1,411
Cash flow
-9.4%
Cash-on-Cash Return
4.0%
Cap rate
0.7%
Rent to Value Ratio
Active
$239,900
1
bds
|
2
ba
|
780
sqft
|
built
1969
1825 S Ocean Dr, Hallandale Beach, FL 33009
$-756
Cash flow
-16.4%
Cash-on-Cash Return
2.4%
Cap rate
0.9%
Rent to Value Ratio

Active
$2,900,000
4
bds
|
5
ba
|
3,254
sqft
|
built
2009
1312 SE 2nd St, Fort Lauderdale, FL 33301
$-10,973
Cash flow
-19.7%
Cash-on-Cash Return
1.6%
Cap rate
0.4%
Rent to Value Ratio
Active
$675,000
3
bds
|
2
ba
|
1,610
sqft
|
built
1966
2231 NE 38th St, Lighthouse Point, FL 33064
$-1,025
Cash flow
-7.9%
Cash-on-Cash Return
4.3%
Cap rate
0.7%
Rent to Value Ratio
Active
$535,999
4
bds
|
2
ba
|
0
sqft
|
built
1971
5731 SW 54th Ter, Davie, FL 33314
$-701
Cash flow
-6.8%
Cash-on-Cash Return
4.6%
Cap rate
0.7%
Rent to Value Ratio
Active
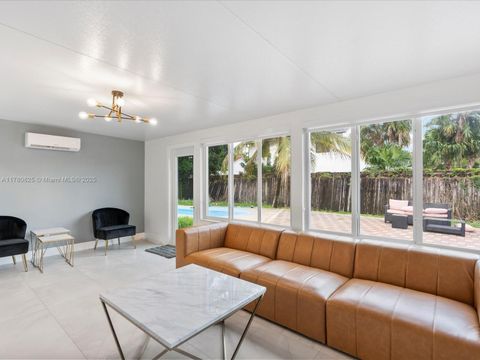
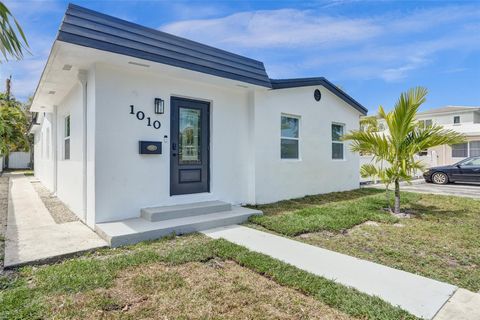
$590,000
3
bds
|
2
ba
|
1,493
sqft
|
built
1931
1010 N 16th Ave, Hollywood, FL 33020
$-981
Cash flow
-8.7%
Cash-on-Cash Return
4.2%
Cap rate
0.5%
Rent to Value Ratio
Active
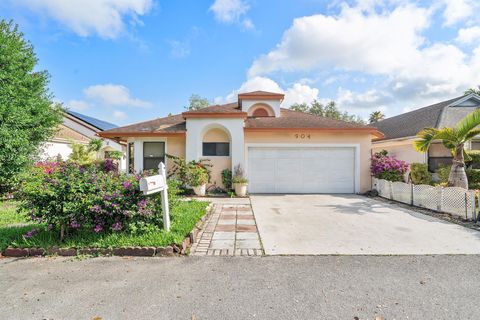
$468,000
3
bds
|
2
ba
|
1,470
sqft
|
built
1994
904 Magnolia Ave, North Lauderdale, FL 33068
$-716
Cash flow
-8.0%
Cash-on-Cash Return
4.3%
Cap rate
0.7%
Rent to Value Ratio

Active
$259,000
3
bds
|
2
ba
|
1,590
sqft
|
built
1977
3960 Oaks Clubhouse Dr, Pompano Beach, FL 33069
$-637
Cash flow
-12.8%
Cash-on-Cash Return
3.2%
Cap rate
1.0%
Rent to Value Ratio
Active
$979,000
3
bds
|
3
ba
|
1,727
sqft
|
built
1953
2000 NE 26th Dr, Wilton Manors, FL 33306
$-1,963
Cash flow
-10.5%
Cash-on-Cash Return
3.7%
Cap rate
0.6%
Rent to Value Ratio

Active
$514,000
3
bds
|
2
ba
|
1,923
sqft
|
built
1979
8320 NW 54th Ct, Lauderhill, FL 33351
$-1,321
Cash flow
-13.4%
Cash-on-Cash Return
3.1%
Cap rate
0.6%
Rent to Value Ratio

Active
$725,000
4
bds
|
2
ba
|
2,367
sqft
|
built
1952
1109 NE 16th Pl, Fort Lauderdale, FL 33305
$-966
Cash flow
-7.0%
Cash-on-Cash Return
4.5%
Cap rate
0.6%
Rent to Value Ratio

Active
$895,000
3
bds
|
3
ba
|
2,047
sqft
|
built
2023
17324 SW 41st St, Miramar, FL 33029
$-2,648
Cash flow
-15.4%
Cash-on-Cash Return
2.6%
Cap rate
0.6%
Rent to Value Ratio

Active
$2,199,000
3
bds
|
3
ba
|
1,929
sqft
|
built
1965
1720 Marietta Dr, Fort Lauderdale, FL 33316
$-6,332
Cash flow
-15.0%
Cash-on-Cash Return
2.7%
Cap rate
0.5%
Rent to Value Ratio
Active
$185,000
2
bds
|
2
ba
|
937
sqft
|
built
1974
11651 Royal Palm Blvd, Coral Springs, FL 33065
$-437
Cash flow
-12.3%
Cash-on-Cash Return
3.3%
Cap rate
1.1%
Rent to Value Ratio