Miami Dade County Investment Properties for Sale
Browse homes for sale and investment properties in Miami Dade County. Refine your search by price, property type, or more.
Best cash flowing properties in Miami Dade County
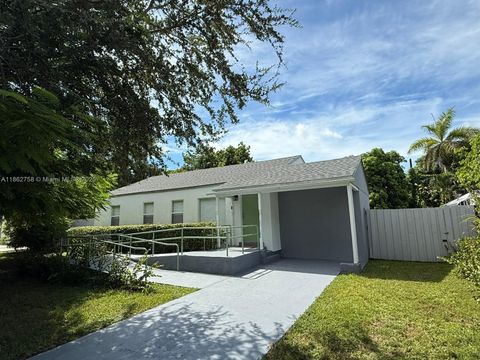
Active
$155,000
1
bds
|
2
ba
|
883
sqft
|
built
1972
1700 NE 191st St, Miami, FL 33179
$-220
Cash flow
-7.4%
Cash-on-Cash Return
4.4%
Cap rate
1.2%
Rent to Value Ratio
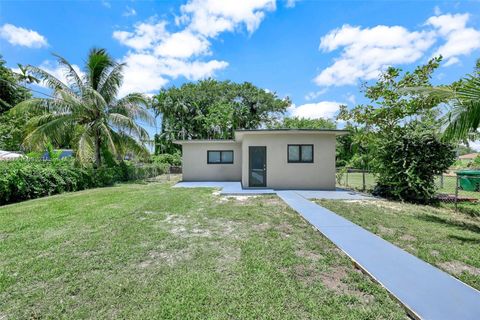
Active
$279,000
2
bds
|
2
ba
|
1,086
sqft
|
built
1975
9441 SW 4th St, Miami, FL 33174
$-375
Cash flow
-7.0%
Cash-on-Cash Return
4.5%
Cap rate
0.9%
Rent to Value Ratio
10,000 out of 12,672 properties for sale in Miami Dade County
Limited Results Shown
Create a free account, or log in to reveal all property listings and enjoy the complete experience.
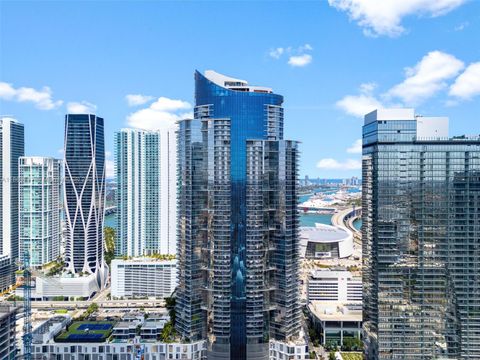
Active
$3,300,000
4
bds
|
4
ba
|
3,764
sqft
|
built
1999
23400 SW 192nd Ave, Homestead, FL 33031
$-16,419
Cash flow
-26.0%
Cash-on-Cash Return
0.2%
Cap rate
0.1%
Rent to Value Ratio
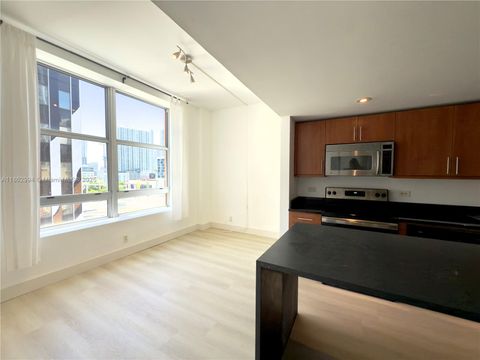
Active
$950,000
1
bds
|
2
ba
|
1,260
sqft
|
built
1993
16445 Collins Ave, Sunny Isles Beach, FL 33160
$-2,845
Cash flow
-15.6%
Cash-on-Cash Return
2.6%
Cap rate
0.5%
Rent to Value Ratio
Active
$695,000
2
bds
|
2
ba
|
1,141
sqft
|
built
2008
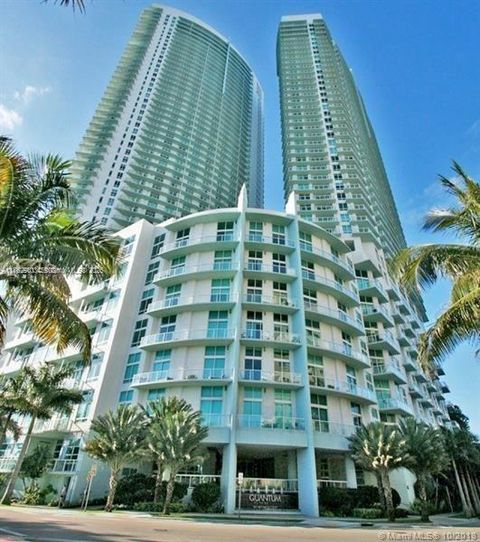
1900 N Bayshore Dr, Miami, FL 33132
$-3,205
Cash flow
-24.1%
Cash-on-Cash Return
0.6%
Cap rate
0.5%
Rent to Value Ratio
Active
$949,000
4
bds
|
3
ba
|
2,133
sqft
|
built
1999
8885 NW 175th St, Hialeah, FL 33018
$-2,465
Cash flow
-13.6%
Cash-on-Cash Return
3.0%
Cap rate
0.4%
Rent to Value Ratio
Active
$570,000
3
bds
|
2
ba
|
1,312
sqft
|
built
1947
508 E 40th St, Hialeah, FL 33013
$-861
Cash flow
-7.9%
Cash-on-Cash Return
4.3%
Cap rate
0.7%
Rent to Value Ratio
Active
$699,000
2
bds
|
3
ba
|
1,663
sqft
|
built
2008
2950 NE 188th St, Aventura, FL 33180
$-2,931
Cash flow
-21.9%
Cash-on-Cash Return
1.1%
Cap rate
0.7%
Rent to Value Ratio

Active
$512,000
3
bds
|
2
ba
|
1,244
sqft
|
built
1952
1985 NE 177th St, North Miami Beach, FL 33162
$-943
Cash flow
-9.6%
Cash-on-Cash Return
3.9%
Cap rate
0.6%
Rent to Value Ratio
Active
$260,000
2
bds
|
2
ba
|
822
sqft
|
built
1974
3582 NE 171st St, North Miami Beach, FL 33160
$-690
Cash flow
-13.8%
Cash-on-Cash Return
3.0%
Cap rate
0.8%
Rent to Value Ratio
Active
$440,000
1
bds
|
1
ba
|
903
sqft
|
built
2007
133 NE 2nd Ave, Miami, FL 33132
$-1,378
Cash flow
-16.3%
Cash-on-Cash Return
2.4%
Cap rate
0.7%
Rent to Value Ratio
Active
$635,000
1
bds
|
1
ba
|
701
sqft
|
built
2014
1300 Brickell Bay Dr, Miami, FL 33131
$-1,727
Cash flow
-14.2%
Cash-on-Cash Return
2.9%
Cap rate
0.7%
Rent to Value Ratio
Active
$595,000
1
bds
|
1
ba
|
806
sqft
|
built
2009
500 Brickell Ave, Miami, FL 33131
$-2,072
Cash flow
-18.2%
Cash-on-Cash Return
2.0%
Cap rate
0.7%
Rent to Value Ratio
Active
$875,000
3
bds
|
2
ba
|
1,199
sqft
|
built
1948
5822 SW 60th St, Miami, FL 33143
$-2,746
Cash flow
-16.4%
Cash-on-Cash Return
2.4%
Cap rate
0.4%
Rent to Value Ratio
Active
$550,000
3
bds
|
3
ba
|
1,056
sqft
|
built
1926
8280 NW 5th Ave, Miami, FL 33150
$-1,287
Cash flow
-12.2%
Cash-on-Cash Return
3.3%
Cap rate
0.5%
Rent to Value Ratio
Active
$775,000
2
bds
|
2
ba
|
1,173
sqft
|
built
2019
851 NE 1st Ave, Miami, FL 33132
$-3,472
Cash flow
-23.4%
Cash-on-Cash Return
0.8%
Cap rate
0.7%
Rent to Value Ratio
Active
$340,000
2
bds
|
1
ba
|
836
sqft
|
built
1951
111 E Flagler St, Miami, FL 33131
$-1,255
Cash flow
-19.3%
Cash-on-Cash Return
1.7%
Cap rate
0.7%
Rent to Value Ratio
Active
$699,000
4
bds
|
4
ba
|
2,254
sqft
|
built
2023
13663 SW 158th Ave, Miami, FL 33196
$-1,585
Cash flow
-11.8%
Cash-on-Cash Return
3.4%
Cap rate
0.6%
Rent to Value Ratio
Active
$669,000
1
bds
|
1
ba
|
701
sqft
|
built
2014
1300 Brickell Bay Dr, Miami, FL 33131
$-2,251
Cash flow
-17.6%
Cash-on-Cash Return
2.1%
Cap rate
0.6%
Rent to Value Ratio
Active
$520,000
2
bds
|
2
ba
|
821
sqft
|
built
2018
321 NE 26th St, Miami, FL 33137
$-1,947
Cash flow
-19.5%
Cash-on-Cash Return
1.7%
Cap rate
0.6%
Rent to Value Ratio
Active
$2,725,000
2
bds
|
3
ba
|
1,900
sqft
|
built
2008
1100 West Ave, Miami Beach, FL 33139
$-15,367
Cash flow
-29.4%
Cash-on-Cash Return
-0.6%
Cap rate
0.3%
Rent to Value Ratio
Active
$530,000
2
bds
|
2
ba
|
1,245
sqft
|
built
2002
19501 W Country Club Dr, Aventura, FL 33180
$-1,840
Cash flow
-18.1%
Cash-on-Cash Return
2.0%
Cap rate
0.7%
Rent to Value Ratio
Active
$235,000
2
bds
|
2
ba
|
1,140
sqft
|
built
1969
1351 NE Miami Gardens Dr, Miami, FL 33179
$-476
Cash flow
-10.6%
Cash-on-Cash Return
3.7%
Cap rate
1.0%
Rent to Value Ratio
Active
$779,000
4
bds
|
3
ba
|
2,203
sqft
|
built
2000
14824 SW 180th St, Miami, FL 33187
$-1,638
Cash flow
-11.0%
Cash-on-Cash Return
3.6%
Cap rate
0.5%
Rent to Value Ratio
Active
$475,000
3
bds
|
2
ba
|
1,550
sqft
|
built
2003
1417 SE 22nd Ln, Homestead, FL 33035
$-1,125
Cash flow
-12.4%
Cash-on-Cash Return
3.3%
Cap rate
0.7%
Rent to Value Ratio
Active
$1,225,000
4
bds
|
2
ba
|
1,789
sqft
|
built
1962
20350 Highland Lakes Blvd, Miami, FL 33179
$-3,463
Cash flow
-14.7%
Cash-on-Cash Return
2.8%
Cap rate
0.4%
Rent to Value Ratio
Active
$499,000
1
bds
|
1
ba
|
612
sqft
|
built
2018
121 NE 34th St, Miami, FL 33137
$-2,042
Cash flow
-21.4%
Cash-on-Cash Return
1.2%
Cap rate
0.6%
Rent to Value Ratio
Active
$435,000
4
bds
|
3
ba
|
1,965
sqft
|
built
2006
2499 SE 14th St, Homestead, FL 33035
$-571
Cash flow
-6.8%
Cash-on-Cash Return
4.6%
Cap rate
0.7%
Rent to Value Ratio
Active
$1,250,000
3
bds
|
3
ba
|
2,360
sqft
|
built
1982
19500 Turnberry Way, Aventura, FL 33180
$-5,270
Cash flow
-22.0%
Cash-on-Cash Return
1.1%
Cap rate
0.6%
Rent to Value Ratio
Active
$980,000
3
bds
|
2
ba
|
2,400
sqft
|
built
1984
8635 Menteith Ter, Miami Lakes, FL 33016
$-2,412
Cash flow
-12.8%
Cash-on-Cash Return
3.2%
Cap rate
0.5%
Rent to Value Ratio
Active
$1,785,000
3
bds
|
3
ba
|
2,080
sqft
|
built
1956
1535 Mercado Ave, Coral Gables, FL 33146
$-5,232
Cash flow
-15.3%
Cash-on-Cash Return
2.6%
Cap rate
0.4%
Rent to Value Ratio
Active
$829,000
2
bds
|
2
ba
|
1,290
sqft
|
built
2000
17375 Collins Ave, Sunny Isles Beach, FL 33160
$-1,639
Cash flow
-10.3%
Cash-on-Cash Return
3.8%
Cap rate
1.0%
Rent to Value Ratio
Active
$715,000
1
bds
|
2
ba
|
826
sqft
|
built
2004
110 Washington Ave, Miami Beach, FL 33139
$-2,815
Cash flow
-20.5%
Cash-on-Cash Return
1.4%
Cap rate
0.5%
Rent to Value Ratio
Active
$9,950,000
5
bds
|
6
ba
|
4,473
sqft
|
built
2016
1825 Cleveland Rd, Miami Beach, FL 33141
$-51,137
Cash flow
-26.8%
Cash-on-Cash Return
0.0%
Cap rate
0.1%
Rent to Value Ratio
Active
$524,999
3
bds
|
2
ba
|
1,323
sqft
|
built
1985
25031 SW 126th Ct, Homestead, FL 33032
$-941
Cash flow
-9.4%
Cash-on-Cash Return
4.0%
Cap rate
0.5%
Rent to Value Ratio
Active
$489,000
4
bds
|
3
ba
|
1,725
sqft
|
built
2007
20810 SW 86th Pl, Cutler Bay, FL 33189
$-952
Cash flow
-10.2%
Cash-on-Cash Return
3.8%
Cap rate
0.7%
Rent to Value Ratio
Active
$460,000
3
bds
|
2
ba
|
1,144
sqft
|
built
1978
601 SW 94th Ct, Miami, FL 33174
$-823
Cash flow
-9.3%
Cash-on-Cash Return
4.0%
Cap rate
0.7%
Rent to Value Ratio
Active
$470,000
3
bds
|
2
ba
|
1,280
sqft
|
built
2020
3020 NW 45th St, Miami, FL 33142
$-444
Cash flow
-4.9%
Cash-on-Cash Return
5.0%
Cap rate
0.7%
Rent to Value Ratio
Active
$290,000
2
bds
|
2
ba
|
929
sqft
|
built
1997
1010 NW 11th St, Miami, FL 33136
$-683
Cash flow
-12.3%
Cash-on-Cash Return
3.3%
Cap rate
0.8%
Rent to Value Ratio
Active
$1,050,000
4
bds
|
4
ba
|
3,531
sqft
|
built
2003
14980 SW 15th Ln, Miami, FL 33194
$-2,935
Cash flow
-14.6%
Cash-on-Cash Return
2.8%
Cap rate
0.4%
Rent to Value Ratio