Miami Dade County Investment Properties for Sale
Browse homes for sale and investment properties in Miami Dade County. Refine your search by price, property type, or more.
Best cash flowing properties in Miami Dade County
Active
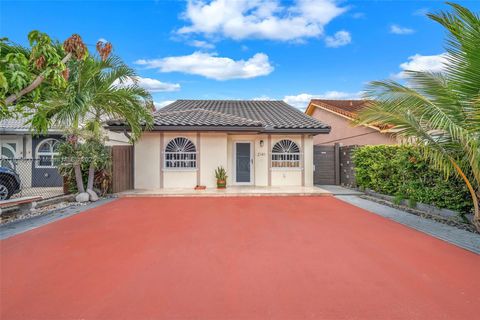
$230,000
2
bds
|
1
ba
|
802
sqft
|
built
1974
1075 W 68th St, Hialeah, FL 33014
$-165
Cash flow
-3.7%
Cash-on-Cash Return
5.3%
Cap rate
0.9%
Rent to Value Ratio
Active
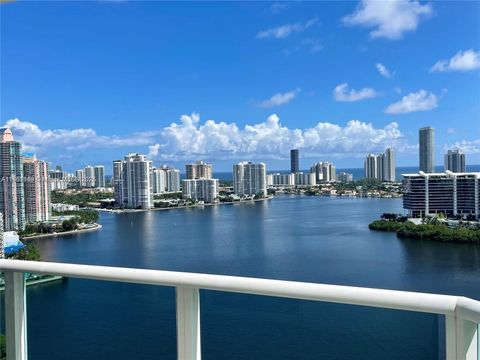
$220,000
2
bds
|
2
ba
|
978
sqft
|
built
1983
20110 NE 3rd Ct, Miami, FL 33179
$-288
Cash flow
-6.8%
Cash-on-Cash Return
4.6%
Cap rate
1.0%
Rent to Value Ratio
10,000 out of 13,645 properties for sale in Miami Dade County
Limited Results Shown
Create a free account, or log in to reveal all property listings and enjoy the complete experience.
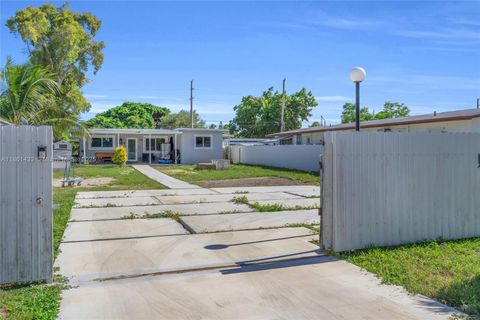
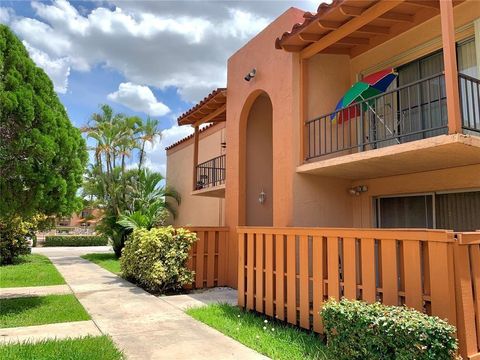
Active
$480,000
3
bds
|
1
ba
|
1,700
sqft
|
built
1953
3515 NW 98th St, Miami, FL 33147
$-728
Cash flow
-7.9%
Cash-on-Cash Return
4.3%
Cap rate
0.6%
Rent to Value Ratio
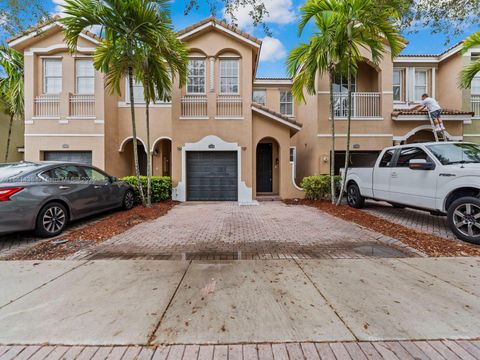
Active
$255,000
2
bds
|
2
ba
|
870
sqft
|
built
1985
18965 NW 62nd Ave, Hialeah, FL 33015
$-494
Cash flow
-10.1%
Cash-on-Cash Return
3.8%
Cap rate
0.9%
Rent to Value Ratio
Active
$1,299,999
5
bds
|
3
ba
|
2,821
sqft
|
built
2016
27410 SW 172nd Ave, Homestead, FL 33031
$-3,881
Cash flow
-15.6%
Cash-on-Cash Return
2.6%
Cap rate
0.4%
Rent to Value Ratio
Active
$800,000
3
bds
|
3
ba
|
2,460
sqft
|
built
2017
3392 W 103rd Ter, Hialeah, FL 33018
$-2,237
Cash flow
-14.6%
Cash-on-Cash Return
2.8%
Cap rate
0.5%
Rent to Value Ratio
Active
$155,000
1
bds
|
1
ba
|
696
sqft
|
built
1972
1225 NE 124th St, North Miami, FL 33161
$-343
Cash flow
-11.5%
Cash-on-Cash Return
3.5%
Cap rate
1.2%
Rent to Value Ratio
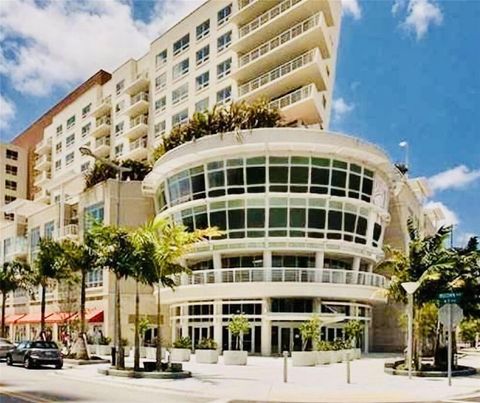
Active
$720,000
1
bds
|
1
ba
|
1,035
sqft
|
built
2009
495 Brickell Ave, Miami, FL 33131
$-2,713
Cash flow
-19.7%
Cash-on-Cash Return
1.6%
Cap rate
0.6%
Rent to Value Ratio
Active
$920,000
2
bds
|
2
ba
|
1,505
sqft
|
built
2009
495 Brickell Ave, Miami, FL 33131
$-3,018
Cash flow
-17.1%
Cash-on-Cash Return
2.2%
Cap rate
0.6%
Rent to Value Ratio
Active
$774,900
3
bds
|
2
ba
|
1,943
sqft
|
built
1992
19922 NW 88th Ave, Hialeah, FL 33018
$-1,501
Cash flow
-10.1%
Cash-on-Cash Return
3.8%
Cap rate
0.7%
Rent to Value Ratio
Active
$499,000
2
bds
|
2
ba
|
1,069
sqft
|
built
2004
1250 S Miami Ave, Miami, FL 33130
$-1,941
Cash flow
-20.3%
Cash-on-Cash Return
1.5%
Cap rate
0.7%
Rent to Value Ratio
Active
$1,250,000
2
bds
|
3
ba
|
2,534
sqft
|
built
1963
5255 Collins Ave, Miami Beach, FL 33140
$-8,082
Cash flow
-33.7%
Cash-on-Cash Return
-1.6%
Cap rate
0.4%
Rent to Value Ratio
Active
$1,455,000
4
bds
|
5
ba
|
2,718
sqft
|
built
1992
13926 SW 14th St, Miami, FL 33184
$-3,888
Cash flow
-13.9%
Cash-on-Cash Return
2.9%
Cap rate
0.4%
Rent to Value Ratio
Active
$675,000
2
bds
|
2
ba
|
990
sqft
|
built
1999
1401 Bay Rd, Miami Beach, FL 33139
$-1,875
Cash flow
-14.5%
Cash-on-Cash Return
2.8%
Cap rate
0.5%
Rent to Value Ratio
Active
$1,300,000
3
bds
|
3
ba
|
2,608
sqft
|
built
2002
23600 SW 187th Ave, Homestead, FL 33031
$-4,323
Cash flow
-17.3%
Cash-on-Cash Return
2.2%
Cap rate
0.3%
Rent to Value Ratio
Active
$349,000
1
bds
|
2
ba
|
750
sqft
|
built
1971
1228 West Ave, Miami Beach, FL 33139
$-1,064
Cash flow
-15.9%
Cash-on-Cash Return
2.5%
Cap rate
0.8%
Rent to Value Ratio
Active
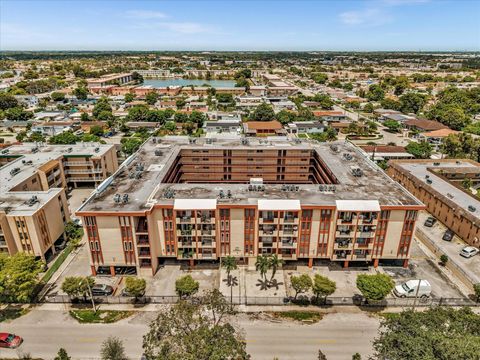
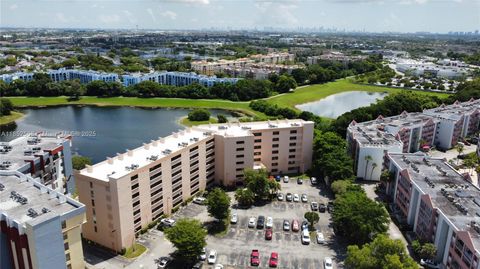
$208,000
2
bds
|
2
ba
|
1,075
sqft
|
built
1974
14850 Naranja Lakes Blvd, Homestead, FL 33032
$-410
Cash flow
-10.3%
Cash-on-Cash Return
3.8%
Cap rate
0.9%
Rent to Value Ratio
Active
$1,650,000
4
bds
|
3
ba
|
2,662
sqft
|
built
1964
8355 SW 89th St, Miami, FL 33156
$-2,717
Cash flow
-8.6%
Cash-on-Cash Return
4.2%
Cap rate
0.5%
Rent to Value Ratio
Active
$225,000
1
bds
|
1
ba
|
600
sqft
|
built
1986
576 NW 114th Ave, Miami, FL 33172
$-401
Cash flow
-9.3%
Cash-on-Cash Return
4.0%
Cap rate
0.8%
Rent to Value Ratio
Active
$599,000
3
bds
|
3
ba
|
1,966
sqft
|
built
1973
10409 SW 80th St, Miami, FL 33173
$-1,671
Cash flow
-14.6%
Cash-on-Cash Return
2.8%
Cap rate
0.5%
Rent to Value Ratio
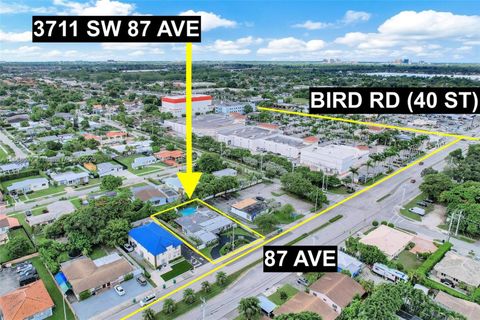
Active
$1,600,000
4
bds
|
3
ba
|
2,928
sqft
|
built
1954
3711 SW 87th Ave, Miami, FL 33165
$-4,986
Cash flow
-16.3%
Cash-on-Cash Return
2.4%
Cap rate
0.3%
Rent to Value Ratio
Active
$1,165,000
3
bds
|
3
ba
|
1,334
sqft
|
built
2018
801 S Miami Ave, Miami, FL 33130
$-2,812
Cash flow
-12.6%
Cash-on-Cash Return
3.3%
Cap rate
0.8%
Rent to Value Ratio
Active
$257,777
1
bds
|
1
ba
|
536
sqft
|
built
1973
200 177th Dr, Sunny Isles Beach, FL 33160
$-712
Cash flow
-14.4%
Cash-on-Cash Return
2.8%
Cap rate
0.8%
Rent to Value Ratio

Active
$825,000
4
bds
|
3
ba
|
3,042
sqft
|
built
1994
26605 SW 173rd Ct, Homestead, FL 33031
$-1,074
Cash flow
-6.8%
Cash-on-Cash Return
4.6%
Cap rate
0.7%
Rent to Value Ratio
Active
$287,500
2
bds
|
2
ba
|
936
sqft
|
built
1981
10835 SW 112th Ave, Miami, FL 33176
$-722
Cash flow
-13.1%
Cash-on-Cash Return
3.1%
Cap rate
0.8%
Rent to Value Ratio
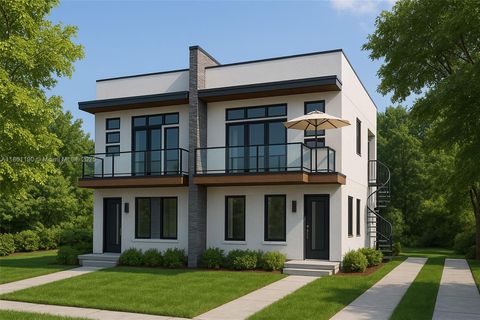
Active
$830,000
4
bds
|
3
ba
|
2,393
sqft
|
built
2018
15012 SW 177th Ter, Miami, FL 33187
$-1,142
Cash flow
-7.2%
Cash-on-Cash Return
4.5%
Cap rate
0.6%
Rent to Value Ratio
Active
$219,000
1
bds
|
1
ba
|
813
sqft
|
built
1982
9688 Fontainebleau Blvd, Miami, FL 33172
$-524
Cash flow
-12.5%
Cash-on-Cash Return
3.3%
Cap rate
0.9%
Rent to Value Ratio
Active
$1,250,000
1
bds
|
2
ba
|
1,114
sqft
|
built
2003
1425 Brickell Ave, Miami, FL 33131
$-5,040
Cash flow
-21.0%
Cash-on-Cash Return
1.3%
Cap rate
0.5%
Rent to Value Ratio
Active
$455,000
2
bds
|
1
ba
|
720
sqft
|
built
1957
2930 NW 90th St, Miami, FL 33147
$-1,153
Cash flow
-13.2%
Cash-on-Cash Return
3.1%
Cap rate
0.5%
Rent to Value Ratio
Active
$810,000
2
bds
|
0
ba
|
1,771
sqft
|
built
1936
3553 SW 14th St, Miami, FL 33145
$-2,742
Cash flow
-17.7%
Cash-on-Cash Return
2.1%
Cap rate
0.4%
Rent to Value Ratio
Active
$520,000
1
bds
|
1
ba
|
755
sqft
|
built
2007
3250 NE 1st Ave, Miami, FL 33137
$-1,783
Cash flow
-17.9%
Cash-on-Cash Return
2.0%
Cap rate
0.7%
Rent to Value Ratio
Active
$510,000
3
bds
|
2
ba
|
1,286
sqft
|
built
1987
2141 W 53rd St, Hialeah, FL 33016
$-712
Cash flow
-7.3%
Cash-on-Cash Return
4.5%
Cap rate
0.6%
Rent to Value Ratio
Active
$1,950,000
3
bds
|
4
ba
|
3,073
sqft
|
built
2007
3301 NE 183rd St, Aventura, FL 33160
$-8,014
Cash flow
-21.4%
Cash-on-Cash Return
1.2%
Cap rate
0.5%
Rent to Value Ratio
Active
$285,000
2
bds
|
2
ba
|
816
sqft
|
built
1972
7231 Miami Lakes Dr, Miami Lakes, FL 33014
$-390
Cash flow
-7.1%
Cash-on-Cash Return
4.5%
Cap rate
0.8%
Rent to Value Ratio
Active
$337,900
3
bds
|
3
ba
|
1,732
sqft
|
built
2007
1458 SE 26th Ave, Homestead, FL 33035
$-805
Cash flow
-12.4%
Cash-on-Cash Return
3.3%
Cap rate
0.7%
Rent to Value Ratio
Active
$1,999,000
2
bds
|
2
ba
|
1,089
sqft
|
built
2019
18975 Collins Ave, Sunny Isles Beach, FL 33160
$-8,204
Cash flow
-21.4%
Cash-on-Cash Return
1.2%
Cap rate
0.4%
Rent to Value Ratio
Active
$289,000
2
bds
|
1
ba
|
816
sqft
|
built
1972
7208 Fairway Dr, Miami Lakes, FL 33014
$-522
Cash flow
-9.4%
Cash-on-Cash Return
4.0%
Cap rate
0.8%
Rent to Value Ratio
Active
$505,000
1
bds
|
1
ba
|
650
sqft
|
built
1970
240 Collins Ave, Miami Beach, FL 33139
$-924
Cash flow
-9.5%
Cash-on-Cash Return
4.0%
Cap rate
0.8%
Rent to Value Ratio
Active
$7,595,000
6
bds
|
6
ba
|
6,530
sqft
|
built
2020
6175 SW 128th St, Pinecrest, FL 33156
$-40,624
Cash flow
-27.9%
Cash-on-Cash Return
-0.3%
Cap rate
0.1%
Rent to Value Ratio
Active
$425,000
1
bds
|
1
ba
|
440
sqft
|
built
1966
19201 Collins Ave, Sunny Isles Beach, FL 33160
$-2,351
Cash flow
-28.9%
Cash-on-Cash Return
-0.5%
Cap rate
0.7%
Rent to Value Ratio