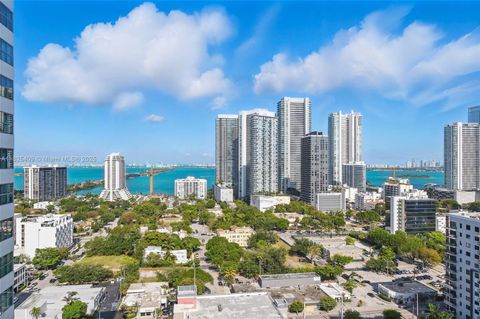
Miami Dade County Investment Properties for Sale
Browse homes for sale and investment properties in Miami Dade County. Refine your search by price, property type, or more.
Best cash flowing properties in Miami Dade County
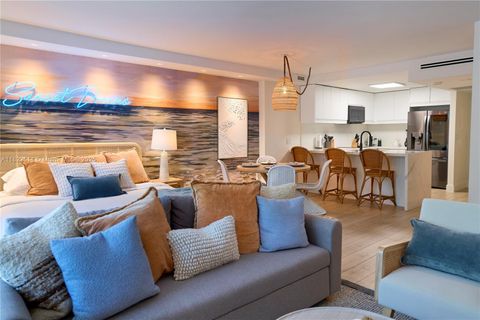
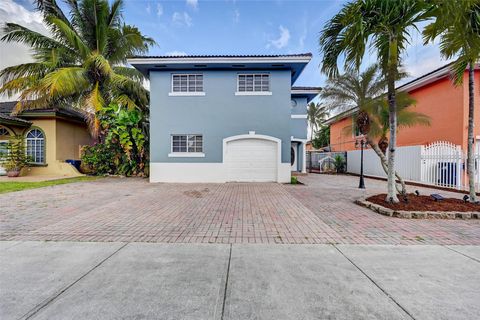
Active
$775,000
bds
|
1
ba
|
600
sqft
|
built
1926
2301 Collins Ave, Miami Beach, FL 33139
$262
Cash flow
1.8%
Cash-on-Cash Return
6.7%
Cap rate
1.2%
Rent to Value Ratio
Active
$155,000
2
bds
|
2
ba
|
800
sqft
|
built
1974
19715 SW 114th Ave, Miami, FL 33157
$-277
Cash flow
-9.3%
Cash-on-Cash Return
4.1%
Cap rate
1.2%
Rent to Value Ratio
10,000 out of 17,509 properties for sale in Miami Dade County
Limited Results Shown
Create a free account, or log in to reveal all property listings and enjoy the complete experience.
Active
$950,000
3
bds
|
3
ba
|
1,650
sqft
|
built
2005
3340 NE 190th St, Aventura, FL 33180
$-3,854
Cash flow
-21.2%
Cash-on-Cash Return
1.3%
Cap rate
0.5%
Rent to Value Ratio
Active
$155,000
2
bds
|
2
ba
|
800
sqft
|
built
1974
19715 SW 114th Ave, Miami, FL 33157
$-277
Cash flow
-9.3%
Cash-on-Cash Return
4.1%
Cap rate
1.2%
Rent to Value Ratio

Active
$680,000
3
bds
|
3
ba
|
1,872
sqft
|
built
2025
10321 NW 32nd Pl, Miami, FL 33147
$-1,626
Cash flow
-12.5%
Cash-on-Cash Return
3.4%
Cap rate
0.5%
Rent to Value Ratio
Active
$745,000
1
bds
|
2
ba
|
1,027
sqft
|
built
1972
11 Island Ave, Miami Beach, FL 33139
$-2,377
Cash flow
-16.6%
Cash-on-Cash Return
2.4%
Cap rate
0.5%
Rent to Value Ratio

Active
$1,275,000
3
bds
|
3
ba
|
1,930
sqft
|
built
2008
1111 SW 1st Ave, Miami, FL 33130
$-3,504
Cash flow
-14.3%
Cash-on-Cash Return
3.0%
Cap rate
0.8%
Rent to Value Ratio
Active
$540,000
3
bds
|
3
ba
|
1,574
sqft
|
built
2014
8880 W 35th Ct, Hialeah, FL 33018
$-1,006
Cash flow
-9.7%
Cash-on-Cash Return
3.9%
Cap rate
0.7%
Rent to Value Ratio
Active
$425,000
3
bds
|
2
ba
|
1,115
sqft
|
built
1986
6298 NW 170th Ln, Hialeah, FL 33015
$-1,050
Cash flow
-12.9%
Cash-on-Cash Return
3.2%
Cap rate
0.7%
Rent to Value Ratio
Active
$568,000
5
bds
|
2
ba
|
1,725
sqft
|
built
1968
14855 SW 297th Ter, Homestead, FL 33033
$-1,323
Cash flow
-12.2%
Cash-on-Cash Return
3.4%
Cap rate
0.6%
Rent to Value Ratio

Active
$1,290,000
4
bds
|
3
ba
|
2,138
sqft
|
built
1998
10989 NW 73rd Ter, Doral, FL 33178
$-2,828
Cash flow
-11.4%
Cash-on-Cash Return
3.5%
Cap rate
0.6%
Rent to Value Ratio
Active
$365,000
2
bds
|
2
ba
|
910
sqft
|
built
2003
7200 NW 114th Ave, Doral, FL 33178
$-1,078
Cash flow
-15.4%
Cash-on-Cash Return
2.6%
Cap rate
0.6%
Rent to Value Ratio

Active
$1,995,000
5
bds
|
3
ba
|
4,027
sqft
|
built
1986
17745 SW 83rd Ct, Palmetto Bay, FL 33157
$-7,300
Cash flow
-19.1%
Cash-on-Cash Return
1.8%
Cap rate
0.3%
Rent to Value Ratio

Active
$2,399,000
6
bds
|
7
ba
|
4,874
sqft
|
built
2016
10272 NW 75th Ter, Doral, FL 33178
$-8,145
Cash flow
-17.7%
Cash-on-Cash Return
2.1%
Cap rate
0.4%
Rent to Value Ratio

Active
$199,900
1
bds
|
1
ba
|
431
sqft
|
built
1951
8420 Byron Ave, Miami Beach, FL 33141
$-501
Cash flow
-13.1%
Cash-on-Cash Return
3.1%
Cap rate
0.9%
Rent to Value Ratio
Active
$530,000
2
bds
|
2
ba
|
1,114
sqft
|
built
2008
90 SW 3rd St, Miami, FL 33130
$-1,984
Cash flow
-19.5%
Cash-on-Cash Return
1.8%
Cap rate
0.8%
Rent to Value Ratio
Active
$530,000
2
bds
|
2
ba
|
1,310
sqft
|
built
1991
3640 Yacht Club Dr, Miami, FL 33180
$-596
Cash flow
-5.9%
Cash-on-Cash Return
4.9%
Cap rate
0.7%
Rent to Value Ratio
Active
$499,000
1
bds
|
1
ba
|
723
sqft
|
built
1966
1670 Lincoln Ct, Miami Beach, FL 33139
$-1,455
Cash flow
-15.2%
Cash-on-Cash Return
2.8%
Cap rate
0.8%
Rent to Value Ratio
Active
$335,000
1
bds
|
2
ba
|
912
sqft
|
built
1970
7135 Collins Ave, Miami Beach, FL 33141
$-1,452
Cash flow
-22.6%
Cash-on-Cash Return
1.1%
Cap rate
0.7%
Rent to Value Ratio

Active
$570,000
3
bds
|
2
ba
|
1,546
sqft
|
built
1987
11027 SW 148th Ct, Miami, FL 33196
$-1,111
Cash flow
-10.2%
Cash-on-Cash Return
3.9%
Cap rate
0.6%
Rent to Value Ratio

Active
$620,000
1
bds
|
1
ba
|
686
sqft
|
built
2004
110 Washington Ave, Miami Beach, FL 33139
$-2,111
Cash flow
-17.8%
Cash-on-Cash Return
2.2%
Cap rate
0.6%
Rent to Value Ratio
Active
$815,000
2
bds
|
2
ba
|
1,142
sqft
|
built
2008
3301 NE 1st Ave, Miami, FL 33137
$-3,186
Cash flow
-20.4%
Cash-on-Cash Return
1.6%
Cap rate
0.6%
Rent to Value Ratio
Active
$265,000
2
bds
|
2
ba
|
1,030
sqft
|
built
1981
8635 NW 8th St, Miami, FL 33126
$-299
Cash flow
-5.9%
Cash-on-Cash Return
4.9%
Cap rate
0.9%
Rent to Value Ratio
Active
$630,000
4
bds
|
2
ba
|
1,746
sqft
|
built
1959
10315 SW 42nd St, Miami, FL 33165
$-1,282
Cash flow
-10.6%
Cash-on-Cash Return
3.8%
Cap rate
0.6%
Rent to Value Ratio
Active
$749,000
3
bds
|
0
ba
|
1,776
sqft
|
built
1962
1041 NW 33rd Ave, Miami, FL 33125
$-1,667
Cash flow
-11.6%
Cash-on-Cash Return
3.6%
Cap rate
0.5%
Rent to Value Ratio
Active
$945,000
5
bds
|
3
ba
|
2,362
sqft
|
built
1998
14125 SW 167th Ter, Miami, FL 33177
$-4,765
Cash flow
-26.3%
Cash-on-Cash Return
0.2%
Cap rate
0.1%
Rent to Value Ratio
Active
$800,000
2
bds
|
2
ba
|
1,143
sqft
|
built
2015
460 NE 28th St, Miami, FL 33137
$-2,914
Cash flow
-19.0%
Cash-on-Cash Return
1.9%
Cap rate
0.7%
Rent to Value Ratio

Active
$595,000
1
bds
|
1
ba
|
779
sqft
|
built
2016
6620 Indian Creek Dr, Miami Beach, FL 33141
$-2,385
Cash flow
-20.9%
Cash-on-Cash Return
1.5%
Cap rate
0.6%
Rent to Value Ratio

Active
$495,000
3
bds
|
3
ba
|
1,651
sqft
|
built
2019
25041 SW 108th Ave, Homestead, FL 33032
$-1,500
Cash flow
-15.8%
Cash-on-Cash Return
2.5%
Cap rate
0.6%
Rent to Value Ratio
Active
$505,000
3
bds
|
2
ba
|
1,318
sqft
|
built
1979
12264 SW 263rd Ter, Homestead, FL 33032
$-1,135
Cash flow
-11.7%
Cash-on-Cash Return
3.5%
Cap rate
0.6%
Rent to Value Ratio
Active
$579,500
3
bds
|
2
ba
|
1,124
sqft
|
built
2021
8301 NW 41st St, Doral, FL 33166
$-2,205
Cash flow
-19.9%
Cash-on-Cash Return
1.6%
Cap rate
0.6%
Rent to Value Ratio
Active
$235,000
1
bds
|
1
ba
|
810
sqft
|
built
1972
5201 Geneva Way, Doral, FL 33166
$-531
Cash flow
-11.8%
Cash-on-Cash Return
3.4%
Cap rate
0.9%
Rent to Value Ratio
Active
$575,000
2
bds
|
1
ba
|
1,080
sqft
|
built
1952
890 E 52nd St, Hialeah, FL 33013
$-911
Cash flow
-8.3%
Cash-on-Cash Return
4.2%
Cap rate
0.5%
Rent to Value Ratio
Active
$349,999
3
bds
|
2
ba
|
921
sqft
|
built
1987
12922 SW 88th Ter, Miami, FL 33186
$-847
Cash flow
-12.6%
Cash-on-Cash Return
3.2%
Cap rate
0.7%
Rent to Value Ratio
Active
$270,000
2
bds
|
2
ba
|
837
sqft
|
built
1983
8095 NW 8th St, Miami, FL 33126
$-296
Cash flow
-5.7%
Cash-on-Cash Return
5.0%
Cap rate
0.7%
Rent to Value Ratio
Active
$775,000
bds
|
1
ba
|
600
sqft
|
built
1926
2301 Collins Ave, Miami Beach, FL 33139
$262
Cash flow
1.8%
Cash-on-Cash Return
6.7%
Cap rate
1.2%
Rent to Value Ratio
Active
$285,000
1
bds
|
1
ba
|
650
sqft
|
built
1952
1325 Meridian Ave, Miami Beach, FL 33139
$-891
Cash flow
-16.3%
Cash-on-Cash Return
2.5%
Cap rate
0.8%
Rent to Value Ratio

Active
$459,000
3
bds
|
2
ba
|
1,221
sqft
|
built
1984
18854 NW 65th Ct, Hialeah, FL 33015
$-876
Cash flow
-10.0%
Cash-on-Cash Return
3.9%
Cap rate
0.6%
Rent to Value Ratio

Active
$1,390,000
2
bds
|
3
ba
|
2,020
sqft
|
built
1993
16445 Collins Ave, Sunny Isles Beach, FL 33160
$-4,927
Cash flow
-18.5%
Cash-on-Cash Return
1.9%
Cap rate
0.6%
Rent to Value Ratio

Active
$5,000,000
5
bds
|
6
ba
|
4,695
sqft
|
built
2020
300 Sunny Isles Blvd, Sunny Isles Beach, FL 33160
$-29,435
Cash flow
-30.7%
Cash-on-Cash Return
-0.9%
Cap rate
0.2%
Rent to Value Ratio
Active
$220,000
1
bds
|
1
ba
|
536
sqft
|
built
1973
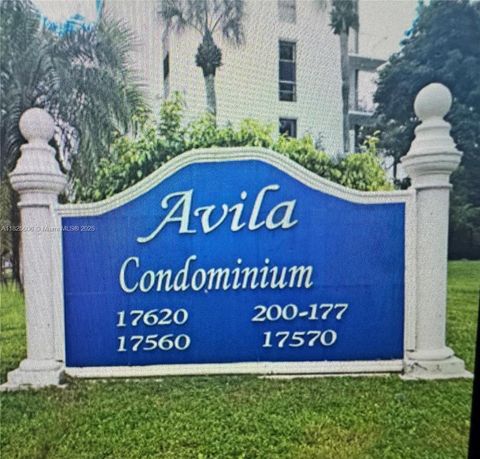
17620 Atlantic Blvd, Sunny Isles Beach, FL 33160
$-548
Cash flow
-13.0%
Cash-on-Cash Return
3.2%
Cap rate
0.8%
Rent to Value Ratio
Active
$925,000
3
bds
|
2
ba
|
1,924
sqft
|
built
1955
15345 SW 272nd St, Homestead, FL 33032
$-2,372
Cash flow
-13.4%
Cash-on-Cash Return
3.1%
Cap rate
0.5%
Rent to Value Ratio