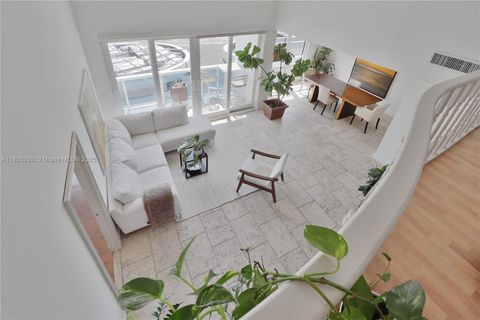
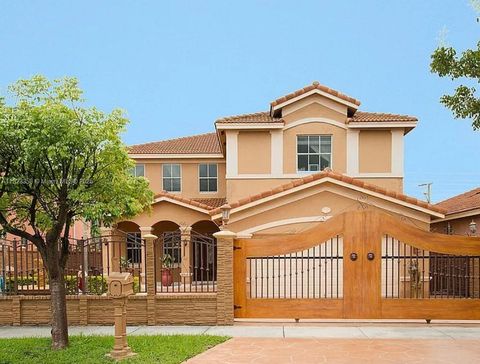
Miami Dade County Investment Properties for Sale
Browse homes for sale and investment properties in Miami Dade County. Refine your search by price, property type, or more.
Best cash flowing properties in Miami Dade County

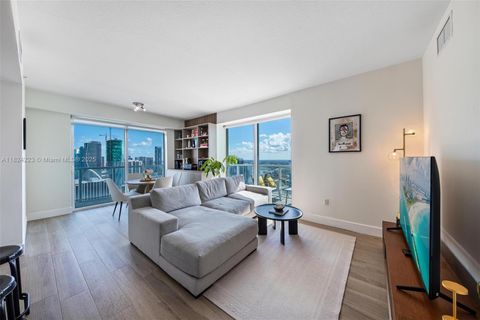
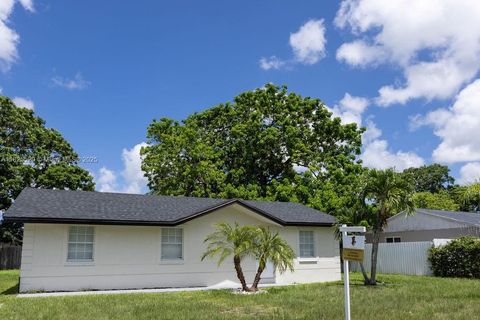
Active
$200,000
1
bds
|
2
ba
|
755
sqft
|
built
1974
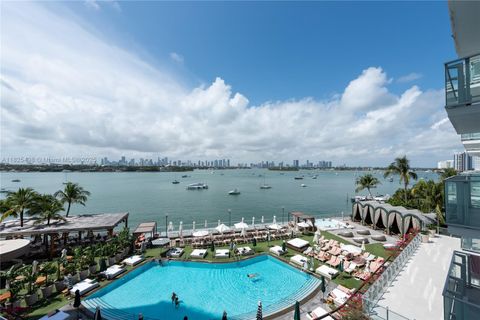
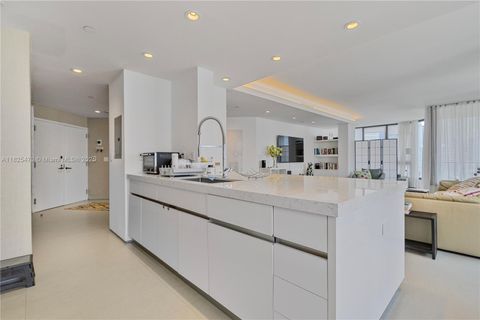
3625 N Country Club Dr, Aventura, FL 33180
$251
Cash flow
6.5%
Cash-on-Cash Return
7.6%
Cap rate
1.2%
Rent to Value Ratio

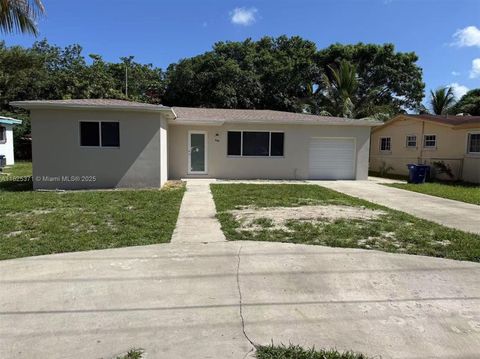
Active
$179,000
bds
|
1
ba
|
595
sqft
|
built
1971
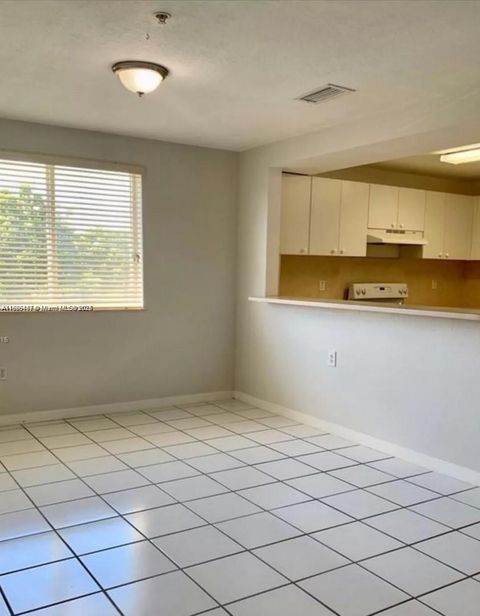
251 174th St, Sunny Isles Beach, FL 33160
$-109
Cash flow
-3.2%
Cash-on-Cash Return
5.4%
Cap rate
1.1%
Rent to Value Ratio
10,000 out of 17,483 properties for sale in Miami Dade County
Limited Results Shown
Create a free account, or log in to reveal all property listings and enjoy the complete experience.

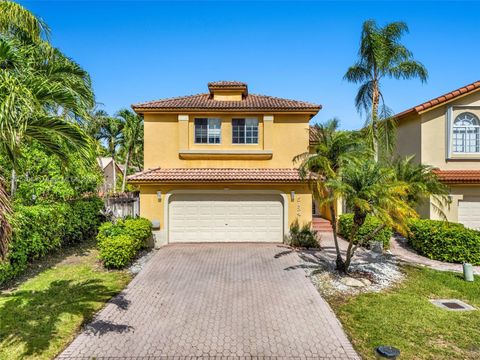
Active
$1,390,000
2
bds
|
3
ba
|
2,020
sqft
|
built
1993
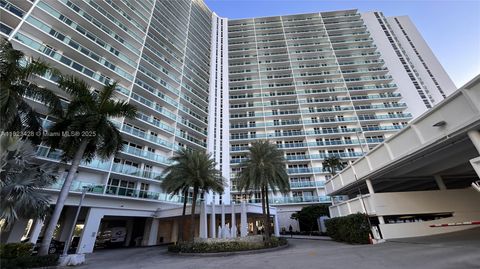
16445 Collins Ave, Sunny Isles Beach, FL 33160
$-4,927
Cash flow
-18.5%
Cash-on-Cash Return
1.9%
Cap rate
0.6%
Rent to Value Ratio
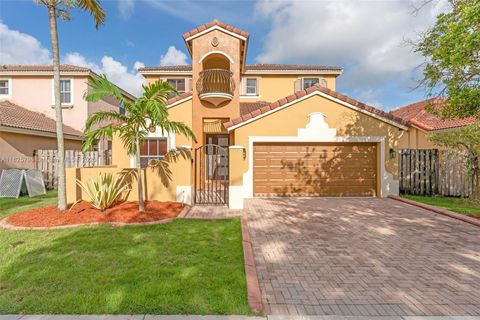
Active
$334,500
2
bds
|
2
ba
|
792
sqft
|
built
1974
8261 SW 128th St, Pinecrest, FL 33156
$-957
Cash flow
-14.9%
Cash-on-Cash Return
2.7%
Cap rate
0.7%
Rent to Value Ratio

Active
$1,268,000
3
bds
|
2
ba
|
1,562
sqft
|
built
1925
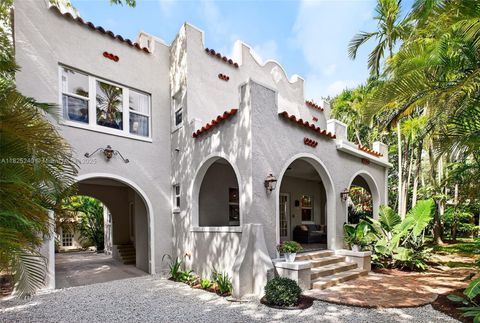
425 Cadagua Ave, Coral Gables, FL 33146
$-2,951
Cash flow
-12.1%
Cash-on-Cash Return
3.4%
Cap rate
0.4%
Rent to Value Ratio

Active
$10,995,000
6
bds
|
7
ba
|
6,999
sqft
|
built
2004
7415 SW 49th Pl, Miami, FL 33143
$-55,938
Cash flow
-26.5%
Cash-on-Cash Return
0.0%
Cap rate
0.1%
Rent to Value Ratio
Active
$365,000
3
bds
|
2
ba
|
1,275
sqft
|
built
1979
10010 NW 9th Street Cir, Miami, FL 33172
$-480
Cash flow
-6.9%
Cash-on-Cash Return
4.7%
Cap rate
0.8%
Rent to Value Ratio
Active
$324,900
2
bds
|
2
ba
|
1,235
sqft
|
built
1974
8401 SW 107th Ave, Miami, FL 33173
$-500
Cash flow
-8.0%
Cash-on-Cash Return
4.4%
Cap rate
0.9%
Rent to Value Ratio
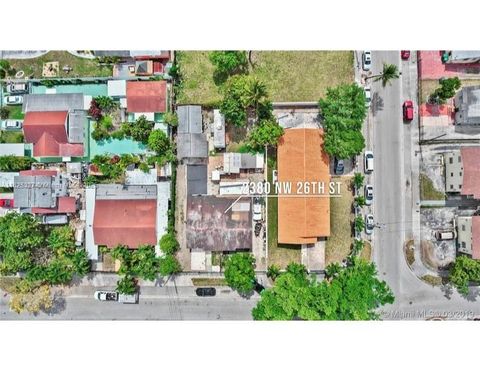
Active
$825,000
2
bds
|
0
ba
|
2,210
sqft
|
built
1959
2380 NW 26th St, Miami, FL 33142
$-3,854
Cash flow
-24.4%
Cash-on-Cash Return
0.7%
Cap rate
0.3%
Rent to Value Ratio
Active
$1,199,000
5
bds
|
3
ba
|
2,380
sqft
|
built
1999
14241 SW 30th St, Miami, FL 33175
$-2,477
Cash flow
-10.8%
Cash-on-Cash Return
3.8%
Cap rate
0.6%
Rent to Value Ratio
Active
$699,990
4
bds
|
3
ba
|
2,187
sqft
|
built
2018
23061 SW 114th Path, Miami, FL 33170
$-1,310
Cash flow
-9.8%
Cash-on-Cash Return
4.0%
Cap rate
0.6%
Rent to Value Ratio
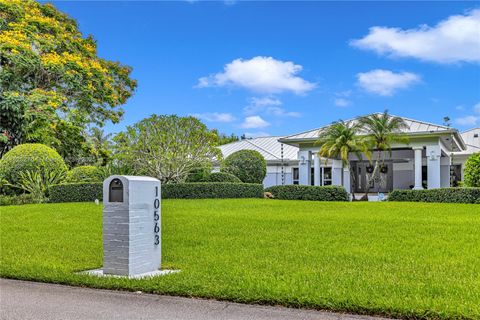
Active
$2,850,000
5
bds
|
5
ba
|
4,515
sqft
|
built
1989
10563 SW 92nd Ave, Miami, FL 33176
$-11,155
Cash flow
-20.4%
Cash-on-Cash Return
1.6%
Cap rate
0.3%
Rent to Value Ratio
Active
$265,000
2
bds
|
2
ba
|
1,170
sqft
|
built
1981
5800 SW 127th Ave, Miami, FL 33183
$-373
Cash flow
-7.3%
Cash-on-Cash Return
4.6%
Cap rate
0.9%
Rent to Value Ratio

Active
$5,200,000
6
bds
|
7
ba
|
4,429
sqft
|
built
1937
3748 Prairie Ave, Miami Beach, FL 33140
$-24,657
Cash flow
-24.7%
Cash-on-Cash Return
0.5%
Cap rate
0.2%
Rent to Value Ratio
Active
$200,000
1
bds
|
2
ba
|
755
sqft
|
built
1974
3625 N Country Club Dr, Aventura, FL 33180
$251
Cash flow
6.5%
Cash-on-Cash Return
7.6%
Cap rate
1.2%
Rent to Value Ratio
Active
$499,000
2
bds
|
2
ba
|
1,326
sqft
|
built
1968
6770 Indian Creek Dr, Miami Beach, FL 33141
$-2,070
Cash flow
-21.6%
Cash-on-Cash Return
1.2%
Cap rate
0.7%
Rent to Value Ratio
Active
$1,790,000
3
bds
|
4
ba
|
1,974
sqft
|
built
2010
15811 Collins Ave, Sunny Isles Beach, FL 33160
$-6,157
Cash flow
-17.9%
Cash-on-Cash Return
2.0%
Cap rate
0.5%
Rent to Value Ratio
Active
$525,000
2
bds
|
2
ba
|
1,217
sqft
|
built
1982
17878 N Bay Rd, Sunny Isles Beach, FL 33160
$-1,497
Cash flow
-14.9%
Cash-on-Cash Return
2.7%
Cap rate
0.7%
Rent to Value Ratio
Active
$1,000,000
4
bds
|
4
ba
|
2,826
sqft
|
built
2000
726 NW 136th Ave, Miami, FL 33182
$-2,279
Cash flow
-11.9%
Cash-on-Cash Return
3.5%
Cap rate
0.5%
Rent to Value Ratio
Active
$620,000
2
bds
|
2
ba
|
1,180
sqft
|
built
2008
1900 N Bayshore Dr, Miami, FL 33132
$-2,308
Cash flow
-19.4%
Cash-on-Cash Return
1.8%
Cap rate
0.6%
Rent to Value Ratio
Active
$625,000
4
bds
|
3
ba
|
2,528
sqft
|
built
1986
9510 SW 151st Ct, Miami, FL 33196
$-1,563
Cash flow
-13.0%
Cash-on-Cash Return
3.3%
Cap rate
0.6%
Rent to Value Ratio
Active
$615,000
1
bds
|
1
ba
|
699
sqft
|
built
2016
1300 S Miami Ave, Miami, FL 33130
$-2,114
Cash flow
-17.9%
Cash-on-Cash Return
2.1%
Cap rate
0.7%
Rent to Value Ratio
Active
$1,595,000
3
bds
|
2
ba
|
1,402
sqft
|
built
1940
3020 SW 2nd Ave, Miami, FL 33129
$-4,539
Cash flow
-14.8%
Cash-on-Cash Return
2.8%
Cap rate
0.5%
Rent to Value Ratio
Active
$799,000
2
bds
|
2
ba
|
1,320
sqft
|
built
2007
19900 E Country Club Dr, Aventura, FL 33180
$-3,334
Cash flow
-21.8%
Cash-on-Cash Return
1.1%
Cap rate
0.5%
Rent to Value Ratio
Active
$649,000
2
bds
|
2
ba
|
890
sqft
|
built
1982
2555 Collins Ave, Miami Beach, FL 33140
$-2,440
Cash flow
-19.6%
Cash-on-Cash Return
1.6%
Cap rate
0.6%
Rent to Value Ratio

Active
$9,900,000
4
bds
|
4
ba
|
4,723
sqft
|
built
1996
300 S Pointe Dr, Miami Beach, FL 33139
$-58,336
Cash flow
-30.7%
Cash-on-Cash Return
-0.9%
Cap rate
0.1%
Rent to Value Ratio
Active
$470,000
2
bds
|
2
ba
|
1,244
sqft
|
built
2016
7825 NW 107th Ave, Doral, FL 33178
$-1,927
Cash flow
-21.4%
Cash-on-Cash Return
1.2%
Cap rate
0.6%
Rent to Value Ratio
Active
$289,000
2
bds
|
2
ba
|
831
sqft
|
built
1996
616 NW 26th Ave, Miami, FL 33125
$-307
Cash flow
-5.5%
Cash-on-Cash Return
4.9%
Cap rate
0.9%
Rent to Value Ratio
Active
$399,000
bds
|
0
ba
|
477
sqft
|
built
2008
1100 West Ave, Miami Beach, FL 33139
$-1,782
Cash flow
-23.3%
Cash-on-Cash Return
0.8%
Cap rate
0.8%
Rent to Value Ratio
Active
$850,000
4
bds
|
3
ba
|
2,154
sqft
|
built
1997
5134 NW 113th Ave, Doral, FL 33178
$-2,350
Cash flow
-14.4%
Cash-on-Cash Return
2.8%
Cap rate
0.5%
Rent to Value Ratio
Active
$252,000
1
bds
|
1
ba
|
553
sqft
|
built
2007
219 NW 12th Ave, Miami, FL 33128
$-550
Cash flow
-11.4%
Cash-on-Cash Return
3.6%
Cap rate
0.8%
Rent to Value Ratio
Active
$599,000
5
bds
|
3
ba
|
3,129
sqft
|
built
2006
452 NE 20th Ter, Homestead, FL 33033
$-1,153
Cash flow
-10.0%
Cash-on-Cash Return
3.8%
Cap rate
0.6%
Rent to Value Ratio
Active
$499,990
3
bds
|
2
ba
|
1,260
sqft
|
built
1974
355 SW 17th Ave, Homestead, FL 33030
$-681
Cash flow
-7.1%
Cash-on-Cash Return
4.5%
Cap rate
0.6%
Rent to Value Ratio
Active
$318,000
1
bds
|
2
ba
|
991
sqft
|
built
1975
100 Bayview Dr, Sunny Isles Beach, FL 33160
$-1,194
Cash flow
-19.6%
Cash-on-Cash Return
1.6%
Cap rate
0.8%
Rent to Value Ratio
Active
$499,000
2
bds
|
2
ba
|
1,295
sqft
|
built
1964
366 NE 163rd St, Miami, FL 33162
$-587
Cash flow
-6.1%
Cash-on-Cash Return
4.9%
Cap rate
0.6%
Rent to Value Ratio
Active
$3,300,000
4
bds
|
4
ba
|
3,117
sqft
|
built
1926
58 NE 44th St, Miami, FL 33137
$-12,688
Cash flow
-20.1%
Cash-on-Cash Return
1.7%
Cap rate
0.3%
Rent to Value Ratio
Active
$1,200,000
3
bds
|
3
ba
|
1,890
sqft
|
built
1982
520 Brickell Key Dr, Miami, FL 33131
$-4,422
Cash flow
-19.2%
Cash-on-Cash Return
1.8%
Cap rate
0.7%
Rent to Value Ratio
Active
$325,988
2
bds
|
2
ba
|
1,043
sqft
|
built
2006
1627 NW 18th St, Miami, FL 33125
$-734
Cash flow
-11.7%
Cash-on-Cash Return
3.6%
Cap rate
0.8%
Rent to Value Ratio
Active
$395,000
3
bds
|
3
ba
|
1,884
sqft
|
built
2008
2346 SE 16th Ter, Homestead, FL 33035
$-853
Cash flow
-11.3%
Cash-on-Cash Return
3.6%
Cap rate
0.7%
Rent to Value Ratio
Active
$179,000
bds
|
1
ba
|
595
sqft
|
built
1971
251 174th St, Sunny Isles Beach, FL 33160
$-109
Cash flow
-3.2%
Cash-on-Cash Return
5.4%
Cap rate
1.1%
Rent to Value Ratio
Active
$1,580,000
4
bds
|
3
ba
|
2,857
sqft
|
built
1939
1344 SW 18th St, Miami, FL 33145
$-5,447
Cash flow
-18.0%
Cash-on-Cash Return
2.1%
Cap rate
0.3%
Rent to Value Ratio

Active
$1,499,000
4
bds
|
4
ba
|
1,837
sqft
|
built
1974
17975 SW 232nd St, Miami, FL 33170
$-5,784
Cash flow
-20.1%
Cash-on-Cash Return
1.6%
Cap rate
0.3%
Rent to Value Ratio