Miami Dade County Investment Properties for Sale
Browse homes for sale and investment properties in Miami Dade County. Refine your search by price, property type, or more.
Best cash flowing properties in Miami Dade County
Active
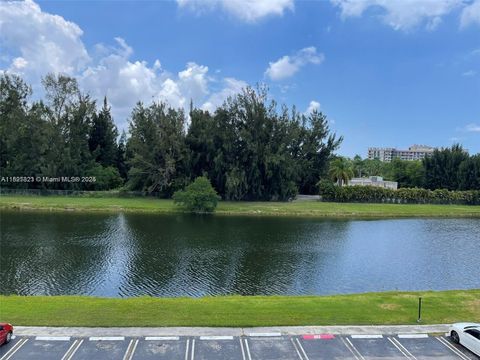
$155,000
1
bds
|
1
ba
|
658
sqft
|
built
1971
16465 NE 22nd Ave, North Miami Beach, FL 33160
$-261
Cash flow
-8.8%
Cash-on-Cash Return
4.1%
Cap rate
1.2%
Rent to Value Ratio
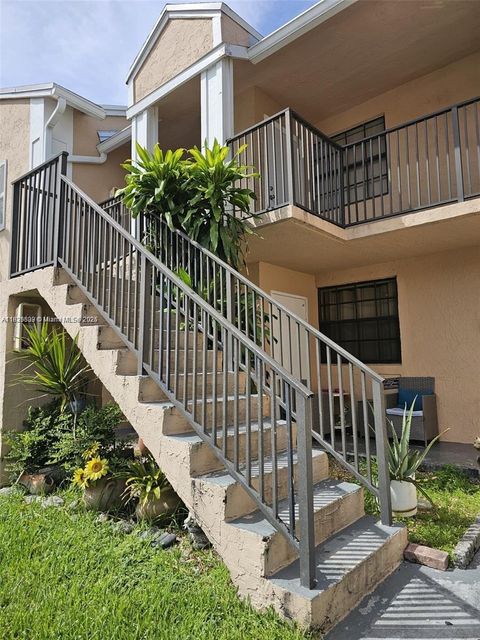
Active
$226,900
2
bds
|
2
ba
|
960
sqft
|
built
1986
1002 Adams Ave, Homestead, FL 33034
$-313
Cash flow
-7.2%
Cash-on-Cash Return
4.5%
Cap rate
1.0%
Rent to Value Ratio
10,000 out of 17,484 properties for sale in Miami Dade County
Limited Results Shown
Create a free account, or log in to reveal all property listings and enjoy the complete experience.
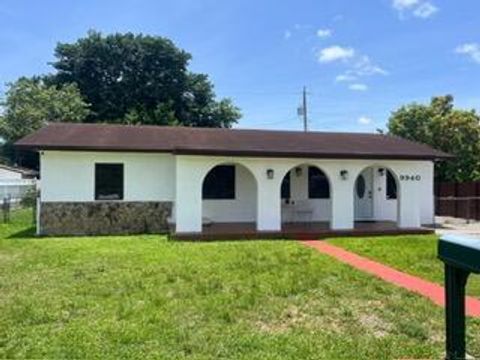
Active
$699,000
5
bds
|
2
ba
|
2,130
sqft
|
built
1952
9940 SW 48th St, Miami, FL 33165
$-1,692
Cash flow
-12.6%
Cash-on-Cash Return
3.4%
Cap rate
0.5%
Rent to Value Ratio
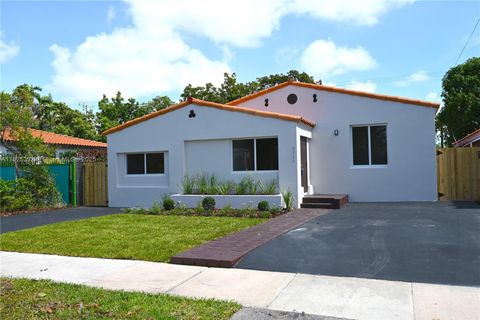
Active
$879,000
3
bds
|
2
ba
|
1,392
sqft
|
built
1939
2949 SW 14th St, Miami, FL 33145
$-2,110
Cash flow
-12.5%
Cash-on-Cash Return
3.4%
Cap rate
0.4%
Rent to Value Ratio
Active
$749,000
2
bds
|
3
ba
|
1,002
sqft
|
built
2017
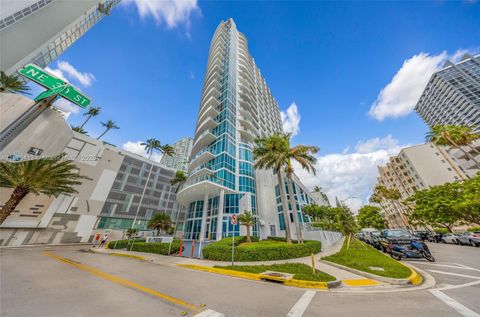
2900 NE 7th Ave, Miami, FL 33137
$-2,990
Cash flow
-20.8%
Cash-on-Cash Return
1.5%
Cap rate
0.7%
Rent to Value Ratio
Active
$640,000
4
bds
|
0
ba
|
2,112
sqft
|
built
1947
1860 NW 45th St, Miami, FL 33142
$-2,724
Cash flow
-22.2%
Cash-on-Cash Return
1.2%
Cap rate
0.3%
Rent to Value Ratio

Active
$435,000
2
bds
|
2
ba
|
980
sqft
|
built
1967
5401 Collins Ave, Miami Beach, FL 33140
$-1,802
Cash flow
-21.6%
Cash-on-Cash Return
1.3%
Cap rate
0.8%
Rent to Value Ratio
Active
$825,000
5
bds
|
3
ba
|
1,881
sqft
|
built
1986
8931 SW 5th St, Miami, FL 33174
$-2,034
Cash flow
-12.9%
Cash-on-Cash Return
3.3%
Cap rate
0.5%
Rent to Value Ratio

Active
$1,499,000
4
bds
|
4
ba
|
1,837
sqft
|
built
1974
17975 SW 232nd St, Miami, FL 33170
$-5,784
Cash flow
-20.1%
Cash-on-Cash Return
1.6%
Cap rate
0.3%
Rent to Value Ratio
Active
$1,580,000
4
bds
|
3
ba
|
2,857
sqft
|
built
1939
1344 SW 18th St, Miami, FL 33145
$-5,447
Cash flow
-18.0%
Cash-on-Cash Return
2.1%
Cap rate
0.3%
Rent to Value Ratio
Active
$279,000
1
bds
|
2
ba
|
755
sqft
|
built
1974
3625 N Country Club Dr, Aventura, FL 33180
$-847
Cash flow
-15.8%
Cash-on-Cash Return
2.5%
Cap rate
0.8%
Rent to Value Ratio
Active
$575,000
2
bds
|
2
ba
|
1,521
sqft
|
built
1975
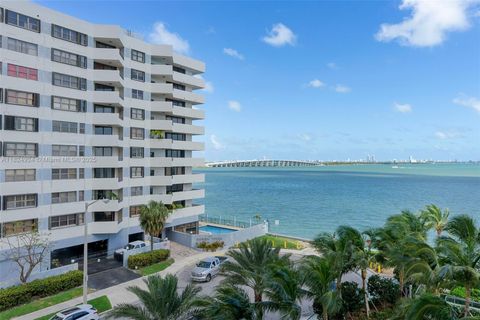
100 Bayview Dr, Sunny Isles Beach, FL 33160
$-2,078
Cash flow
-18.9%
Cash-on-Cash Return
1.8%
Cap rate
0.7%
Rent to Value Ratio

Active
$1,279,000
1
bds
|
2
ba
|
862
sqft
|
built
2008
17001 Collins Ave, Sunny Isles Beach, FL 33160
$-5,116
Cash flow
-20.9%
Cash-on-Cash Return
1.3%
Cap rate
0.5%
Rent to Value Ratio

Active
$678,999
4
bds
|
3
ba
|
2,580
sqft
|
built
1996
2575 Muirfield Ter, Homestead, FL 33035
$-1,652
Cash flow
-12.7%
Cash-on-Cash Return
3.2%
Cap rate
0.7%
Rent to Value Ratio
Active
$155,000
1
bds
|
1
ba
|
658
sqft
|
built
1971
16465 NE 22nd Ave, North Miami Beach, FL 33160
$-261
Cash flow
-8.8%
Cash-on-Cash Return
4.1%
Cap rate
1.2%
Rent to Value Ratio

Active
$495,000
3
bds
|
2
ba
|
0
sqft
|
built
1938
2250 NW 95th Ter, Miami, FL 33147
$-1,520
Cash flow
-16.0%
Cash-on-Cash Return
2.6%
Cap rate
0.4%
Rent to Value Ratio
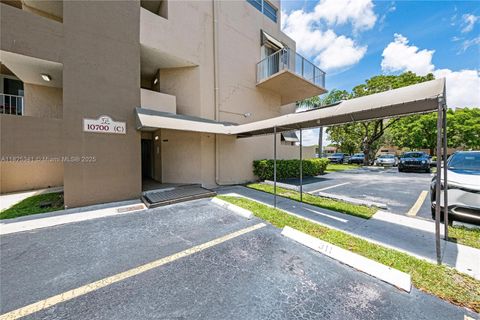
Active
$335,000
3
bds
|
3
ba
|
1,190
sqft
|
built
1971
10700 SW 108th Ave, Miami, FL 33176
$-857
Cash flow
-13.3%
Cash-on-Cash Return
3.2%
Cap rate
0.7%
Rent to Value Ratio

Active
$570,000
6
bds
|
2
ba
|
1,795
sqft
|
built
1938
1051 NW 63rd St, Miami, FL 33150
$-1,358
Cash flow
-12.4%
Cash-on-Cash Return
3.4%
Cap rate
0.5%
Rent to Value Ratio
Active
$535,000
2
bds
|
2
ba
|
929
sqft
|
built
2008
244 Biscayne Blvd, Miami, FL 33132
$-2,067
Cash flow
-20.2%
Cash-on-Cash Return
1.6%
Cap rate
0.7%
Rent to Value Ratio
Active
$499,000
1
bds
|
1
ba
|
790
sqft
|
built
2007
3339 Virginia St, Miami, FL 33133
$-1,729
Cash flow
-18.1%
Cash-on-Cash Return
2.1%
Cap rate
0.6%
Rent to Value Ratio
Active
$629,000
4
bds
|
3
ba
|
1,220
sqft
|
built
1949
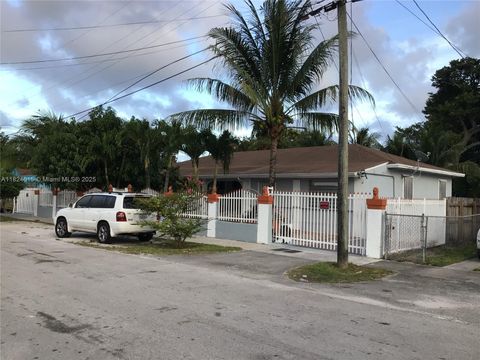
217 E 20th St, Hialeah, FL 33010
$-1,603
Cash flow
-13.3%
Cash-on-Cash Return
3.1%
Cap rate
0.5%
Rent to Value Ratio
Active
$259,000
2
bds
|
1
ba
|
960
sqft
|
built
1974
1630 W 46th St, Hialeah, FL 33012
$-432
Cash flow
-8.7%
Cash-on-Cash Return
4.1%
Cap rate
0.8%
Rent to Value Ratio
Active
$226,900
2
bds
|
2
ba
|
960
sqft
|
built
1986
1002 Adams Ave, Homestead, FL 33034
$-313
Cash flow
-7.2%
Cash-on-Cash Return
4.5%
Cap rate
1.0%
Rent to Value Ratio
Active
$620,000
3
bds
|
2
ba
|
1,876
sqft
|
built
2007
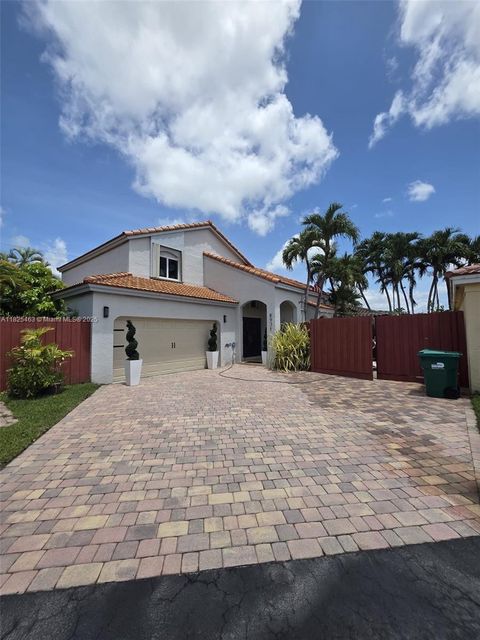
3457 NE 2nd St, Homestead, FL 33033
$-1,581
Cash flow
-13.3%
Cash-on-Cash Return
3.1%
Cap rate
0.5%
Rent to Value Ratio

Active
$2,300,000
2
bds
|
2
ba
|
1,530
sqft
|
built
2000
4779 Collins Ave, Miami Beach, FL 33140
$-10,410
Cash flow
-23.6%
Cash-on-Cash Return
0.7%
Cap rate
0.3%
Rent to Value Ratio

Active
$389,000
1
bds
|
2
ba
|
910
sqft
|
built
1968
6770 Indian Creek Dr, Miami Beach, FL 33141
$-1,193
Cash flow
-16.0%
Cash-on-Cash Return
2.5%
Cap rate
0.8%
Rent to Value Ratio

Active
$650,000
4
bds
|
3
ba
|
1,378
sqft
|
built
1950
359 E 46th St, Hialeah, FL 33013
$-1,872
Cash flow
-15.0%
Cash-on-Cash Return
2.7%
Cap rate
0.5%
Rent to Value Ratio

Active
$995,000
3
bds
|
2
ba
|
1,236
sqft
|
built
2003
9201 Collins Ave, Surfside, FL 33154
$-3,731
Cash flow
-19.6%
Cash-on-Cash Return
1.6%
Cap rate
0.5%
Rent to Value Ratio
Active
$479,999
1
bds
|
2
ba
|
828
sqft
|
built
2006
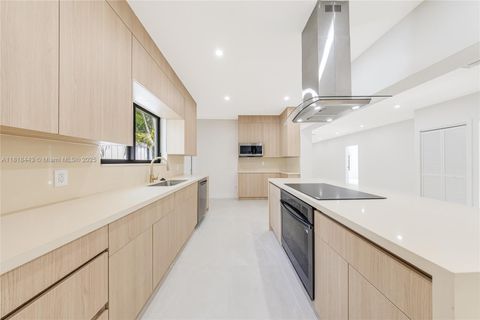
480 NE 30th St, Miami, FL 33137
$-1,207
Cash flow
-13.1%
Cash-on-Cash Return
3.2%
Cap rate
0.7%
Rent to Value Ratio
Active
$440,000
2
bds
|
2
ba
|
1,114
sqft
|
built
2007
8390 SW 72nd Ave, Miami, FL 33143
$-1,960
Cash flow
-23.2%
Cash-on-Cash Return
0.9%
Cap rate
0.7%
Rent to Value Ratio
Active
$650,000
2
bds
|
2
ba
|
1,069
sqft
|
built
2004
1250 S Miami Ave, Miami, FL 33130
$-2,866
Cash flow
-23.0%
Cash-on-Cash Return
1.0%
Cap rate
0.5%
Rent to Value Ratio

Active
$1,290,000
3
bds
|
3
ba
|
1,734
sqft
|
built
1938
443 SW 18th Rd, Miami, FL 33129
$-2,316
Cash flow
-9.4%
Cash-on-Cash Return
4.1%
Cap rate
0.5%
Rent to Value Ratio
Active
$560,000
2
bds
|
3
ba
|
1,630
sqft
|
built
1977
3538 Estepona Ave, Doral, FL 33178
$-2,012
Cash flow
-18.7%
Cash-on-Cash Return
1.8%
Cap rate
0.6%
Rent to Value Ratio

Active
$600,000
3
bds
|
3
ba
|
1,683
sqft
|
built
2006
8081 NW 107th Ct, Doral, FL 33178
$-1,364
Cash flow
-11.9%
Cash-on-Cash Return
3.4%
Cap rate
0.6%
Rent to Value Ratio
Active
$475,000
3
bds
|
1
ba
|
920
sqft
|
built
1963
10861 SW 222nd St, Miami, FL 33170
$-976
Cash flow
-10.7%
Cash-on-Cash Return
3.7%
Cap rate
0.6%
Rent to Value Ratio
Active
$475,000
3
bds
|
3
ba
|
1,772
sqft
|
built
2022
25564 SW 108th Ave, Homestead, FL 33032
$-1,243
Cash flow
-13.7%
Cash-on-Cash Return
3.0%
Cap rate
0.6%
Rent to Value Ratio
Active
$610,000
4
bds
|
2
ba
|
1,402
sqft
|
built
1956
3610 NW 171st St, Miami Gardens, FL 33056
$-1,141
Cash flow
-9.8%
Cash-on-Cash Return
3.9%
Cap rate
0.5%
Rent to Value Ratio
Active
$349,000
1
bds
|
2
ba
|
785
sqft
|
built
1969
1020 Meridian Ave, Miami Beach, FL 33139
$-842
Cash flow
-12.6%
Cash-on-Cash Return
3.3%
Cap rate
0.8%
Rent to Value Ratio
Active
$765,000
2
bds
|
2
ba
|
1,095
sqft
|
built
2015
460 NE 28th St, Miami, FL 33137
$-3,755
Cash flow
-25.6%
Cash-on-Cash Return
0.4%
Cap rate
0.6%
Rent to Value Ratio
Active
$1,850,000
5
bds
|
0
ba
|
3,470
sqft
|
built
1925
829 SW 19th Ave, Miami, FL 33135
$-8,049
Cash flow
-22.7%
Cash-on-Cash Return
1.0%
Cap rate
0.2%
Rent to Value Ratio

Active
$1,290,000
10
bds
|
0
ba
|
4,460
sqft
|
built
1963
925 NW 69th St, Miami, FL 33150
$-6,090
Cash flow
-24.6%
Cash-on-Cash Return
0.6%
Cap rate
0.2%
Rent to Value Ratio

Active
$659,000
5
bds
|
2
ba
|
1,646
sqft
|
built
1991
18325 SW 114th Ct, Miami, FL 33157
$-1,460
Cash flow
-11.6%
Cash-on-Cash Return
3.6%
Cap rate
0.5%
Rent to Value Ratio