Miami Dade County Investment Properties for Sale
Browse homes for sale and investment properties in Miami Dade County. Refine your search by price, property type, or more.
Best cash flowing properties in Miami Dade County
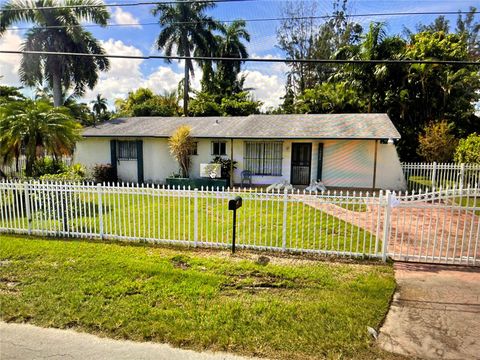
Active
$160,000
1
bds
|
2
ba
|
846
sqft
|
built
1967
18707 NE 14th Ave, Miami, FL 33179
$205
Cash flow
6.7%
Cash-on-Cash Return
7.7%
Cap rate
1.3%
Rent to Value Ratio

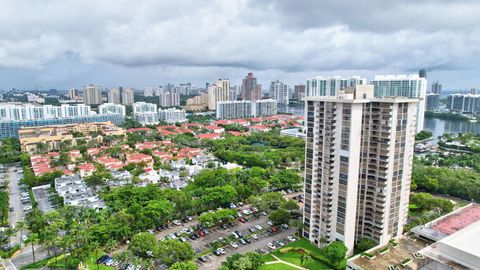
Active
$465,000
2
bds
|
2
ba
|
1,178
sqft
|
built
1930
2320 NW 55th St, Miami, FL 33142
$-101
Cash flow
-1.1%
Cash-on-Cash Return
5.9%
Cap rate
0.8%
Rent to Value Ratio
10,000 out of 12,464 properties for sale in Miami Dade County
Limited Results Shown
Create a free account, or log in to reveal all property listings and enjoy the complete experience.
Active
$739,000
2
bds
|
3
ba
|
1,340
sqft
|
built
2010
92 SW 3rd St, Miami, FL 33130
$-2,700
Cash flow
-19.1%
Cash-on-Cash Return
1.8%
Cap rate
0.7%
Rent to Value Ratio

Active
$3,079,000
5
bds
|
3
ba
|
2,264
sqft
|
built
1937
6080 Alton Rd, Miami Beach, FL 33140
$-11,976
Cash flow
-20.3%
Cash-on-Cash Return
1.5%
Cap rate
0.3%
Rent to Value Ratio
Active
$224,000
2
bds
|
2
ba
|
1,172
sqft
|
built
1973
661 NE 195th St, Miami, FL 33179
$-404
Cash flow
-9.4%
Cash-on-Cash Return
4.0%
Cap rate
1.0%
Rent to Value Ratio
Active
$325,000
1
bds
|
1
ba
|
757
sqft
|
built
2002
50 Menores Ave, Coral Gables, FL 33134
$-954
Cash flow
-15.3%
Cash-on-Cash Return
2.6%
Cap rate
0.8%
Rent to Value Ratio

Active
$1,279,000
1
bds
|
1
ba
|
1,066
sqft
|
built
2005
4401 Collins Ave, Miami Beach, FL 33140
$-4,185
Cash flow
-17.1%
Cash-on-Cash Return
2.2%
Cap rate
0.6%
Rent to Value Ratio
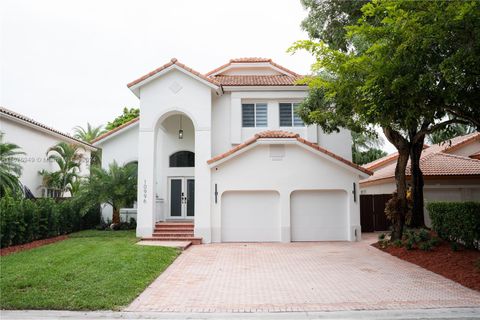
Active
$1,485,000
4
bds
|
3
ba
|
2,401
sqft
|
built
1997
10996 NW 58th Ter, Doral, FL 33178
$-4,760
Cash flow
-16.7%
Cash-on-Cash Return
2.3%
Cap rate
0.4%
Rent to Value Ratio

Active
$690,000
4
bds
|
2
ba
|
2,059
sqft
|
built
1958
19021 NW 12th Ct, Miami Gardens, FL 33169
$-1,791
Cash flow
-13.5%
Cash-on-Cash Return
3.0%
Cap rate
0.5%
Rent to Value Ratio
Active
$629,000
1
bds
|
2
ba
|
851
sqft
|
built
2017
55 SW 9th St, Miami, FL 33130
$-2,631
Cash flow
-21.8%
Cash-on-Cash Return
1.1%
Cap rate
0.6%
Rent to Value Ratio
Active
$1,250,000
3
bds
|
4
ba
|
1,470
sqft
|
built
2016
1010 SW 2nd Ave, Miami, FL 33130
$-5,039
Cash flow
-21.0%
Cash-on-Cash Return
1.3%
Cap rate
0.5%
Rent to Value Ratio
Active
$570,000
2
bds
|
2
ba
|
1,172
sqft
|
built
2008
90 SW 3rd St, Miami, FL 33130
$-1,670
Cash flow
-15.3%
Cash-on-Cash Return
2.6%
Cap rate
0.8%
Rent to Value Ratio

Active
$320,000
2
bds
|
2
ba
|
930
sqft
|
built
2000
8100 W 28th Ct, Hialeah, FL 33018
$-185
Cash flow
-3.0%
Cash-on-Cash Return
5.5%
Cap rate
0.8%
Rent to Value Ratio

Active
$419,000
2
bds
|
2
ba
|
1,290
sqft
|
built
2007
3001 NE 185th St, Aventura, FL 33180
$-1,612
Cash flow
-20.1%
Cash-on-Cash Return
1.5%
Cap rate
0.8%
Rent to Value Ratio
Active
$529,000
1
bds
|
1
ba
|
672
sqft
|
built
1965
1732 Meridian Ave, Miami Beach, FL 33139
$-1,458
Cash flow
-14.4%
Cash-on-Cash Return
2.8%
Cap rate
0.6%
Rent to Value Ratio
Active
$820,000
2
bds
|
0
ba
|
1,640
sqft
|
built
1941
15 NE 70th St, Miami, FL 33138
$-3,023
Cash flow
-19.2%
Cash-on-Cash Return
1.7%
Cap rate
0.3%
Rent to Value Ratio
Active
$520,000
2
bds
|
2
ba
|
1,180
sqft
|
built
1994
19877 E Country Club Dr, Aventura, FL 33180
$-1,489
Cash flow
-14.9%
Cash-on-Cash Return
2.7%
Cap rate
0.7%
Rent to Value Ratio
Active
$1,100,000
2
bds
|
2
ba
|
1,423
sqft
|
built
2006
16699 Collins Ave, Sunny Isles Beach, FL 33160
$-3,043
Cash flow
-14.4%
Cash-on-Cash Return
2.8%
Cap rate
0.7%
Rent to Value Ratio
Active
$479,000
3
bds
|
2
ba
|
1,460
sqft
|
built
1994
9755 NW 52nd St, Doral, FL 33178
$-1,437
Cash flow
-15.7%
Cash-on-Cash Return
2.5%
Cap rate
0.8%
Rent to Value Ratio
Active
$5,995,000
5
bds
|
5
ba
|
4,084
sqft
|
built
1947
5735 N Bay Rd, Miami Beach, FL 33140
$-31,708
Cash flow
-27.6%
Cash-on-Cash Return
-0.2%
Cap rate
0.2%
Rent to Value Ratio
Active
$2,150,000
5
bds
|
3
ba
|
2,755
sqft
|
built
1967
11420 SW 80th Rd, Pinecrest, FL 33156
$-6,068
Cash flow
-14.7%
Cash-on-Cash Return
2.8%
Cap rate
0.5%
Rent to Value Ratio
Active
$360,000
2
bds
|
1
ba
|
635
sqft
|
built
1941
811 Jefferson Ave, Miami Beach, FL 33139
$-1,335
Cash flow
-19.3%
Cash-on-Cash Return
1.7%
Cap rate
0.7%
Rent to Value Ratio
Active
$505,000
2
bds
|
2
ba
|
1,560
sqft
|
built
1984
20281 E Country Club Dr, Aventura, FL 33180
$-2,706
Cash flow
-28.0%
Cash-on-Cash Return
-0.3%
Cap rate
0.8%
Rent to Value Ratio
Active
$699,000
2
bds
|
2
ba
|
1,095
sqft
|
built
2015
460 NE 28th St, Miami, FL 33137
$-1,829
Cash flow
-13.7%
Cash-on-Cash Return
3.0%
Cap rate
0.8%
Rent to Value Ratio
Active
$995,000
2
bds
|
3
ba
|
1,370
sqft
|
built
2016
88 SW 7th St, Miami, FL 33130
$-3,961
Cash flow
-20.8%
Cash-on-Cash Return
1.4%
Cap rate
0.7%
Rent to Value Ratio
Active
$431,000
2
bds
|
2
ba
|
1,030
sqft
|
built
1987
7601 E Treasure Dr, North Bay Village, FL 33141
$-1,334
Cash flow
-16.1%
Cash-on-Cash Return
2.4%
Cap rate
0.7%
Rent to Value Ratio

Active
$900,000
3
bds
|
2
ba
|
1,479
sqft
|
built
1949
156 NW 88th St, El Portal, FL 33150
$-1,527
Cash flow
-8.9%
Cash-on-Cash Return
4.1%
Cap rate
0.7%
Rent to Value Ratio
Active
$290,000
2
bds
|
2
ba
|
1,106
sqft
|
built
1994
18870 NW 57th Ave, Hialeah, FL 33015
$-488
Cash flow
-8.8%
Cash-on-Cash Return
4.1%
Cap rate
0.9%
Rent to Value Ratio

Active
$4,950,000
3
bds
|
6
ba
|
2,468
sqft
|
built
2019
18975 Collins Ave, Sunny Isles Beach, FL 33160
$-27,063
Cash flow
-28.5%
Cash-on-Cash Return
-0.4%
Cap rate
0.2%
Rent to Value Ratio

Active
$224,900
1
bds
|
2
ba
|
1,005
sqft
|
built
1971
18071 Biscayne Blvd, Aventura, FL 33160
$-875
Cash flow
-20.3%
Cash-on-Cash Return
1.5%
Cap rate
1.0%
Rent to Value Ratio
Active
$898,000
4
bds
|
0
ba
|
2,704
sqft
|
built
1920
1838 NW 1st St, Miami, FL 33125
$-3,774
Cash flow
-21.9%
Cash-on-Cash Return
1.1%
Cap rate
0.3%
Rent to Value Ratio

Active
$230,000
1
bds
|
1
ba
|
588
sqft
|
built
1989
15551 SW 104th Ter, Miami, FL 33196
$-352
Cash flow
-8.0%
Cash-on-Cash Return
4.3%
Cap rate
0.8%
Rent to Value Ratio
Active
$1,150,000
2
bds
|
3
ba
|
1,558
sqft
|
built
2005
901 Brickell Key Blvd, Miami, FL 33131
$-3,950
Cash flow
-17.9%
Cash-on-Cash Return
2.0%
Cap rate
0.6%
Rent to Value Ratio
Active
$849,000
2
bds
|
2
ba
|
1,288
sqft
|
built
2011
2155 Washington Ct, Miami Beach, FL 33139
$-2,809
Cash flow
-17.3%
Cash-on-Cash Return
2.2%
Cap rate
0.8%
Rent to Value Ratio
Active
$555,000
1
bds
|
2
ba
|
845
sqft
|
built
2008
888 Biscayne Blvd, Miami, FL 33132
$-1,843
Cash flow
-17.3%
Cash-on-Cash Return
2.2%
Cap rate
0.6%
Rent to Value Ratio
Active
$775,000
1
bds
|
2
ba
|
1,294
sqft
|
built
2019
851 NE 1st Ave, Miami, FL 33132
$-1,982
Cash flow
-13.3%
Cash-on-Cash Return
3.1%
Cap rate
0.6%
Rent to Value Ratio
Active
$400,000
3
bds
|
3
ba
|
1,900
sqft
|
built
1975
9173 Fontainebleau Blvd, Miami, FL 33172
$-676
Cash flow
-8.8%
Cash-on-Cash Return
4.1%
Cap rate
0.8%
Rent to Value Ratio
Active
$13,900,000
4
bds
|
4
ba
|
4,154
sqft
|
built
2008
800 S Pointe Dr, Miami Beach, FL 33139
$-94,464
Cash flow
-35.5%
Cash-on-Cash Return
-2.0%
Cap rate
0.1%
Rent to Value Ratio
Active
$650,000
3
bds
|
2
ba
|
1,225
sqft
|
built
1977
10800 NW 18th Ave, Miami, FL 33167
$-1,487
Cash flow
-11.9%
Cash-on-Cash Return
3.4%
Cap rate
0.5%
Rent to Value Ratio
Active
$380,000
3
bds
|
3
ba
|
1,629
sqft
|
built
1981
18181 NE 31st Ct, Aventura, FL 33160
$-1,392
Cash flow
-19.1%
Cash-on-Cash Return
1.8%
Cap rate
0.9%
Rent to Value Ratio