Palm Beach County Investment Properties for Sale
Browse homes for sale and investment properties in Palm Beach County. Refine your search by price, property type, or more.
Best cash flowing properties in Palm Beach County

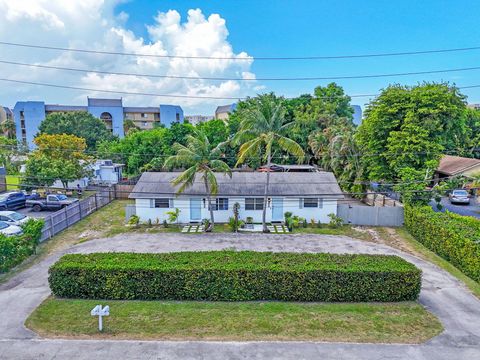
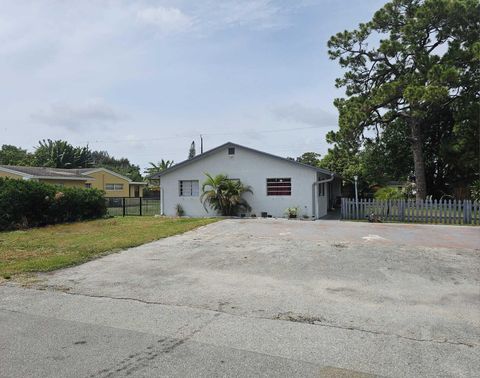
Active
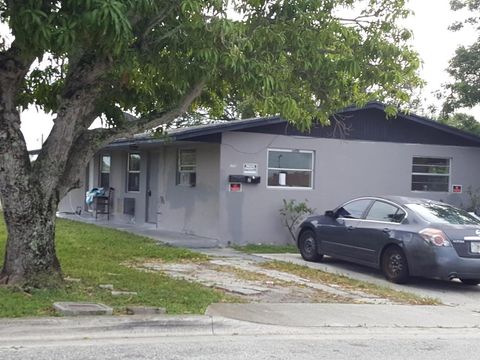
$500,000
3
bds
|
0
ba
|
1,184
sqft
|
built
1934
1215 18th Ave N, Lake Worth, FL 33460
$-821
Cash flow
-8.6%
Cash-on-Cash Return
4.2%
Cap rate
0.6%
Rent to Value Ratio
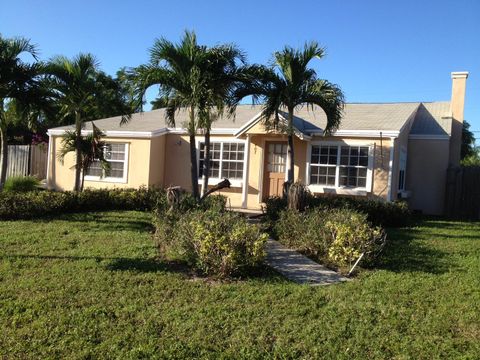
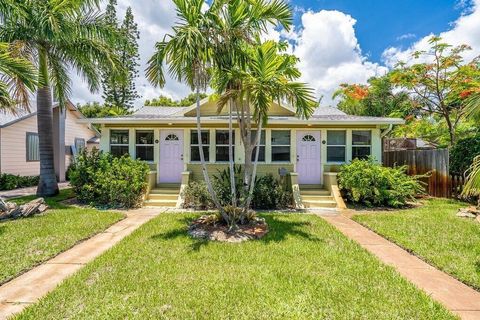
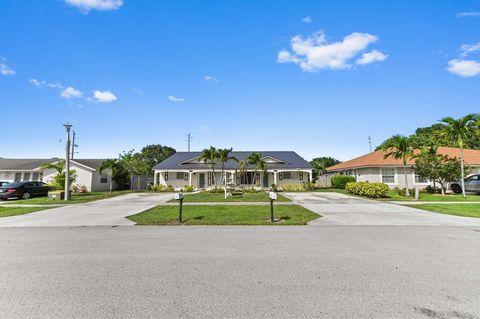
Active
$350,000
2
bds
|
0
ba
|
913
sqft
|
built
1925
323 S E St, Lake Worth, FL 33460
$-869
Cash flow
-13.0%
Cash-on-Cash Return
3.2%
Cap rate
0.6%
Rent to Value Ratio
91 out of 112 properties for sale in Palm Beach County
Limited Results Shown
Create a free account, or log in to reveal all property listings and enjoy the complete experience.
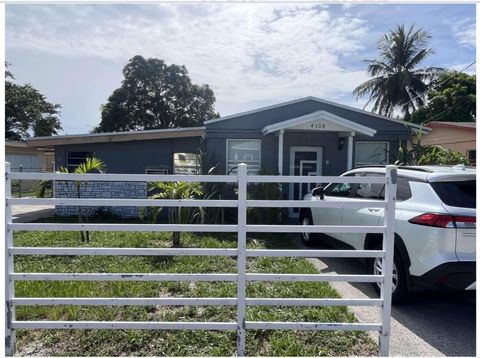
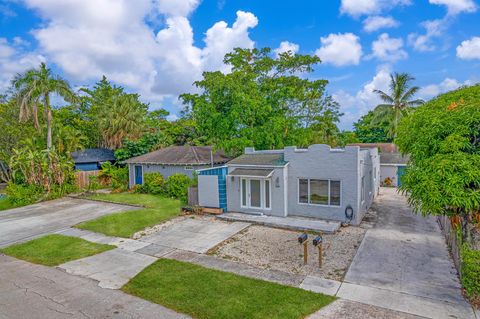
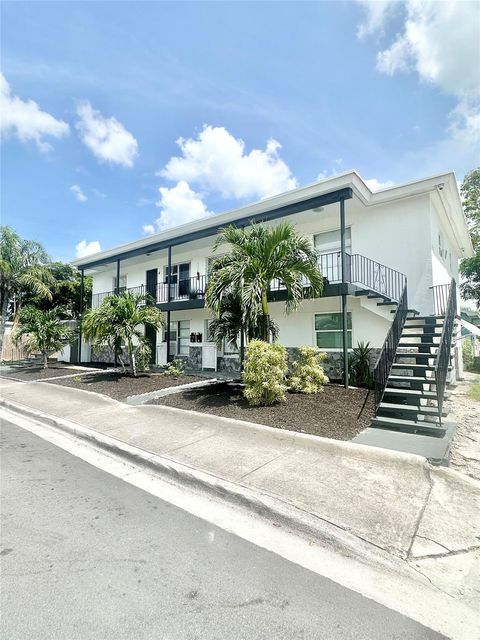
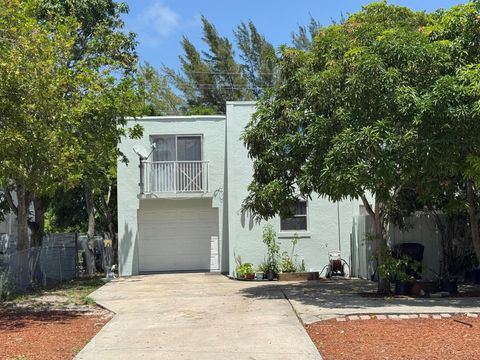
Active
$449,900
3
bds
|
0
ba
|
1,548
sqft
|
built
1947
4108 Greenwood Ave, West Palm Beach, FL 33407
$-1,489
Cash flow
-17.3%
Cash-on-Cash Return
2.2%
Cap rate
0.4%
Rent to Value Ratio
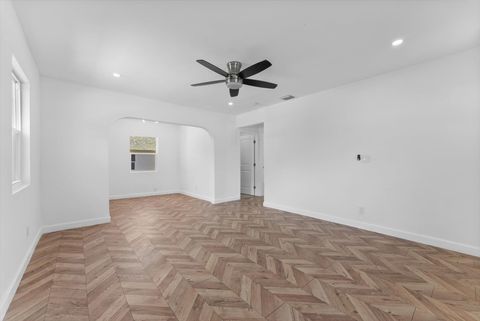
Active
$750,000
bds
|
0
ba
|
2,544
sqft
|
built
1954
1125 N F St, Lake Worth, FL 33460
$-2,456
Cash flow
-17.1%
Cash-on-Cash Return
2.2%
Cap rate
0.4%
Rent to Value Ratio
Active
$599,000
6
bds
|
0
ba
|
1,922
sqft
|
built
1926
1040 17th St, West Palm Beach, FL 33407
$-1,661
Cash flow
-14.5%
Cash-on-Cash Return
2.8%
Cap rate
0.4%
Rent to Value Ratio
Active
$699,000
bds
|
0
ba
|
1,704
sqft
|
built
1977
4861 Orlando Ave, West Palm Beach, FL 33417
$-2,714
Cash flow
-20.3%
Cash-on-Cash Return
1.5%
Cap rate
0.3%
Rent to Value Ratio
Active
$695,000
4
bds
|
0
ba
|
2,058
sqft
|
built
1928
407 W Palm St, Lantana, FL 33462
$-1,701
Cash flow
-12.8%
Cash-on-Cash Return
3.2%
Cap rate
0.5%
Rent to Value Ratio
Active
$579,500
bds
|
0
ba
|
1,782
sqft
|
built
1926
516 Nathan Hale Rd, West Palm Beach, FL 33405
$-2,234
Cash flow
-20.1%
Cash-on-Cash Return
1.5%
Cap rate
0.3%
Rent to Value Ratio
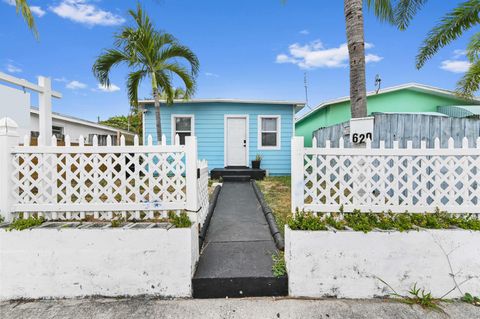
Active
$499,900
bds
|
0
ba
|
1,056
sqft
|
built
1954
629 N F St, Lake Worth, FL 33460
$-1,658
Cash flow
-17.3%
Cash-on-Cash Return
2.2%
Cap rate
0.4%
Rent to Value Ratio

Active
$450,000
4
bds
|
0
ba
|
1,544
sqft
|
built
1971
341 Silver Beach Rd, Riviera Beach, FL 33403
$-1,383
Cash flow
-16.0%
Cash-on-Cash Return
2.5%
Cap rate
0.4%
Rent to Value Ratio

Active
$325,000
bds
|
0
ba
|
1,536
sqft
|
built
1953
614 N Tamarind Ave, West Palm Beach, FL 33401
$-1,052
Cash flow
-16.9%
Cash-on-Cash Return
2.3%
Cap rate
0.4%
Rent to Value Ratio
Active
$599,000
2
bds
|
0
ba
|
1,635
sqft
|
built
1950
1032 N J St, Lake Worth, FL 33460
$-2,274
Cash flow
-19.8%
Cash-on-Cash Return
1.6%
Cap rate
0.4%
Rent to Value Ratio
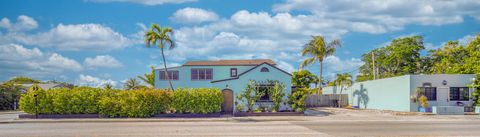
Active
$1,399,000
4
bds
|
0
ba
|
4,120
sqft
|
built
1983
130 S Ocean Breeze, Lake Worth, FL 33460
$-6,255
Cash flow
-23.3%
Cash-on-Cash Return
0.8%
Cap rate
0.2%
Rent to Value Ratio
Active
$899,000
bds
|
0
ba
|
2,028
sqft
|
built
1996
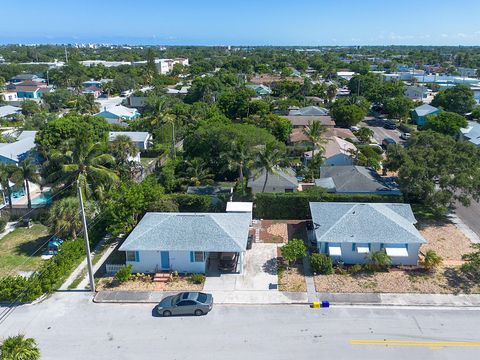
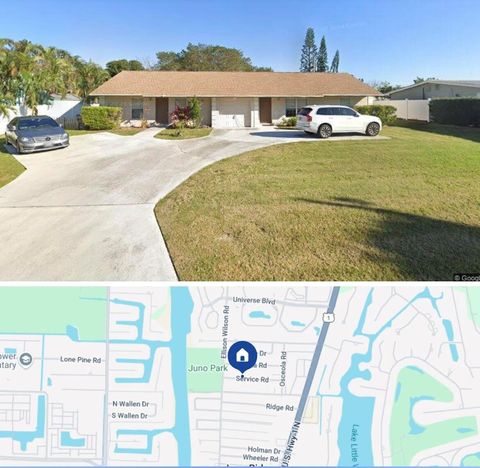
1905 Service Rd, North Palm Beach, FL 33408
$-3,452
Cash flow
-20.0%
Cash-on-Cash Return
1.5%
Cap rate
0.3%
Rent to Value Ratio
Active
$1,195,000
bds
|
0
ba
|
1,392
sqft
|
built
1958
227 NE 12th St, Delray Beach, FL 33444
$-5,426
Cash flow
-23.7%
Cash-on-Cash Return
0.7%
Cap rate
0.2%
Rent to Value Ratio
Active
$370,000
4
bds
|
0
ba
|
1,404
sqft
|
built
1971
1233 Ac Evans St, Riviera Beach, FL 33404
$-1,136
Cash flow
-16.0%
Cash-on-Cash Return
2.5%
Cap rate
0.4%
Rent to Value Ratio
Active
$735,000
2
bds
|
0
ba
|
1,758
sqft
|
built
1926
215 S Ocean Breeze, Lake Worth, FL 33460
$-3,275
Cash flow
-23.2%
Cash-on-Cash Return
0.8%
Cap rate
0.3%
Rent to Value Ratio
Active
$1,050,000
5
bds
|
0
ba
|
998
sqft
|
built
1957
1501 N Federal Hwy, Lake Worth, FL 33460
$-4,503
Cash flow
-22.4%
Cash-on-Cash Return
1.0%
Cap rate
0.2%
Rent to Value Ratio
Active
$499,900
2
bds
|
0
ba
|
754
sqft
|
built
1950
1420 Lake Ave, Lake Worth, FL 33460
$-1,211
Cash flow
-12.6%
Cash-on-Cash Return
3.2%
Cap rate
0.5%
Rent to Value Ratio

Active
$450,000
4
bds
|
0
ba
|
1,680
sqft
|
built
1964
461 Silver Beach Rd, Riviera Beach, FL 33403
$-1,582
Cash flow
-18.3%
Cash-on-Cash Return
1.9%
Cap rate
0.4%
Rent to Value Ratio
Active
$1,980,000
bds
|
0
ba
|
4,242
sqft
|
built
1957
320 NE 13th Ave, Boynton Beach, FL 33435
$-10,944
Cash flow
-28.8%
Cash-on-Cash Return
-0.5%
Cap rate
0.1%
Rent to Value Ratio

Active
$649,900
5
bds
|
0
ba
|
1,920
sqft
|
built
1968
512 Holly Dr, Palm Beach Gardens, FL 33410
$-2,372
Cash flow
-19.0%
Cash-on-Cash Return
1.8%
Cap rate
0.3%
Rent to Value Ratio
Active
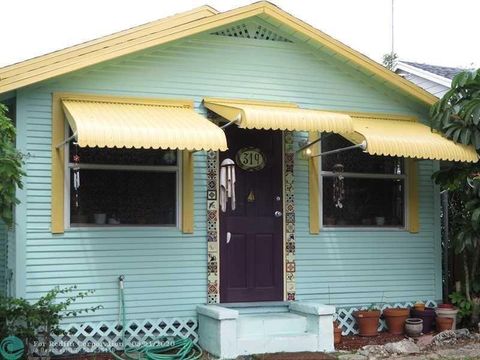
$379,000
3
bds
|
0
ba
|
968
sqft
|
built
1925
319 S M St, Lake Worth, FL 33460
$-1,172
Cash flow
-16.1%
Cash-on-Cash Return
2.4%
Cap rate
0.5%
Rent to Value Ratio
Active
$1,395,000
bds
|
0
ba
|
1,700
sqft
|
built
1988
2135 Dock St, West Palm Beach, FL 33401
$-6,121
Cash flow
-22.9%
Cash-on-Cash Return
0.9%
Cap rate
0.2%
Rent to Value Ratio
Active
$695,000
bds
|
0
ba
|
1,733
sqft
|
built
1957
513 Greynolds Cir, Lantana, FL 33462
$-1,662
Cash flow
-12.5%
Cash-on-Cash Return
3.3%
Cap rate
0.5%
Rent to Value Ratio
Active
$369,900
bds
|
0
ba
|
1,008
sqft
|
built
1953
519 S M St, Lake Worth, FL 33460
$-894
Cash flow
-12.6%
Cash-on-Cash Return
3.2%
Cap rate
0.6%
Rent to Value Ratio
Active
$580,000
bds
|
0
ba
|
1,376
sqft
|
built
1931
1017 S M St, Lake Worth, FL 33460
$-2,064
Cash flow
-18.6%
Cash-on-Cash Return
1.9%
Cap rate
0.4%
Rent to Value Ratio
Active
$575,000
2
bds
|
0
ba
|
2,156
sqft
|
built
1925
536 18th St, West Palm Beach, FL 33407
$-2,098
Cash flow
-19.0%
Cash-on-Cash Return
1.8%
Cap rate
0.3%
Rent to Value Ratio
Active
$1,330,000
5
bds
|
0
ba
|
1,616
sqft
|
built
1950
701 New Jersey St, West Palm Beach, FL 33401
$-6,158
Cash flow
-24.2%
Cash-on-Cash Return
0.6%
Cap rate
0.2%
Rent to Value Ratio
Active
$825,000
6
bds
|
0
ba
|
2,852
sqft
|
built
1980
1029 S C St, Lake Worth, FL 33460
$-2,818
Cash flow
-17.8%
Cash-on-Cash Return
2.0%
Cap rate
0.4%
Rent to Value Ratio
Active
$1,220,000
4
bds
|
0
ba
|
2,108
sqft
|
built
1971
697 Ipswich St, Boca Raton, FL 33487
$-5,419
Cash flow
-23.2%
Cash-on-Cash Return
0.8%
Cap rate
0.2%
Rent to Value Ratio
Active
$554,900
4
bds
|
2
ba
|
1,666
sqft
|
built
1931
924 Mc Intosh St, West Palm Beach, FL 33405
$-1,743
Cash flow
-16.4%
Cash-on-Cash Return
2.4%
Cap rate
0.5%
Rent to Value Ratio
Active
$650,000
bds
|
0
ba
|
1,248
sqft
|
built
1961
4316 Forest Rd, West Palm Beach, FL 33406
$-2,183
Cash flow
-17.5%
Cash-on-Cash Return
2.1%
Cap rate
0.3%
Rent to Value Ratio
Active
$639,999
4
bds
|
0
ba
|
1,852
sqft
|
built
1988
4356 Anna Ln, Palm Springs, FL 33406
$-2,245
Cash flow
-18.3%
Cash-on-Cash Return
1.9%
Cap rate
0.4%
Rent to Value Ratio
Active
$799,999
4
bds
|
0
ba
|
3,054
sqft
|
built
1930
624 10th Ave N, Lake Worth, FL 33460
$-1,633
Cash flow
-10.7%
Cash-on-Cash Return
3.7%
Cap rate
0.6%
Rent to Value Ratio

Active
$564,900
bds
|
0
ba
|
1,695
sqft
|
built
1950
727 S M St, Lake Worth, FL 33460
$-1,802
Cash flow
-16.6%
Cash-on-Cash Return
2.3%
Cap rate
0.4%
Rent to Value Ratio
Active
$799,000
6
bds
|
0
ba
|
3,376
sqft
|
built
1979
910 N F St, Lake Worth, FL 33460
$-3,228
Cash flow
-21.1%
Cash-on-Cash Return
1.3%
Cap rate
0.3%
Rent to Value Ratio
Active
$824,999
bds
|
0
ba
|
2,490
sqft
|
built
1976
1320 Riverside Cir, Wellington, FL 33414
$-3,482
Cash flow
-22.0%
Cash-on-Cash Return
1.1%
Cap rate
0.2%
Rent to Value Ratio
Active
$1,795,000
bds
|
0
ba
|
2,730
sqft
|
built
1945
101 Lucerne Ave, Lake Worth, FL 33460
$-8,982
Cash flow
-26.1%
Cash-on-Cash Return
0.1%
Cap rate
0.1%
Rent to Value Ratio

Active
$1,650,000
6
bds
|
0
ba
|
2,937
sqft
|
built
1986
218 NE 10th St, Delray Beach, FL 33444
$-6,145
Cash flow
-19.4%
Cash-on-Cash Return
1.7%
Cap rate
0.3%
Rent to Value Ratio