Palm Beach County Investment Properties for Sale
Browse homes for sale and investment properties in Palm Beach County. Refine your search by price, property type, or more.
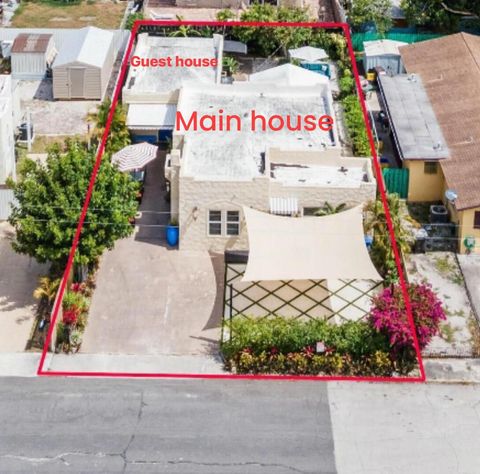
Best cash flowing properties in Palm Beach County
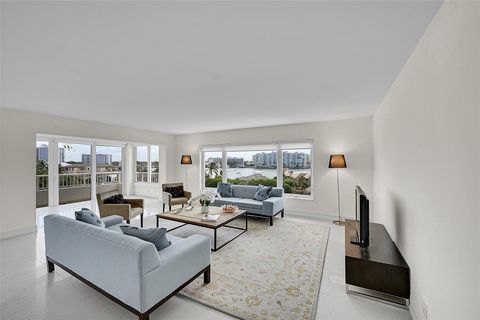
Active
$685,000
4
bds
|
3
ba
|
2,259
sqft
|
built
2019
3210 Klays Ct, Royal Palm Beach, FL 33411
$617
Cash flow
4.7%
Cash-on-Cash Return
7.2%
Cap rate
1.0%
Rent to Value Ratio
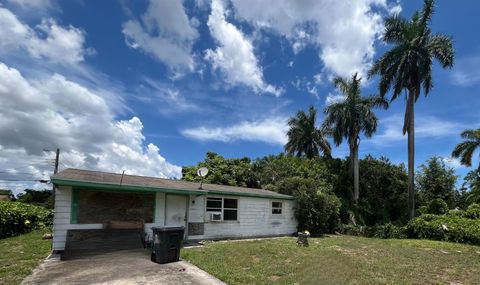
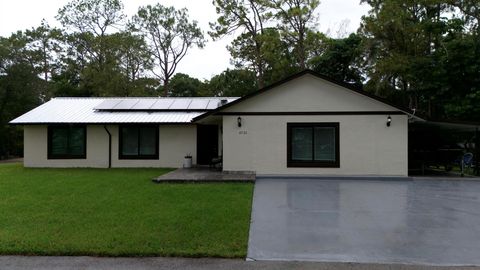
Active
$350,000
3
bds
|
1
ba
|
912
sqft
|
built
1971
3267 Hurricane Dr, Lantana, FL 33462
$-144
Cash flow
-2.1%
Cash-on-Cash Return
5.7%
Cap rate
0.7%
Rent to Value Ratio
5,171 out of 6,268 properties for sale in Palm Beach County
Limited Results Shown
Create a free account, or log in to reveal all property listings and enjoy the complete experience.
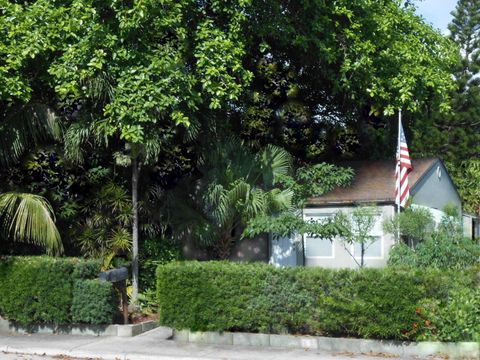
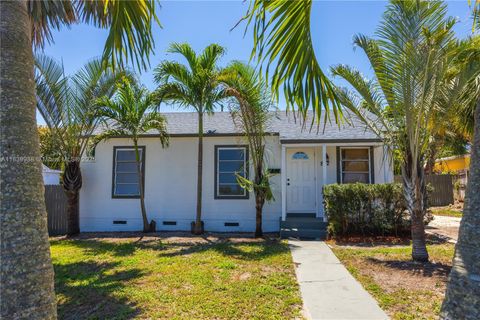
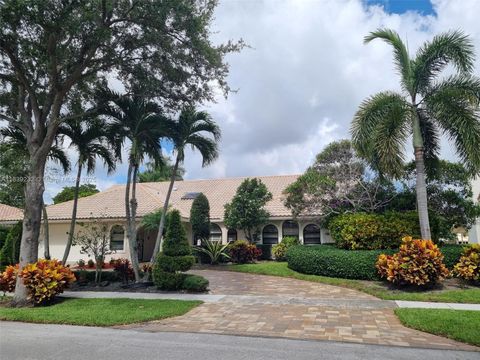
Active
$369,900
bds
|
0
ba
|
1,008
sqft
|
built
1953
519 S M St, Lake Worth, FL 33460
$-894
Cash flow
-12.6%
Cash-on-Cash Return
3.2%
Cap rate
0.6%
Rent to Value Ratio
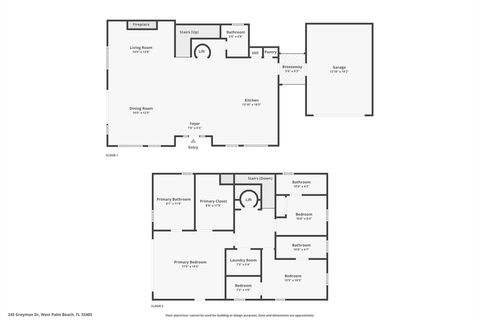
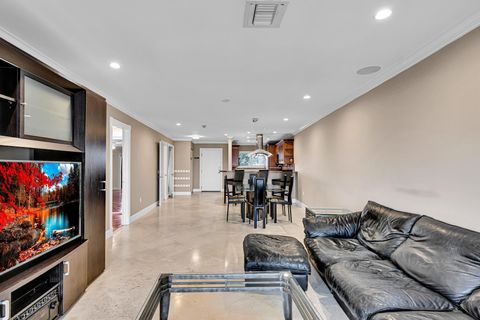
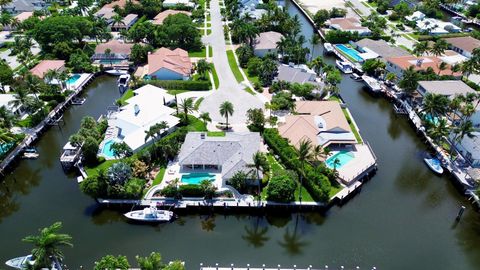
Active
$3,500,000
3
bds
|
4
ba
|
2,752
sqft
|
built
2021
245 Greymon Dr, West Palm Beach, FL 33405
$-12,961
Cash flow
-19.3%
Cash-on-Cash Return
1.7%
Cap rate
0.3%
Rent to Value Ratio
Active
$444,000
3
bds
|
2
ba
|
1,792
sqft
|
built
1988
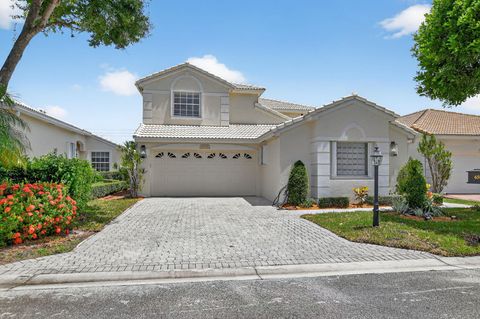
10897 Grandview Ct, Royal Palm Beach, FL 33411
$-623
Cash flow
-7.3%
Cash-on-Cash Return
4.5%
Cap rate
0.7%
Rent to Value Ratio
Active
$1,299,999
4
bds
|
3
ba
|
1,676
sqft
|
built
1953
204 S Seacrest Cir, Delray Beach, FL 33444
$-1,805
Cash flow
-7.2%
Cash-on-Cash Return
4.5%
Cap rate
0.6%
Rent to Value Ratio
Active
$215,000
2
bds
|
2
ba
|
1,244
sqft
|
built
1979
23380 Carolwood Ln, Boca Raton, FL 33428
$-495
Cash flow
-12.0%
Cash-on-Cash Return
3.4%
Cap rate
1.1%
Rent to Value Ratio
Active
$585,000
4
bds
|
2
ba
|
1,144
sqft
|
built
1980
9324 Gettysburg Rd, Boca Raton, FL 33434
$-862
Cash flow
-7.7%
Cash-on-Cash Return
4.4%
Cap rate
0.6%
Rent to Value Ratio
Active
$1,750,000
4
bds
|
3
ba
|
3,670
sqft
|
built
1973
8267 Nashua Dr, Palm Beach Gardens, FL 33418
$-5,813
Cash flow
-17.3%
Cash-on-Cash Return
2.2%
Cap rate
0.4%
Rent to Value Ratio
Active
$415,000
3
bds
|
2
ba
|
850
sqft
|
built
1953
812 33rd St, West Palm Beach, FL 33407
$-667
Cash flow
-8.4%
Cash-on-Cash Return
4.2%
Cap rate
0.5%
Rent to Value Ratio
Active
$245,000
2
bds
|
2
ba
|
1,204
sqft
|
built
1974
3605 S Ocean Blvd, South Palm Beach, FL 33480
$-1,679
Cash flow
-35.8%
Cash-on-Cash Return
-2.1%
Cap rate
1.1%
Rent to Value Ratio
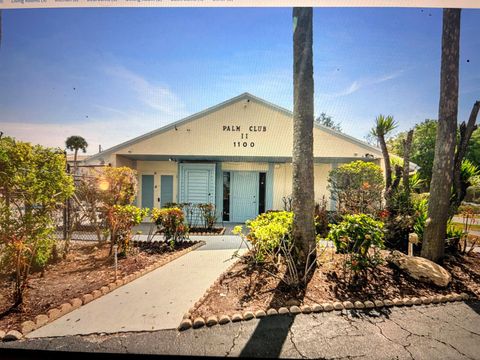
Active
$215,000
2
bds
|
2
ba
|
1,111
sqft
|
built
1984
1115 Green Pine Blvd, West Palm Beach, FL 33409
$-579
Cash flow
-14.1%
Cash-on-Cash Return
2.9%
Cap rate
0.9%
Rent to Value Ratio
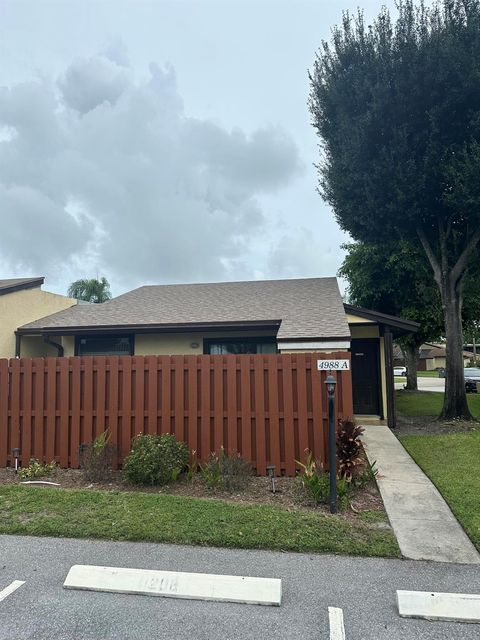
Active
$310,000
2
bds
|
2
ba
|
841
sqft
|
built
1980
4988 Alder Dr, West Palm Beach, FL 33417
$-623
Cash flow
-10.5%
Cash-on-Cash Return
3.7%
Cap rate
0.6%
Rent to Value Ratio
Active
$259,900
2
bds
|
2
ba
|
1,078
sqft
|
built
1988
13870 Oneida Dr, Delray Beach, FL 33446
$-680
Cash flow
-13.7%
Cash-on-Cash Return
3.0%
Cap rate
0.8%
Rent to Value Ratio
Active
$1,399,000
4
bds
|
4
ba
|
2,941
sqft
|
built
1989
4256 Gleneagles Dr, Boynton Beach, FL 33436
$-4,254
Cash flow
-15.9%
Cash-on-Cash Return
2.5%
Cap rate
0.4%
Rent to Value Ratio
Active
$999,000
3
bds
|
3
ba
|
2,942
sqft
|
built
1993
17809 Southwick Way, Boca Raton, FL 33498
$-1,906
Cash flow
-10.0%
Cash-on-Cash Return
3.9%
Cap rate
0.6%
Rent to Value Ratio

Active
$659,000
3
bds
|
2
ba
|
1,436
sqft
|
built
1975
3931 Flag Dr, Palm Beach Gardens, FL 33410
$-1,212
Cash flow
-9.6%
Cash-on-Cash Return
3.9%
Cap rate
0.6%
Rent to Value Ratio
Active
$4,975,000
6
bds
|
7
ba
|
6,823
sqft
|
built
2011
2685 Greenbriar Blvd, Wellington, FL 33414
$-21,286
Cash flow
-22.3%
Cash-on-Cash Return
1.0%
Cap rate
0.2%
Rent to Value Ratio
Active
$768,000
3
bds
|
3
ba
|
3,255
sqft
|
built
2006
400 NE 69th Cir, Boca Raton, FL 33487
$-2,322
Cash flow
-15.8%
Cash-on-Cash Return
2.5%
Cap rate
0.6%
Rent to Value Ratio
Active
$780,000
5
bds
|
4
ba
|
3,314
sqft
|
built
2002
7062 Brunswick Cir, Boynton Beach, FL 33472
$-1,793
Cash flow
-12.0%
Cash-on-Cash Return
3.4%
Cap rate
0.6%
Rent to Value Ratio
Active
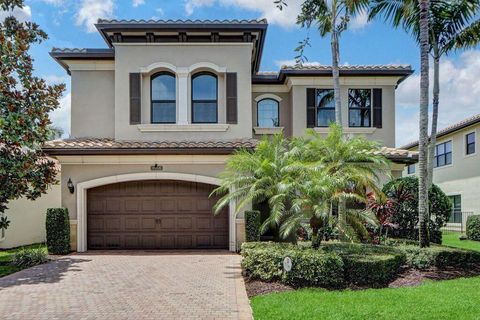
$874,900
3
bds
|
2
ba
|
1,577
sqft
|
built
1991
216 E Tall Oaks Cir, Palm Beach Gardens, FL 33410
$-2,551
Cash flow
-15.2%
Cash-on-Cash Return
2.6%
Cap rate
0.4%
Rent to Value Ratio
Active
$1,285,000
2
bds
|
2
ba
|
1,786
sqft
|
built
1970
600 S Ocean Blvd, Boca Raton, FL 33432
$-5,355
Cash flow
-21.7%
Cash-on-Cash Return
1.1%
Cap rate
0.5%
Rent to Value Ratio
Active
$650,000
4
bds
|
2
ba
|
2,081
sqft
|
built
1983
4721 Coconut Blvd, West Palm Beach, FL 33411
$-983
Cash flow
-7.9%
Cash-on-Cash Return
4.3%
Cap rate
0.7%
Rent to Value Ratio
Active
$1,595,000
3
bds
|
3
ba
|
2,854
sqft
|
built
1984
2685 NW 27th Ter, Boca Raton, FL 33434
$-4,478
Cash flow
-14.6%
Cash-on-Cash Return
2.8%
Cap rate
0.5%
Rent to Value Ratio
Active
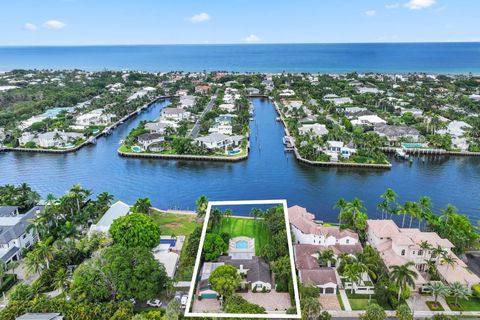
$3,925,000
4
bds
|
3
ba
|
2,724
sqft
|
built
1978
830 NE Boca Bay Colony Dr, Boca Raton, FL 33487
$-17,617
Cash flow
-23.4%
Cash-on-Cash Return
0.8%
Cap rate
0.2%
Rent to Value Ratio
Active
$689,777
3
bds
|
2
ba
|
2,000
sqft
|
built
1931
951 Selkirk St, West Palm Beach, FL 33405
$-1,853
Cash flow
-14.0%
Cash-on-Cash Return
2.9%
Cap rate
0.5%
Rent to Value Ratio
Active
$225,000
2
bds
|
2
ba
|
1,104
sqft
|
built
1985
3630 Alder Dr, West Palm Beach, FL 33417
$-364
Cash flow
-8.4%
Cash-on-Cash Return
4.2%
Cap rate
1.0%
Rent to Value Ratio
Active
$849,000
2
bds
|
3
ba
|
1,600
sqft
|
built
1961
720 Eastwind Dr, North Palm Beach, FL 33408
$-2,351
Cash flow
-14.4%
Cash-on-Cash Return
2.8%
Cap rate
0.5%
Rent to Value Ratio
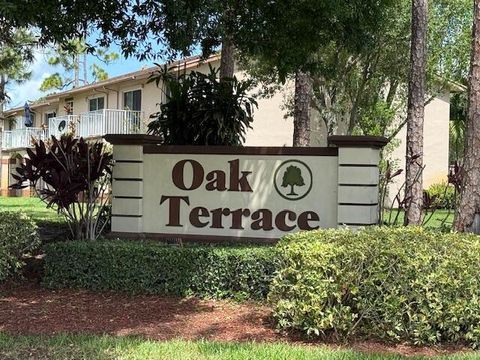
Active
$175,000
2
bds
|
2
ba
|
883
sqft
|
built
1980
4720 Oak Terrace Dr, Greenacres, FL 33463
$-364
Cash flow
-10.9%
Cash-on-Cash Return
3.6%
Cap rate
1.0%
Rent to Value Ratio
Active
$259,000
2
bds
|
2
ba
|
1,335
sqft
|
built
1981
2005 NW 18th St, Delray Beach, FL 33445
$-665
Cash flow
-13.4%
Cash-on-Cash Return
3.1%
Cap rate
0.8%
Rent to Value Ratio
Active
$469,999
3
bds
|
3
ba
|
2,606
sqft
|
built
1996
4686 Hazleton Ln, Wellington, FL 33449
$-1,084
Cash flow
-12.0%
Cash-on-Cash Return
3.4%
Cap rate
0.8%
Rent to Value Ratio
Active
$1,690,000
3
bds
|
3
ba
|
2,467
sqft
|
built
1981
2668 NW 41st St, Boca Raton, FL 33434
$-4,966
Cash flow
-15.3%
Cash-on-Cash Return
2.6%
Cap rate
0.4%
Rent to Value Ratio
Active
$635,000
4
bds
|
3
ba
|
2,810
sqft
|
built
2006
1086 Grove Park Cir, Boynton Beach, FL 33436
$-1,218
Cash flow
-10.0%
Cash-on-Cash Return
3.8%
Cap rate
0.7%
Rent to Value Ratio
Active
$759,000
4
bds
|
4
ba
|
2,729
sqft
|
built
1995
6502 Brava Way, Boca Raton, FL 33433
$-1,355
Cash flow
-9.3%
Cash-on-Cash Return
4.0%
Cap rate
0.8%
Rent to Value Ratio
Active
$1,599,000
4
bds
|
4
ba
|
3,537
sqft
|
built
2013
8968 Little Falls Way, Delray Beach, FL 33446
$-4,544
Cash flow
-14.8%
Cash-on-Cash Return
2.7%
Cap rate
0.5%
Rent to Value Ratio
Active
$6,500,000
3
bds
|
3
ba
|
2,317
sqft
|
built
1941
2 Fisher Ln, Delray Beach, FL 33483
$-33,505
Cash flow
-26.9%
Cash-on-Cash Return
0.0%
Cap rate
0.1%
Rent to Value Ratio
Active
$240,000
3
bds
|
2
ba
|
1,326
sqft
|
built
1994
5145 Brisata Cir, Boynton Beach, FL 33437
$-530
Cash flow
-11.5%
Cash-on-Cash Return
3.5%
Cap rate
1.0%
Rent to Value Ratio
Active
$770,000
5
bds
|
3
ba
|
3,496
sqft
|
built
2001
2173 Bellcrest Cir, Royal Palm Beach, FL 33411
$-1,968
Cash flow
-13.3%
Cash-on-Cash Return
3.1%
Cap rate
0.5%
Rent to Value Ratio
Active
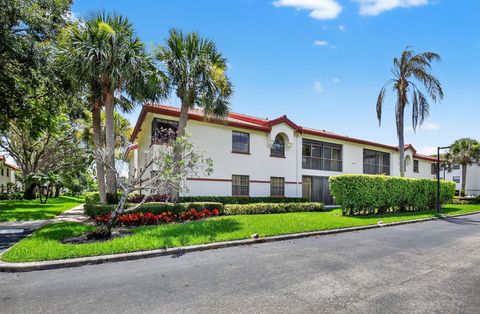
$179,900
2
bds
|
2
ba
|
960
sqft
|
built
1979
500 Executive Center Dr, West Palm Beach, FL 33401
$-570
Cash flow
-16.5%
Cash-on-Cash Return
2.3%
Cap rate
1.0%
Rent to Value Ratio
Active
$1,199,000
4
bds
|
3
ba
|
2,826
sqft
|
built
1997
16215 121st Ter N, Jupiter, FL 33478
$-2,170
Cash flow
-9.4%
Cash-on-Cash Return
4.0%
Cap rate
0.6%
Rent to Value Ratio