Palm Beach County Investment Properties for Sale
Browse homes for sale and investment properties in Palm Beach County. Refine your search by price, property type, or more.
Best cash flowing properties in Palm Beach County
Active
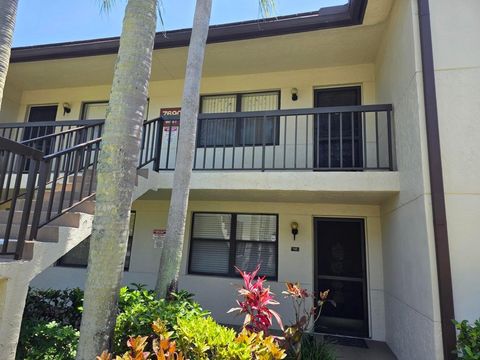
$125,000
2
bds
|
2
ba
|
1,049
sqft
|
built
1987
7690 Tahiti Ln, Lake Worth, FL 33467
$-31
Cash flow
-1.3%
Cash-on-Cash Return
5.8%
Cap rate
1.4%
Rent to Value Ratio
Active
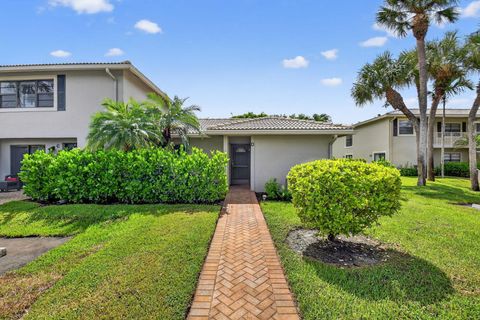
$99,000
2
bds
|
2
ba
|
1,479
sqft
|
built
1981
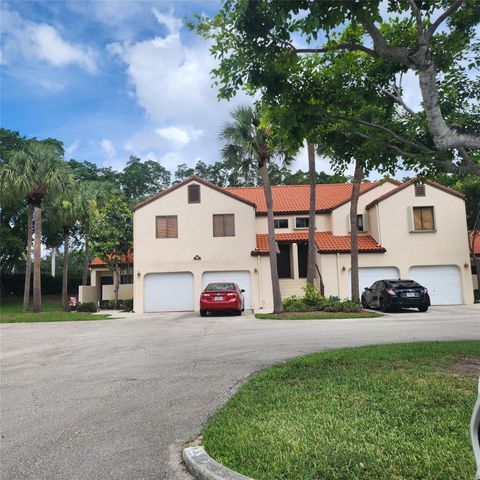
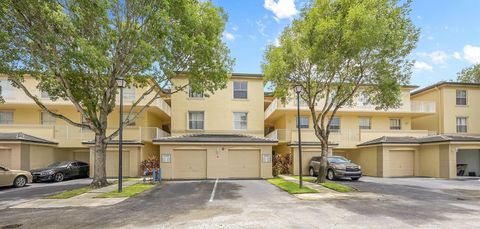
32 Stratford Ln W, Boynton Beach, FL 33436
$-476
Cash flow
-25.1%
Cash-on-Cash Return
0.4%
Cap rate
2.3%
Rent to Value Ratio
5,261 out of 6,384 properties for sale in Palm Beach County
Limited Results Shown
Create a free account, or log in to reveal all property listings and enjoy the complete experience.
Active
$900,000
3
bds
|
2
ba
|
1,706
sqft
|
built
1978
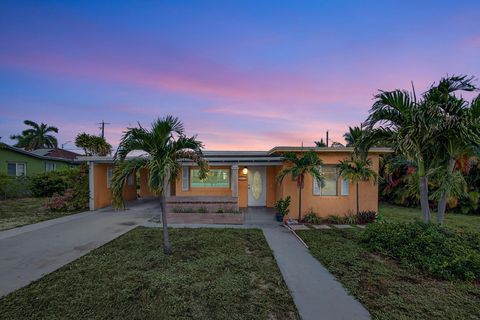
1512 Hummingbird Dr, Delray Beach, FL 33444
$-2,063
Cash flow
-12.0%
Cash-on-Cash Return
3.4%
Cap rate
0.5%
Rent to Value Ratio
Active
$599,000
2
bds
|
2
ba
|
1,056
sqft
|
built
1986
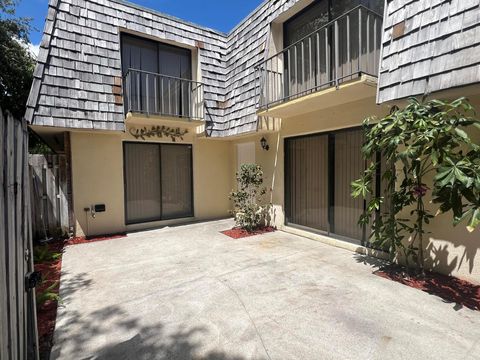
353 S US Highway 1, Jupiter, FL 33477
$-2,324
Cash flow
-20.2%
Cash-on-Cash Return
1.5%
Cap rate
0.5%
Rent to Value Ratio
Active
$739,999
3
bds
|
2
ba
|
1,424
sqft
|
built
1988
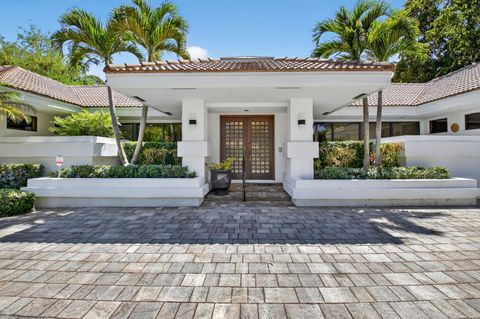
12683 152nd St N, Jupiter, FL 33478
$-1,423
Cash flow
-10.0%
Cash-on-Cash Return
3.8%
Cap rate
0.5%
Rent to Value Ratio
Active
$2,095,000
2
bds
|
2
ba
|
1,552
sqft
|
built
1925
529 Biscayne Dr, West Palm Beach, FL 33401
$-7,929
Cash flow
-19.7%
Cash-on-Cash Return
1.6%
Cap rate
0.3%
Rent to Value Ratio
Active
$899,000
3
bds
|
2
ba
|
1,680
sqft
|
built
1980
19600 Sawgrass Cir, Boca Raton, FL 33434
$-2,980
Cash flow
-17.3%
Cash-on-Cash Return
2.2%
Cap rate
0.5%
Rent to Value Ratio
Active
$759,000
2
bds
|
2
ba
|
1,175
sqft
|
built
2005
1551 N Flagler Dr, West Palm Beach, FL 33401
$-3,085
Cash flow
-21.2%
Cash-on-Cash Return
1.3%
Cap rate
0.5%
Rent to Value Ratio
Active
$439,000
2
bds
|
2
ba
|
1,601
sqft
|
built
1998
7546 La Paz Blvd, Boca Raton, FL 33433
$-1,517
Cash flow
-18.0%
Cash-on-Cash Return
2.0%
Cap rate
0.7%
Rent to Value Ratio
Active
$1,650,000
3
bds
|
4
ba
|
3,277
sqft
|
built
2016
9350 Eden Roc Ct, Delray Beach, FL 33446
$-6,547
Cash flow
-20.7%
Cash-on-Cash Return
1.4%
Cap rate
0.4%
Rent to Value Ratio
Active
$579,500
bds
|
0
ba
|
1,782
sqft
|
built
1926
516 Nathan Hale Rd, West Palm Beach, FL 33405
$-2,234
Cash flow
-20.1%
Cash-on-Cash Return
1.5%
Cap rate
0.3%
Rent to Value Ratio
Active
$860,000
4
bds
|
4
ba
|
2,133
sqft
|
built
1989
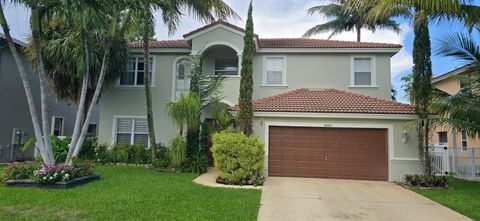
9398 Aegean Dr, Boca Raton, FL 33496
$-626
Cash flow
-3.8%
Cash-on-Cash Return
5.3%
Cap rate
0.7%
Rent to Value Ratio
Active
$250,000
3
bds
|
2
ba
|
1,096
sqft
|
built
1987
9 Via De Casas Sur, Boynton Beach, FL 33426
$-731
Cash flow
-15.3%
Cash-on-Cash Return
2.6%
Cap rate
1.0%
Rent to Value Ratio
Active
$379,000
3
bds
|
1
ba
|
1,145
sqft
|
built
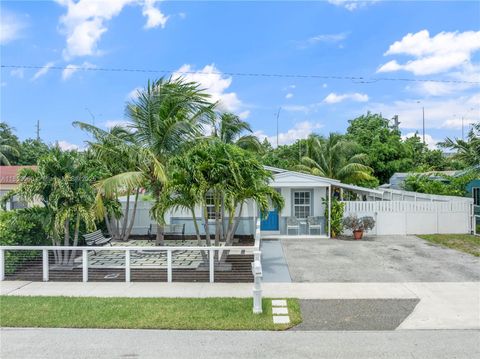
1955
1136 W 7th St, Riviera Beach, FL 33404
$-493
Cash flow
-6.8%
Cash-on-Cash Return
4.6%
Cap rate
0.7%
Rent to Value Ratio
Active
$284,900
2
bds
|
2
ba
|
1,232
sqft
|
built
1978
8 Lake Arbor Dr, Palm Springs, FL 33461
$-518
Cash flow
-9.5%
Cash-on-Cash Return
4.0%
Cap rate
0.8%
Rent to Value Ratio
Active
$4,450,000
5
bds
|
5
ba
|
5,035
sqft
|
built
1985
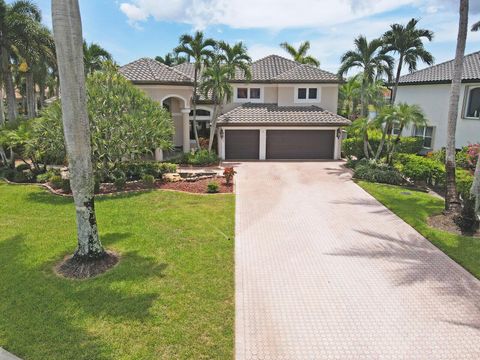
7564 Mahogany Bend Pl, Boca Raton, FL 33434
$-21,931
Cash flow
-25.7%
Cash-on-Cash Return
0.2%
Cap rate
0.2%
Rent to Value Ratio
Active
$660,000
3
bds
|
3
ba
|
2,012
sqft
|
built
1976
2738 Flamango Lake Dr, West Palm Beach, FL 33406
$-1,140
Cash flow
-9.0%
Cash-on-Cash Return
4.1%
Cap rate
0.6%
Rent to Value Ratio
Active
$11,250,000
5
bds
|
7
ba
|
6,365
sqft
|
built
1996
377 E Coconut Palm Rd, Boca Raton, FL 33432
$-62,053
Cash flow
-28.8%
Cash-on-Cash Return
-0.5%
Cap rate
0.1%
Rent to Value Ratio
Active
$465,000
2
bds
|
2
ba
|
1,185
sqft
|
built
2010
450 N Federal Hwy, Boynton Beach, FL 33435
$-1,900
Cash flow
-21.3%
Cash-on-Cash Return
1.2%
Cap rate
0.7%
Rent to Value Ratio
Active
$2,625,000
4
bds
|
6
ba
|
4,000
sqft
|
built
2006
107 Nativa Cir, West Palm Beach, FL 33410
$-9,415
Cash flow
-18.7%
Cash-on-Cash Return
1.8%
Cap rate
0.4%
Rent to Value Ratio
Active
$675,000
2
bds
|
2
ba
|
1,040
sqft
|
built
2001
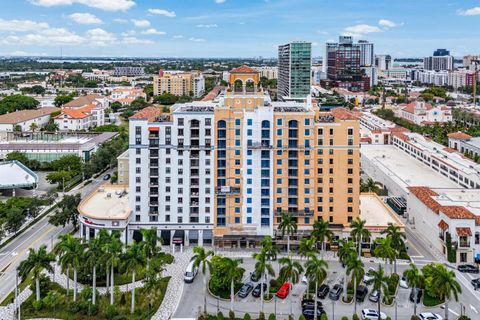
651 Okeechobee Blvd, West Palm Beach, FL 33401
$-3,034
Cash flow
-23.5%
Cash-on-Cash Return
0.8%
Cap rate
0.5%
Rent to Value Ratio
Active
$1,385,000
5
bds
|
3
ba
|
3,197
sqft
|
built
1996
10922 Bal Harbor Dr, Boca Raton, FL 33498
$-3,597
Cash flow
-13.6%
Cash-on-Cash Return
3.0%
Cap rate
0.5%
Rent to Value Ratio
Active
$309,000
3
bds
|
2
ba
|
1,200
sqft
|
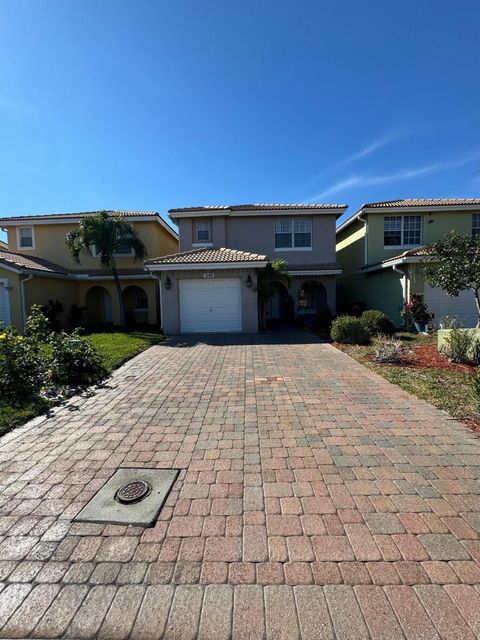
built
1999
2100 Greenview Shores Blvd, Wellington, FL 33414
$-679
Cash flow
-11.5%
Cash-on-Cash Return
3.5%
Cap rate
0.8%
Rent to Value Ratio
Active
$765,000
5
bds
|
3
ba
|
2,673
sqft
|
built
2002
6243 Shadow Tree Ln, Lake Worth, FL 33463
$-1,844
Cash flow
-12.6%
Cash-on-Cash Return
3.3%
Cap rate
0.5%
Rent to Value Ratio
Active
$425,000
3
bds
|
2
ba
|
876
sqft
|
built
1958
1119 S Ridge St, Lake Worth, FL 33460
$-683
Cash flow
-8.4%
Cash-on-Cash Return
4.2%
Cap rate
0.6%
Rent to Value Ratio
Active
$449,900
3
bds
|
3
ba
|
2,012
sqft
|
built
2003
3256 Commodore Ct, Royal Palm Beach, FL 33411
$-1,156
Cash flow
-13.4%
Cash-on-Cash Return
3.1%
Cap rate
0.7%
Rent to Value Ratio
Active
$430,000
3
bds
|
3
ba
|
1,569
sqft
|
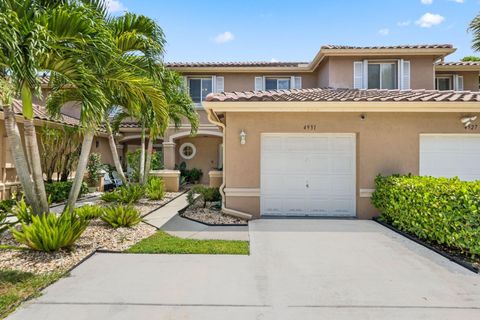
built
2000
4931 Pinemore Ln, Lake Worth, FL 33463
$-794
Cash flow
-9.6%
Cash-on-Cash Return
3.9%
Cap rate
0.7%
Rent to Value Ratio
Active
$619,000
4
bds
|
3
ba
|
2,375
sqft
|
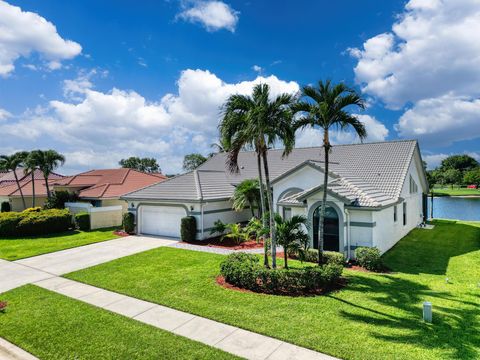
built
1989
6879 Lake Island Dr, Lake Worth, FL 33467
$-1,250
Cash flow
-10.5%
Cash-on-Cash Return
3.7%
Cap rate
0.6%
Rent to Value Ratio
Active
$514,500
3
bds
|
2
ba
|
1,471
sqft
|
built
1991
9190 Heathridge Dr, West Palm Beach, FL 33411
$-1,427
Cash flow
-14.5%
Cash-on-Cash Return
2.8%
Cap rate
0.7%
Rent to Value Ratio
Active
$2,450,000
5
bds
|
7
ba
|
4,484
sqft
|
built
2021
8227 Oceanus Dr, Boca Raton, FL 33496
$-8,041
Cash flow
-17.1%
Cash-on-Cash Return
2.2%
Cap rate
0.4%
Rent to Value Ratio
Active
$2,749,000
3
bds
|
3
ba
|
2,255
sqft
|
built
1988
2901 S Ocean Blvd, Highland Beach, FL 33487
$-13,204
Cash flow
-25.1%
Cash-on-Cash Return
0.4%
Cap rate
0.3%
Rent to Value Ratio
Active
$534,988
3
bds
|
3
ba
|
2,222
sqft
|
built
2018
11997 Park Central, Royal Palm Beach, FL 33411
$-1,300
Cash flow
-12.7%
Cash-on-Cash Return
3.2%
Cap rate
0.7%
Rent to Value Ratio
Active
$679,000
3
bds
|
2
ba
|
1,590
sqft
|
built
1991
113 Winter Club Ct, Palm Beach Gardens, FL 33410
$-1,660
Cash flow
-12.8%
Cash-on-Cash Return
3.2%
Cap rate
0.6%
Rent to Value Ratio
Active
$3,389,000
3
bds
|
3
ba
|
2,385
sqft
|
built
1982
2727 S Ocean Blvd, Highland Beach, FL 33487
$-14,394
Cash flow
-22.2%
Cash-on-Cash Return
1.1%
Cap rate
0.3%
Rent to Value Ratio
Active
$3,650,000
4
bds
|
6
ba
|
4,993
sqft
|
built
1998
107 Saint Edward Pl, Palm Beach Gardens, FL 33418
$-16,281
Cash flow
-23.3%
Cash-on-Cash Return
0.8%
Cap rate
0.2%
Rent to Value Ratio
Active
$579,900
3
bds
|
2
ba
|
2,000
sqft
|
built
1997
2803 Kittbuck Way, West Palm Beach, FL 33411
$-1,053
Cash flow
-9.5%
Cash-on-Cash Return
4.0%
Cap rate
0.6%
Rent to Value Ratio
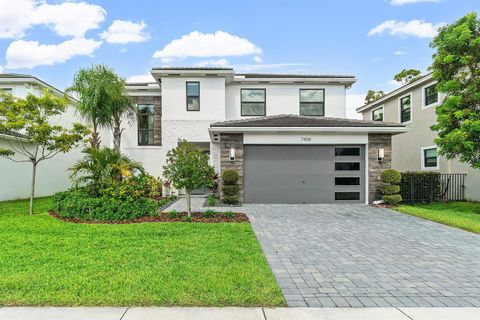
Active
$795,000
4
bds
|
3
ba
|
2,279
sqft
|
built
2022
7458 Estero Dr, Lake Worth, FL 33463
$-1,731
Cash flow
-11.4%
Cash-on-Cash Return
3.5%
Cap rate
0.6%
Rent to Value Ratio
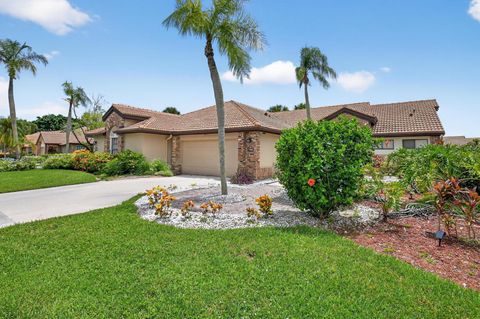
Active
$315,900
2
bds
|
2
ba
|
1,824
sqft
|
built
1987
7182 Le Chalet Blvd, Boynton Beach, FL 33472
$-899
Cash flow
-14.8%
Cash-on-Cash Return
2.7%
Cap rate
0.8%
Rent to Value Ratio
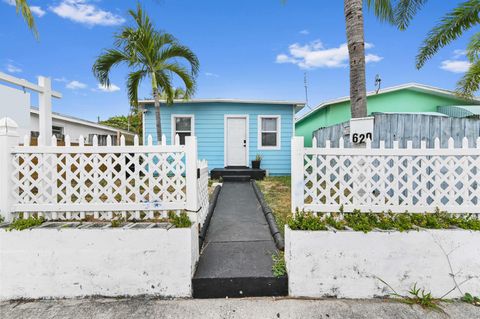
Active
$499,900
bds
|
0
ba
|
1,056
sqft
|
built
1954
629 N F St, Lake Worth, FL 33460
$-1,658
Cash flow
-17.3%
Cash-on-Cash Return
2.2%
Cap rate
0.4%
Rent to Value Ratio
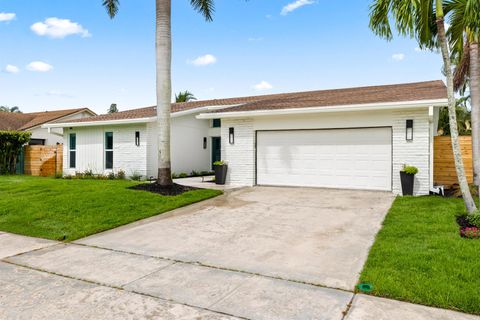
Active
$1,135,000
4
bds
|
3
ba
|
2,375
sqft
|
built
1978
3307 NW 28th Ter, Boca Raton, FL 33434
$-2,722
Cash flow
-12.5%
Cash-on-Cash Return
3.3%
Cap rate
0.5%
Rent to Value Ratio