Palm Beach County Investment Properties for Sale
Browse homes for sale and investment properties in Palm Beach County. Refine your search by price, property type, or more.
Best cash flowing properties in Palm Beach County
Active
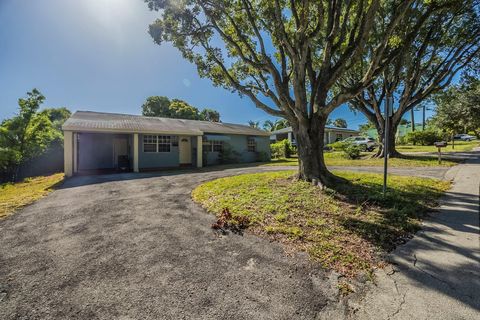
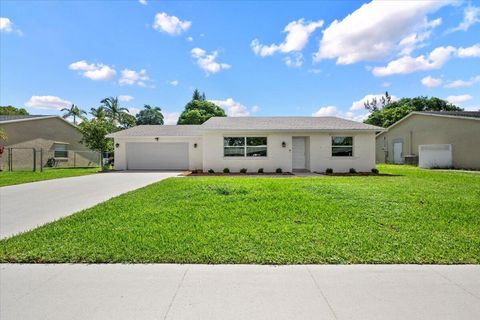
$350,000
3
bds
|
2
ba
|
1,406
sqft
|
built
1952
4106 N Terrace Dr, West Palm Beach, FL 33407
$-323
Cash flow
-4.8%
Cash-on-Cash Return
5.0%
Cap rate
0.8%
Rent to Value Ratio
Active
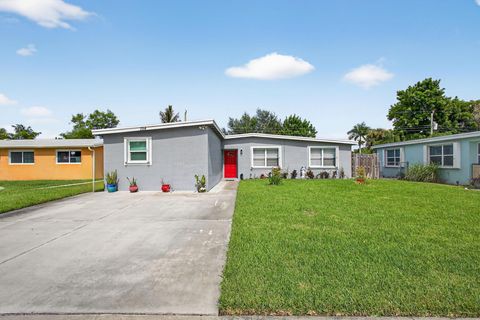
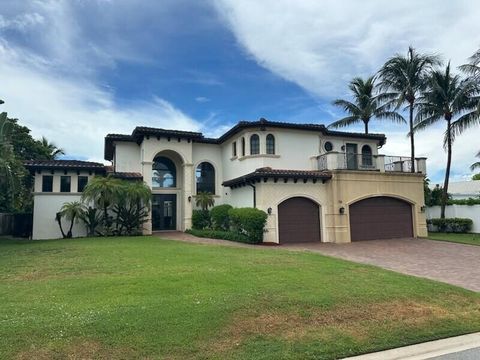
$489,000
3
bds
|
2
ba
|
1,363
sqft
|
built
1960
754 Hibiscus Dr, Royal Palm Beach, FL 33411
$-720
Cash flow
-7.7%
Cash-on-Cash Return
4.4%
Cap rate
0.6%
Rent to Value Ratio
5,261 out of 6,384 properties for sale in Palm Beach County
Limited Results Shown
Create a free account, or log in to reveal all property listings and enjoy the complete experience.
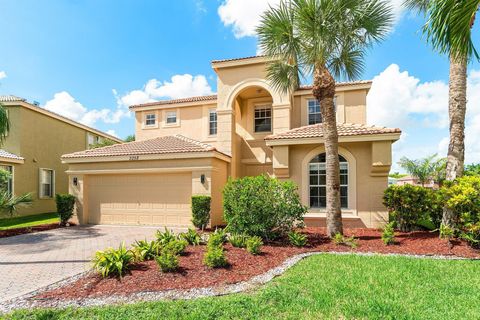
Active
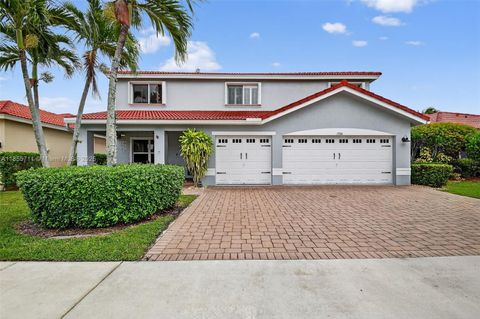
$680,000
4
bds
|
3
ba
|
2,755
sqft
|
built
2002
1506 Siena Ln, Boynton Beach, FL 33436
$-1,069
Cash flow
-8.2%
Cash-on-Cash Return
4.3%
Cap rate
0.7%
Rent to Value Ratio
Active
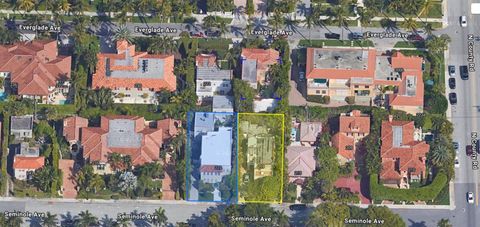
$6,000,000
5
bds
|
4
ba
|
2,995
sqft
|
built
1922
219 Seminole Ave, Palm Beach, FL 33480
$-31,923
Cash flow
-27.8%
Cash-on-Cash Return
-0.2%
Cap rate
0.1%
Rent to Value Ratio
Active
$600,000
3
bds
|
2
ba
|
1,446
sqft
|
built
1996
800 Uno Lago Dr, Juno Beach, FL 33408
$-1,882
Cash flow
-16.4%
Cash-on-Cash Return
2.4%
Cap rate
0.7%
Rent to Value Ratio

Active
$6,000,000
7
bds
|
7
ba
|
4,826
sqft
|
built
1922
223 Seminole Ave, Palm Beach, FL 33480
$-30,873
Cash flow
-26.8%
Cash-on-Cash Return
0.0%
Cap rate
0.1%
Rent to Value Ratio
Active
$1,249,000
4
bds
|
3
ba
|
2,828
sqft
|
built
1956
1401 Dale Ln, Delray Beach, FL 33444
$-3,231
Cash flow
-13.5%
Cash-on-Cash Return
3.0%
Cap rate
0.4%
Rent to Value Ratio
Active
$525,000
2
bds
|
2
ba
|
1,390
sqft
|
built
1959
2898 SE 1st Pl, Boynton Beach, FL 33435
$-1,077
Cash flow
-10.7%
Cash-on-Cash Return
3.7%
Cap rate
0.6%
Rent to Value Ratio
Active
$729,000
2
bds
|
3
ba
|
1,575
sqft
|
built
2006
2650 Lake Shore Dr, Riviera Beach, FL 33404
$-1,930
Cash flow
-13.8%
Cash-on-Cash Return
3.0%
Cap rate
0.8%
Rent to Value Ratio
Active
$450,000
2
bds
|
2
ba
|
1,165
sqft
|
built
2002
2040 Alta Meadows Ln, Delray Beach, FL 33444
$-887
Cash flow
-10.3%
Cash-on-Cash Return
3.8%
Cap rate
0.7%
Rent to Value Ratio
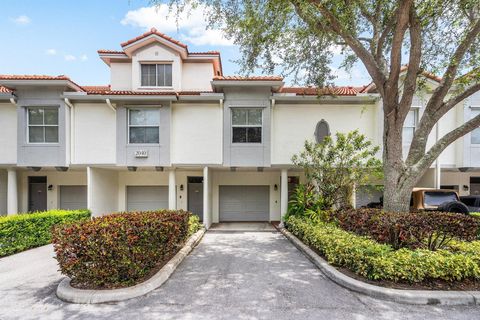
Active
$499,000
3
bds
|
3
ba
|
1,674
sqft
|
built
2003
4411 Lake Lucerne Cir, West Palm Beach, FL 33409
$-1,351
Cash flow
-14.1%
Cash-on-Cash Return
2.9%
Cap rate
0.6%
Rent to Value Ratio
Active
$4,200,000
6
bds
|
8
ba
|
6,243
sqft
|
built
2001
5590 Vintage Oaks Ter, Delray Beach, FL 33484
$-20,267
Cash flow
-25.2%
Cash-on-Cash Return
0.4%
Cap rate
0.2%
Rent to Value Ratio
Active
$675,000
4
bds
|
3
ba
|
2,387
sqft
|
built
1998
11472 Beacon Pointe Ln, Wellington, FL 33414
$-1,578
Cash flow
-12.2%
Cash-on-Cash Return
3.3%
Cap rate
0.6%
Rent to Value Ratio
Active
$820,000
6
bds
|
4
ba
|
3,424
sqft
|
built
2001
5024 Nautica Lake Cir, Greenacres, FL 33463
$-2,270
Cash flow
-14.4%
Cash-on-Cash Return
2.8%
Cap rate
0.5%
Rent to Value Ratio
Active
$369,700
3
bds
|
3
ba
|
1,441
sqft
|
built
2007
6639 Old Farm Trl, Boynton Beach, FL 33437
$-951
Cash flow
-13.4%
Cash-on-Cash Return
3.1%
Cap rate
0.8%
Rent to Value Ratio
Active
$829,000
3
bds
|
2
ba
|
2,261
sqft
|
built
2025
10546 Northbrook Cir, Palm Beach Gardens, FL 33412
$-3,100
Cash flow
-19.5%
Cash-on-Cash Return
1.7%
Cap rate
0.4%
Rent to Value Ratio
Active
$638,500
3
bds
|
2
ba
|
1,844
sqft
|
built
1997
3765 Cypress Lake Dr, Lake Worth, FL 33467
$-785
Cash flow
-6.4%
Cash-on-Cash Return
4.7%
Cap rate
0.7%
Rent to Value Ratio
Active
$549,900
3
bds
|
2
ba
|
1,600
sqft
|
built
1956
435 Park Ave, Lake Park, FL 33403
$-1,265
Cash flow
-12.0%
Cash-on-Cash Return
3.4%
Cap rate
0.5%
Rent to Value Ratio
Active
$2,495,000
3
bds
|
3
ba
|
2,095
sqft
|
built
1982
800 Andrews Ave, Delray Beach, FL 33483
$-10,168
Cash flow
-21.3%
Cash-on-Cash Return
1.3%
Cap rate
0.4%
Rent to Value Ratio
Active
$360,000
2
bds
|
1
ba
|
1,025
sqft
|
built
1986
5630 Coach House Cir, Boca Raton, FL 33486
$-1,042
Cash flow
-15.1%
Cash-on-Cash Return
2.7%
Cap rate
0.7%
Rent to Value Ratio
Active
$2,995,000
6
bds
|
3
ba
|
3,097
sqft
|
built
1976
17 NW 25th St, Delray Beach, FL 33444
$-8,756
Cash flow
-15.3%
Cash-on-Cash Return
2.6%
Cap rate
0.3%
Rent to Value Ratio
Active
$2,895,000
4
bds
|
4
ba
|
2,615
sqft
|
built
1954
210 Gregory Rd, West Palm Beach, FL 33405
$-10,361
Cash flow
-18.7%
Cash-on-Cash Return
1.9%
Cap rate
0.2%
Rent to Value Ratio
Active
$395,000
3
bds
|
2
ba
|
1,440
sqft
|
built
1972
501 SW 11th Pl, Boca Raton, FL 33432
$-1,125
Cash flow
-14.9%
Cash-on-Cash Return
2.7%
Cap rate
0.7%
Rent to Value Ratio
Active
$639,000
3
bds
|
3
ba
|
2,450
sqft
|
built
2022
8819 Antarus Dr, Lake Worth, FL 33467
$-1,561
Cash flow
-12.7%
Cash-on-Cash Return
3.2%
Cap rate
0.6%
Rent to Value Ratio
Active
$315,000
2
bds
|
2
ba
|
920
sqft
|
built
1985
3130 Millwood Ter, Boca Raton, FL 33431
$-861
Cash flow
-14.3%
Cash-on-Cash Return
2.9%
Cap rate
0.8%
Rent to Value Ratio
Active
$534,500
3
bds
|
2
ba
|
1,604
sqft
|
built
1981
173 Bobwhite Rd, Royal Palm Beach, FL 33411
$-1,131
Cash flow
-11.0%
Cash-on-Cash Return
3.6%
Cap rate
0.6%
Rent to Value Ratio
Active
$4,595,000
4
bds
|
6
ba
|
4,403
sqft
|
built
2007
136 Lighthouse Dr, Tequesta, FL 33469
$-20,506
Cash flow
-23.3%
Cash-on-Cash Return
0.8%
Cap rate
0.2%
Rent to Value Ratio
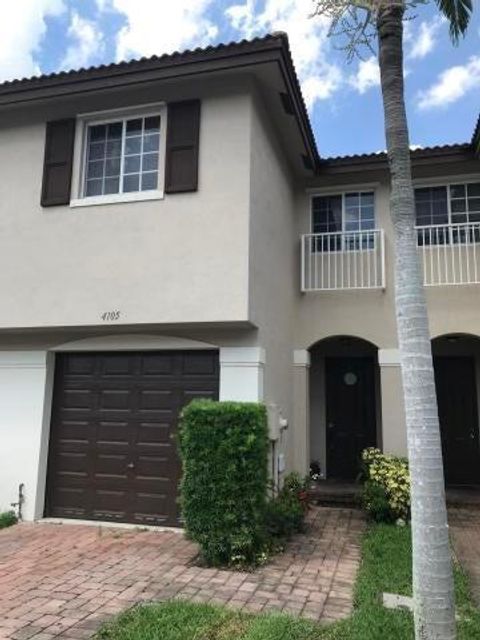
Active
$324,900
3
bds
|
3
ba
|
1,500
sqft
|
built
2007
4105 Napoli Lake Dr, Riviera Beach, FL 33410
$-751
Cash flow
-12.1%
Cash-on-Cash Return
3.4%
Cap rate
0.8%
Rent to Value Ratio
Active
$824,888
5
bds
|
3
ba
|
3,662
sqft
|
built
2004
2258 Balsan Way, Wellington, FL 33414
$-2,400
Cash flow
-15.2%
Cash-on-Cash Return
2.7%
Cap rate
0.6%
Rent to Value Ratio
Active
$625,000
3
bds
|
3
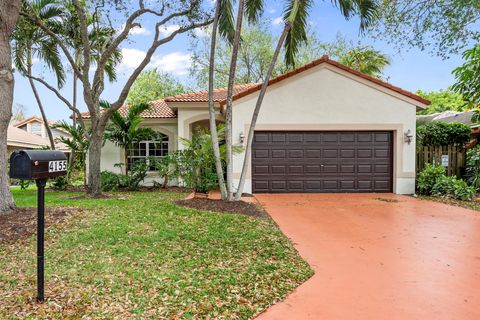
ba
|
1,515
sqft
|
built
1998
4155 NW 1st Ct, Delray Beach, FL 33445
$-1,665
Cash flow
-13.9%
Cash-on-Cash Return
3.0%
Cap rate
0.6%
Rent to Value Ratio
Active
$699,000
3
bds
|
2
ba
|
2,192
sqft
|
built
1996
6073 Wedgewood Village Cir, Lake Worth, FL 33463
$-1,729
Cash flow
-12.9%
Cash-on-Cash Return
3.2%
Cap rate
0.5%
Rent to Value Ratio
Active
$259,000
3
bds
|
2
ba
|
1,374
sqft
|
built
1995
5265 Brisata Cir, Boynton Beach, FL 33437
$-790
Cash flow
-15.9%
Cash-on-Cash Return
2.5%
Cap rate
1.0%
Rent to Value Ratio
Active
$629,000
3
bds
|
3
ba
|
2,304
sqft
|
built
2014
2891 Bellarosa Cir, Royal Palm Beach, FL 33411
$-1,386
Cash flow
-11.5%
Cash-on-Cash Return
3.5%
Cap rate
0.6%
Rent to Value Ratio
Active
$675,000
3
bds
|
4
ba
|
2,079
sqft
|
built
1990
5800 NW 24th Ave, Boca Raton, FL 33496
$-2,351
Cash flow
-18.2%
Cash-on-Cash Return
2.0%
Cap rate
0.6%
Rent to Value Ratio
Active
$495,000
2
bds
|
1
ba
|
731
sqft
|
built
1964
6520 N Ocean Blvd, Ocean Ridge, FL 33435
$-1,790
Cash flow
-18.9%
Cash-on-Cash Return
1.8%
Cap rate
0.6%
Rent to Value Ratio

Active
$400,000
3
bds
|
2
ba
|
936
sqft
|
built
1953
1020 Cherry Rd, West Palm Beach, FL 33409
$-947
Cash flow
-12.4%
Cash-on-Cash Return
3.3%
Cap rate
0.6%
Rent to Value Ratio
Active
$6,500,000
4
bds
|
3
ba
|
3,429
sqft
|
built
1956
118 Seville Rd, West Palm Beach, FL 33405
$-28,441
Cash flow
-22.8%
Cash-on-Cash Return
0.9%
Cap rate
0.2%
Rent to Value Ratio
Active
$670,000
3
bds
|
2
ba
|
1,590
sqft
|
built
1976
4692 Dolphin Dr, Lake Worth, FL 33463
$-1,459
Cash flow
-11.4%
Cash-on-Cash Return
3.5%
Cap rate
0.5%
Rent to Value Ratio
Active
$434,900
4
bds
|
2
ba
|
1,504
sqft
|
built
1984
6430 Pinyon Pine Ct, Lake Worth, FL 33462
$-761
Cash flow
-9.1%
Cash-on-Cash Return
4.0%
Cap rate
0.7%
Rent to Value Ratio
Active
$870,000
3
bds
|
3
ba
|
2,553
sqft
|
built
2004
8198 Spyglass Dr, West Palm Beach, FL 33412
$-2,527
Cash flow
-15.2%
Cash-on-Cash Return
2.7%
Cap rate
0.6%
Rent to Value Ratio