Palm Beach County Investment Properties for Sale
Browse homes for sale and investment properties in Palm Beach County. Refine your search by price, property type, or more.
Best cash flowing properties in Palm Beach County
Active
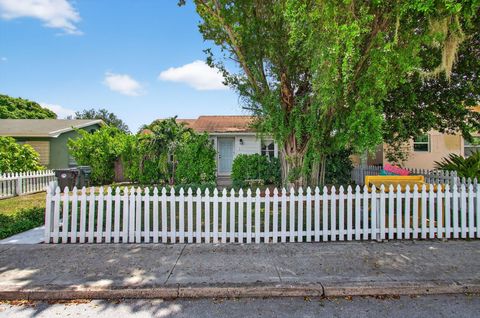
$350,000
2
bds
|
1
ba
|
830
sqft
|
built
1944
614 S E St, Lake Worth, FL 33460
$-179
Cash flow
-2.7%
Cash-on-Cash Return
5.5%
Cap rate
0.8%
Rent to Value Ratio
Active
$244,900
2
bds
|
2
ba
|
1,026
sqft
|
built
1978
5957 Forest Hill Blvd, West Palm Beach, FL 33415
$-225
Cash flow
-4.8%
Cash-on-Cash Return
5.0%
Cap rate
0.9%
Rent to Value Ratio
5,261 out of 6,384 properties for sale in Palm Beach County
Limited Results Shown
Create a free account, or log in to reveal all property listings and enjoy the complete experience.
Active
$2,100,000
4
bds
|
3
ba
|
1,898
sqft
|
built
1925
213 Seville Rd, West Palm Beach, FL 33405
$-6,935
Cash flow
-17.2%
Cash-on-Cash Return
2.2%
Cap rate
0.5%
Rent to Value Ratio
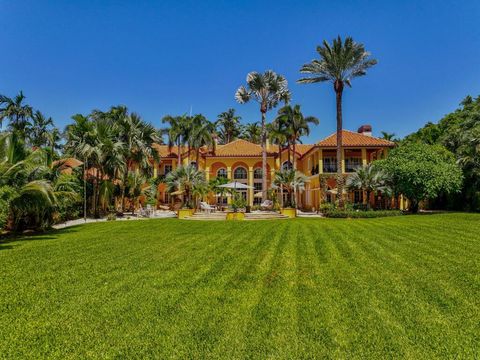
Active
$34,000,000
7
bds
|
10
ba
|
9,761
sqft
|
built
1994
1171 S Ocean Blvd, Delray Beach, FL 33483
$-194,851
Cash flow
-29.9%
Cash-on-Cash Return
-0.7%
Cap rate
0.0%
Rent to Value Ratio
Active
$745,000
3
bds
|
4
ba
|
2,235
sqft
|
built
2004
78 Stoney Dr, Palm Beach Gardens, FL 33410
$-2,081
Cash flow
-14.6%
Cash-on-Cash Return
2.8%
Cap rate
0.6%
Rent to Value Ratio
Active
$826,000
4
bds
|
4
ba
|
3,849
sqft
|
built
2019
5209 Beland Dr, Lake Worth, FL 33467
$-2,155
Cash flow
-13.6%
Cash-on-Cash Return
3.0%
Cap rate
0.6%
Rent to Value Ratio
Active
$250,000
2
bds
|
2
ba
|
1,206
sqft
|
built
1974
2425 Presidential Way, West Palm Beach, FL 33401
$-918
Cash flow
-19.2%
Cash-on-Cash Return
1.7%
Cap rate
1.0%
Rent to Value Ratio
Active
$2,950,000
3
bds
|
2
ba
|
2,493
sqft
|
built
2012
13633 Treasure Cove Cir, North Palm Beach, FL 33408
$-13,360
Cash flow
-23.6%
Cash-on-Cash Return
0.7%
Cap rate
0.3%
Rent to Value Ratio
Active
$400,000
3
bds
|
1
ba
|
1,331
sqft
|
built
1982
10103 Mikado Ln, Royal Palm Beach, FL 33411
$-441
Cash flow
-5.8%
Cash-on-Cash Return
4.8%
Cap rate
0.8%
Rent to Value Ratio
Active
$639,900
3
bds
|
2
ba
|
1,519
sqft
|
built
1973
598 Coral Way, Delray Beach, FL 33445
$-1,776
Cash flow
-14.5%
Cash-on-Cash Return
2.8%
Cap rate
0.5%
Rent to Value Ratio
Active
$250,000
2
bds
|
2
ba
|
1,248
sqft
|
built
1972
10821 N Military Trl, Palm Beach Gardens, FL 33410
$-630
Cash flow
-13.1%
Cash-on-Cash Return
3.1%
Cap rate
0.9%
Rent to Value Ratio
Active
$739,900
4
bds
|
2
ba
|
2,271
sqft
|
built
1972
1915 Laurel Ln, West Palm Beach, FL 33406
$-1,990
Cash flow
-14.0%
Cash-on-Cash Return
2.9%
Cap rate
0.5%
Rent to Value Ratio
Active
$995,000
2
bds
|
2
ba
|
1,100
sqft
|
built
1974
4511 S Ocean Blvd, Highland Beach, FL 33487
$-1,844
Cash flow
-9.7%
Cash-on-Cash Return
3.9%
Cap rate
0.7%
Rent to Value Ratio
Active
$234,900
3
bds
|
1
ba
|
1,000
sqft
|
built
1977
540 SW 9th St, Belle Glade, FL 33430
$-352
Cash flow
-7.8%
Cash-on-Cash Return
4.3%
Cap rate
0.6%
Rent to Value Ratio
Active
$60,000,000
13
bds
|
8
ba
|
13,055
sqft
|
built
2006
19721 118th Trl S, Boca Raton, FL 33498
$-302,396
Cash flow
-26.3%
Cash-on-Cash Return
0.1%
Cap rate
0.0%
Rent to Value Ratio
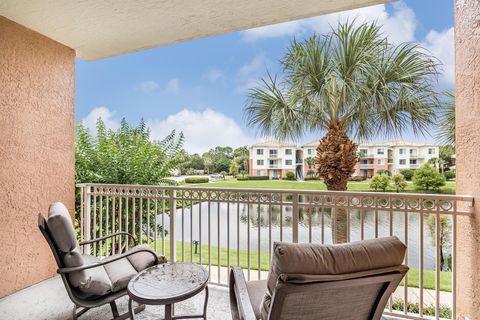
Active
$275,000
2
bds
|
2
ba
|
951
sqft
|
built
1989
2804 Waterview Cir, Palm Springs, FL 33461
$-654
Cash flow
-12.4%
Cash-on-Cash Return
3.3%
Cap rate
0.8%
Rent to Value Ratio
Active
$549,000
2
bds
|
2
ba
|
975
sqft
|
built
1968
6530 N Ocean Blvd, Ocean Ridge, FL 33435
$-1,839
Cash flow
-17.5%
Cash-on-Cash Return
2.1%
Cap rate
0.6%
Rent to Value Ratio
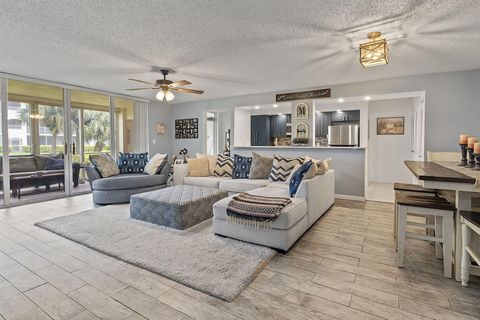
Active
$450,000
2
bds
|
2
ba
|
1,609
sqft
|
built
1988
7729 Forest Green Ln, Boynton Beach, FL 33436
$-1,131
Cash flow
-13.1%
Cash-on-Cash Return
3.1%
Cap rate
0.6%
Rent to Value Ratio
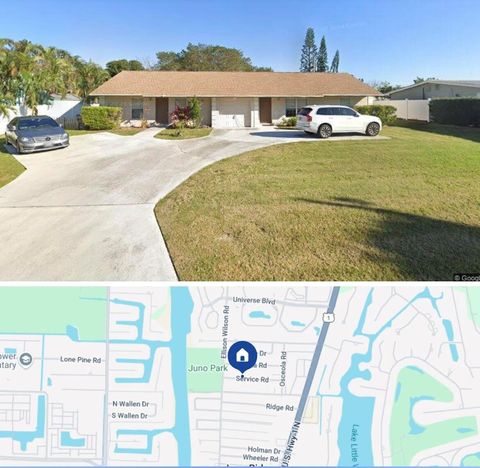
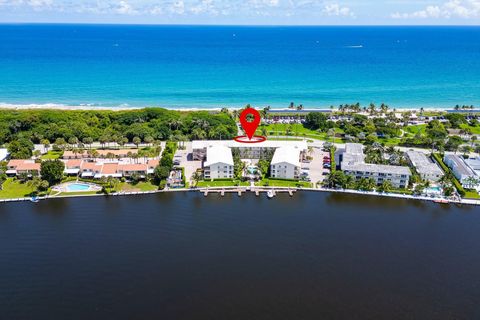
Active
$899,000
bds
|
0
ba
|
2,028
sqft
|
built
1996
1905 Service Rd, North Palm Beach, FL 33408
$-3,452
Cash flow
-20.0%
Cash-on-Cash Return
1.5%
Cap rate
0.3%
Rent to Value Ratio
Active
$5,995,000
6
bds
|
7
ba
|
5,611
sqft
|
built
2023
907 SW 37th Ct, Boynton Beach, FL 33435
$-31,641
Cash flow
-27.5%
Cash-on-Cash Return
-0.2%
Cap rate
0.1%
Rent to Value Ratio
Active
$499,900
2
bds
|
2
ba
|
1,315
sqft
|
built
1978
859 Jeffery St, Boca Raton, FL 33487
$-2,265
Cash flow
-23.6%
Cash-on-Cash Return
0.7%
Cap rate
0.6%
Rent to Value Ratio
Active
$899,000
3
bds
|
3
ba
|
2,161
sqft
|
built
2012
1570 NW 48th Pl, Boca Raton, FL 33431
$-2,703
Cash flow
-15.7%
Cash-on-Cash Return
2.5%
Cap rate
0.5%
Rent to Value Ratio
Active
$2,075,000
5
bds
|
7
ba
|
4,609
sqft
|
built
2022
8115 Laurel Falls Dr, Boca Raton, FL 33496
$-8,857
Cash flow
-22.3%
Cash-on-Cash Return
1.0%
Cap rate
0.3%
Rent to Value Ratio
Active
$469,700
3
bds
|
3
ba
|
1,603
sqft
|
built
1988
21380 Pagosa Ct, Boca Raton, FL 33486
$-1,321
Cash flow
-14.7%
Cash-on-Cash Return
2.8%
Cap rate
0.7%
Rent to Value Ratio
Active
$999,999
3
bds
|
3
ba
|
2,379
sqft
|
built
2015
8633 Sunbeam Mountain Ter, Boynton Beach, FL 33473
$-1,876
Cash flow
-9.8%
Cash-on-Cash Return
3.9%
Cap rate
0.7%
Rent to Value Ratio
Active
$599,000
3
bds
|
3
ba
|
1,454
sqft
|
built
1957
121 Bayberry Dr, Lake Park, FL 33403
$-584
Cash flow
-5.1%
Cash-on-Cash Return
5.0%
Cap rate
0.7%
Rent to Value Ratio
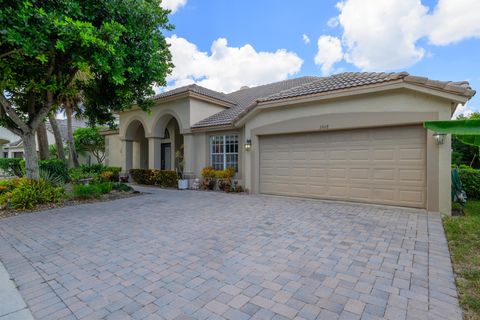
Active
$739,000
3
bds
|
2
ba
|
1,970
sqft
|
built
1995
13633 83rd Ln N, West Palm Beach, FL 33412
$-1,552
Cash flow
-11.0%
Cash-on-Cash Return
3.6%
Cap rate
0.5%
Rent to Value Ratio
Active
$665,000
3
bds
|
2
ba
|
1,745
sqft
|
built
1984
6290 Sweet Maple Ln, Boca Raton, FL 33433
$-1,114
Cash flow
-8.7%
Cash-on-Cash Return
4.1%
Cap rate
0.6%
Rent to Value Ratio
Active
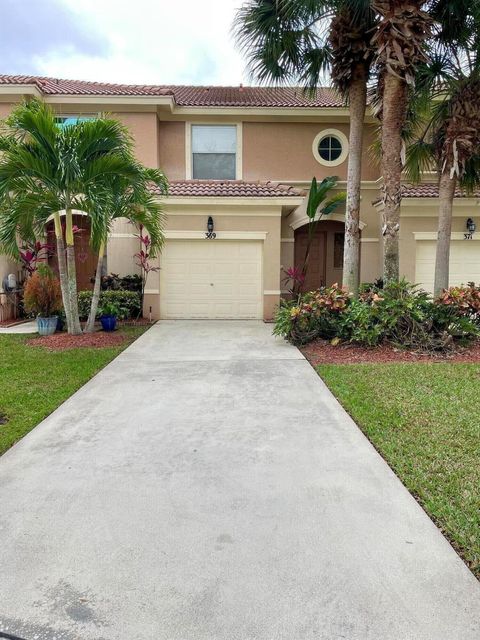
$379,000
2
bds
|
3
ba
|
1,448
sqft
|
built
2002
369 River Bluff Ln, Royal Palm Beach, FL 33411
$-650
Cash flow
-8.9%
Cash-on-Cash Return
4.1%
Cap rate
0.7%
Rent to Value Ratio
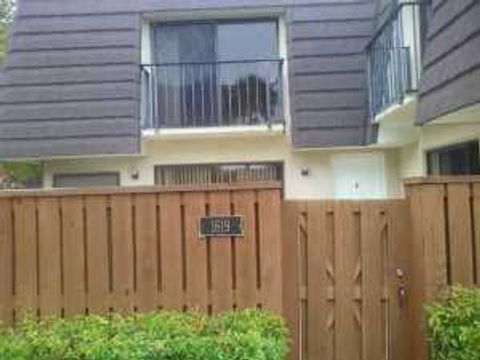
Active
$435,000
2
bds
|
3
ba
|
1,188
sqft
|
built
1984
1619 16th Ct, Jupiter, FL 33477
$-1,211
Cash flow
-14.5%
Cash-on-Cash Return
2.8%
Cap rate
0.7%
Rent to Value Ratio
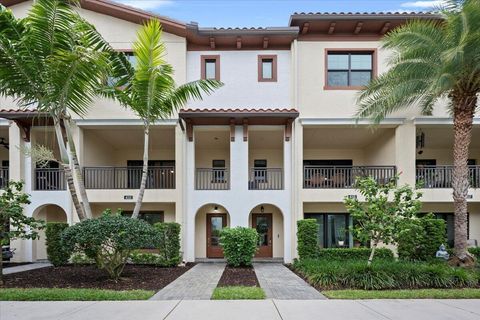
Active
$749,000
4
bds
|
4
ba
|
2,252
sqft
|
built
2018
4113 Faraday Way, Palm Beach Gardens, FL 33418
$-2,228
Cash flow
-15.5%
Cash-on-Cash Return
2.6%
Cap rate
0.6%
Rent to Value Ratio
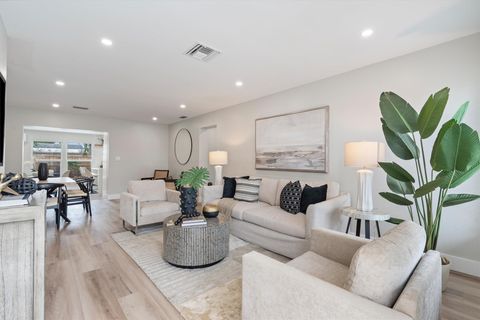
Active
$569,000
4
bds
|
3
ba
|
1,463
sqft
|
built
1962
9361 Bellewood St, Palm Beach Gardens, FL 33410
$-1,470
Cash flow
-13.5%
Cash-on-Cash Return
3.0%
Cap rate
0.5%
Rent to Value Ratio
Active
$319,000
3
bds
|
2
ba
|
1,620
sqft
|
built
1982
12524 Shoreline Dr, Wellington, FL 33414
$-857
Cash flow
-14.0%
Cash-on-Cash Return
2.9%
Cap rate
0.9%
Rent to Value Ratio
Active
$325,000
2
bds
|
2
ba
|
1,288
sqft
|
built
1987
600 Crosswinds Dr, Greenacres, FL 33413
$-1,302
Cash flow
-20.9%
Cash-on-Cash Return
1.3%
Cap rate
0.7%
Rent to Value Ratio
Active
$1,299,000
3
bds
|
2
ba
|
1,240
sqft
|
built
1950
353 Gregory Rd, West Palm Beach, FL 33405
$-5,022
Cash flow
-20.2%
Cash-on-Cash Return
1.5%
Cap rate
0.3%
Rent to Value Ratio
Active
$398,900
2
bds
|
2
ba
|
1,143
sqft
|
built
1975
336 Golfview Rd, North Palm Beach, FL 33408
$-1,662
Cash flow
-21.7%
Cash-on-Cash Return
1.1%
Cap rate
0.8%
Rent to Value Ratio
Active
$11,800,000
6
bds
|
8
ba
|
7,728
sqft
|
built
2000
12267 Channel Dr, North Palm Beach, FL 33408
$-67,428
Cash flow
-29.8%
Cash-on-Cash Return
-0.7%
Cap rate
0.1%
Rent to Value Ratio
Active
$409,000
2
bds
|
2
ba
|
1,193
sqft
|
built
2004
6204 Myrtlewood Cir W, Palm Beach Gardens, FL 33418
$-1,293
Cash flow
-16.5%
Cash-on-Cash Return
2.4%
Cap rate
0.6%
Rent to Value Ratio
Active
$360,000
2
bds
|
2
ba
|
1,511
sqft
|
built
1989
110 Half Moon Cir, Hypoluxo, FL 33462
$-1,265
Cash flow
-18.3%
Cash-on-Cash Return
1.9%
Cap rate
0.8%
Rent to Value Ratio
Active
$670,000
5
bds
|
3
ba
|
2,887
sqft
|
built
2005
3968 W Hamilton Ky, West Palm Beach, FL 33411
$-1,199
Cash flow
-9.3%
Cash-on-Cash Return
4.0%
Cap rate
0.7%
Rent to Value Ratio