Volusia County Investment Properties for Sale
Browse homes for sale and investment properties in Volusia County. Refine your search by price, property type, or more.
Best cash flowing properties in Volusia County

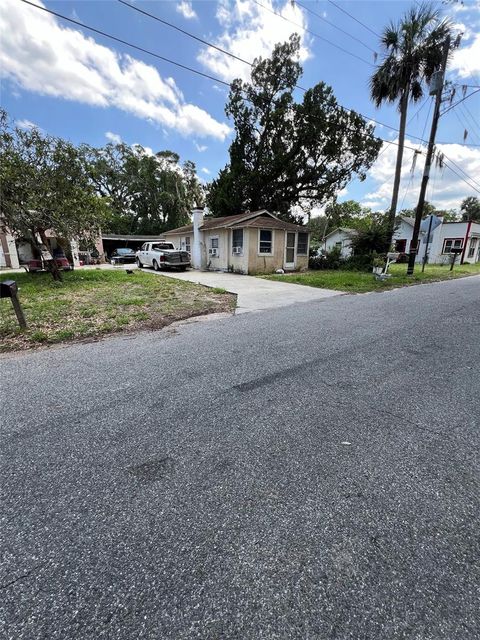
Active
$60,000
2
bds
|
1
ba
|
468
sqft
|
built
1924
517 Wallace St, Daytona Beach, FL 32114
$807
Cash flow
15.7%
Cash-on-Cash Return
16.1%
Cap rate
2.2%
Rent to Value Ratio
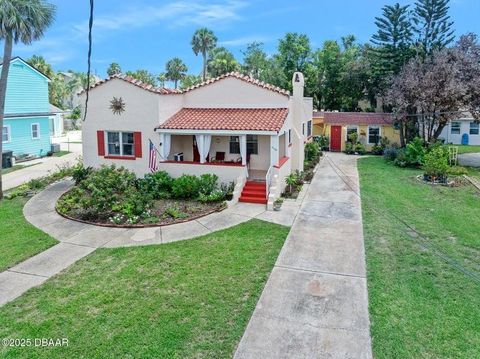
Active
$80,000
2
bds
|
1
ba
|
527
sqft
|
built
1925
521 Wallace St, Daytona Beach, FL 32114
$414
Cash flow
27.0%
Cash-on-Cash Return
12.4%
Cap rate
1.6%
Rent to Value Ratio
952 out of 1,337 properties for sale in Volusia County
Limited Results Shown
Create a free account, or log in to reveal all property listings and enjoy the complete experience.
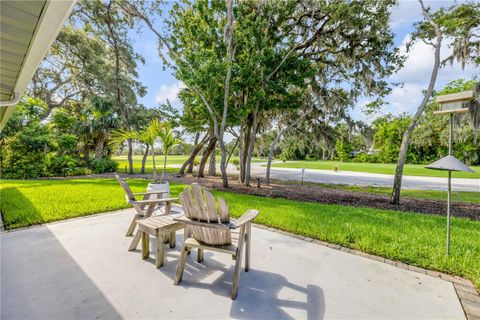
Active
$450,000
4
bds
|
3
ba
|
2,037
sqft
|
built
1918
918 N Wild Olive Ave, Daytona Beach, FL 32118
$-1,307
Cash flow
-15.2%
Cash-on-Cash Return
2.7%
Cap rate
0.4%
Rent to Value Ratio

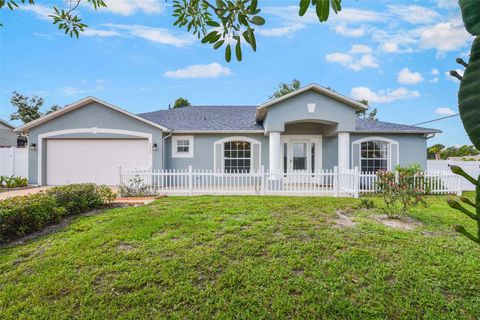
Active
$515,000
3
bds
|
2
ba
|
2,100
sqft
|
built
1996
4 Oceans West Blvd, Daytona Beach Shores, FL 32118
$-622
Cash flow
-6.3%
Cash-on-Cash Return
4.7%
Cap rate
0.6%
Rent to Value Ratio
Active
$785,000
3
bds
|
3
ba
|
2,731
sqft
|
built
1987
544 Bottlebrush Ct, New Smyrna Beach, FL 32168
$-1,469
Cash flow
-9.8%
Cash-on-Cash Return
3.9%
Cap rate
0.6%
Rent to Value Ratio
Active
$355,000
3
bds
|
2
ba
|
2,020
sqft
|
built
2002
1819 E Chapel Dr, Deltona, FL 32738
$-429
Cash flow
-6.3%
Cash-on-Cash Return
4.7%
Cap rate
0.6%
Rent to Value Ratio
Active
$279,900
1
bds
|
1
ba
|
459
sqft
|
built
1977
3700 S Atlantic Ave, New Smyrna Beach, FL 32169
$-744
Cash flow
-13.9%
Cash-on-Cash Return
3.0%
Cap rate
0.6%
Rent to Value Ratio

Active
$100,000
2
bds
|
1
ba
|
760
sqft
|
built
1922
520 Wallace St, Daytona Beach, FL 32114
$354
Cash flow
18.5%
Cash-on-Cash Return
10.4%
Cap rate
1.4%
Rent to Value Ratio
Active
$254,900
2
bds
|
2
ba
|
1,055
sqft
|
built
2022
118 Tuscany Villas Dr, Edgewater, FL 32141
$-374
Cash flow
-7.7%
Cash-on-Cash Return
4.4%
Cap rate
0.8%
Rent to Value Ratio
Active
$259,900
3
bds
|
2
ba
|
1,078
sqft
|
built
1997
2831 Fifer Dr, Deltona, FL 32738
$-290
Cash flow
-5.8%
Cash-on-Cash Return
4.8%
Cap rate
0.7%
Rent to Value Ratio
Active
$225,000
3
bds
|
2
ba
|
1,248
sqft
|
built
1970
916 Kathy St, Daytona Beach, FL 32114
$-15
Cash flow
-0.3%
Cash-on-Cash Return
6.1%
Cap rate
0.8%
Rent to Value Ratio
Active
$399,000
3
bds
|
2
ba
|
1,538
sqft
|
built
2006
850 Wingate Trl, Port Orange, FL 32128
$-828
Cash flow
-10.8%
Cash-on-Cash Return
3.7%
Cap rate
0.6%
Rent to Value Ratio
Active
$524,999
4
bds
|
4
ba
|
2,338
sqft
|
built
2022
3121 Portofino Blvd, New Smyrna Beach, FL 32168
$-1,409
Cash flow
-14.0%
Cash-on-Cash Return
2.9%
Cap rate
0.5%
Rent to Value Ratio
Active
$325,000
1
bds
|
1
ba
|
690
sqft
|
built
1981
4141 S Atlantic Ave, New Smyrna Beach, FL 32169
$-276
Cash flow
-4.4%
Cash-on-Cash Return
5.1%
Cap rate
0.7%
Rent to Value Ratio
Active
$282,000
3
bds
|
2
ba
|
1,846
sqft
|
built
1966
1320 E Lombardy Dr, Deltona, FL 32725
$-459
Cash flow
-8.5%
Cash-on-Cash Return
4.2%
Cap rate
0.6%
Rent to Value Ratio
Active
$650,000
5
bds
|
6
ba
|
3,240
sqft
|
built
2005
1650 Riverside Dr, Holly Hill, FL 32117
$-864
Cash flow
-6.9%
Cash-on-Cash Return
4.6%
Cap rate
0.6%
Rent to Value Ratio

Active
$859,500
3
bds
|
4
ba
|
4,332
sqft
|
built
2001
3428 Longleaf Rd, Ormond Beach, FL 32174
$-1,125
Cash flow
-6.8%
Cash-on-Cash Return
4.6%
Cap rate
0.6%
Rent to Value Ratio

Active
$569,000
3
bds
|
2
ba
|
1,758
sqft
|
built
1972
418 Acacia Cir, Port Orange, FL 32127
$-1,033
Cash flow
-9.5%
Cash-on-Cash Return
4.0%
Cap rate
0.6%
Rent to Value Ratio
Active
$465,000
3
bds
|
3
ba
|
2,142
sqft
|
built
1964
38 Fairway Cir, New Smyrna Beach, FL 32168
$-632
Cash flow
-7.1%
Cash-on-Cash Return
4.5%
Cap rate
0.7%
Rent to Value Ratio
Active
$649,500
3
bds
|
2
ba
|
2,002
sqft
|
built
2007
461 Luna Bella Ln, New Smyrna Beach, FL 32168
$-1,856
Cash flow
-14.9%
Cash-on-Cash Return
2.7%
Cap rate
0.4%
Rent to Value Ratio
Active
$325,000
2
bds
|
2
ba
|
1,653
sqft
|
built
1993
916 Ashmeade Ct, Port Orange, FL 32127
$-457
Cash flow
-7.3%
Cash-on-Cash Return
4.5%
Cap rate
0.7%
Rent to Value Ratio

Active
$350,000
3
bds
|
2
ba
|
1,772
sqft
|
built
2022
1094 Lolita St, Orange City, FL 32763
$-735
Cash flow
-11.0%
Cash-on-Cash Return
3.6%
Cap rate
0.6%
Rent to Value Ratio
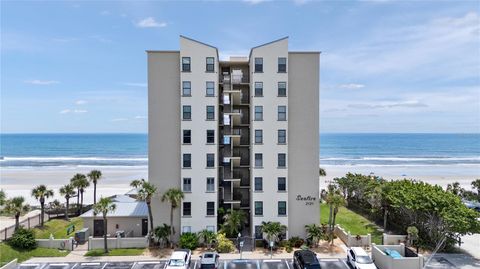
Active
$750,000
2
bds
|
2
ba
|
1,460
sqft
|
built
1982
2121 Hill St, New Smyrna Beach, FL 32169
$-3,334
Cash flow
-23.2%
Cash-on-Cash Return
0.8%
Cap rate
0.4%
Rent to Value Ratio
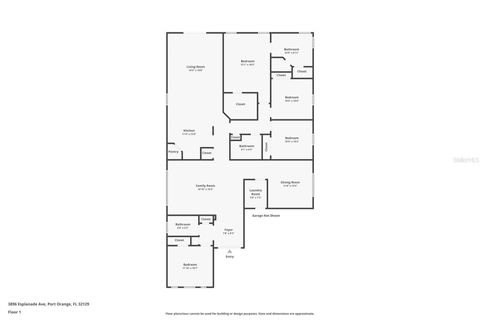
Active
$389,000
4
bds
|
3
ba
|
2,281
sqft
|
built
2007
3896 Esplanade Ave, Port Orange, FL 32129
$-444
Cash flow
-6.0%
Cash-on-Cash Return
4.8%
Cap rate
0.7%
Rent to Value Ratio

Active
$329,900
3
bds
|
2
ba
|
1,670
sqft
|
built
2004
3132 Connemara Dr, Ormond Beach, FL 32174
$-571
Cash flow
-9.0%
Cash-on-Cash Return
4.1%
Cap rate
0.7%
Rent to Value Ratio
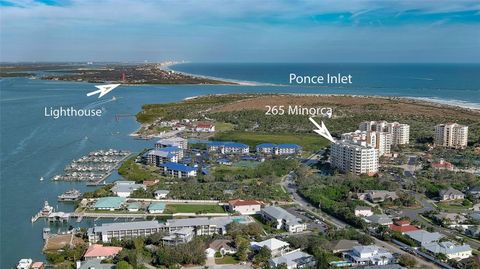
Active
$995,000
3
bds
|
2
ba
|
1,655
sqft
|
built
2005
265 Minorca Beach Way, New Smyrna Beach, FL 32169
$-3,189
Cash flow
-16.7%
Cash-on-Cash Return
2.3%
Cap rate
0.4%
Rent to Value Ratio

Active
$465,000
2
bds
|
3
ba
|
1,552
sqft
|
built
2003
3000 Ocean Shore Blvd, Ormond Beach, FL 32176
$-2,075
Cash flow
-23.3%
Cash-on-Cash Return
0.8%
Cap rate
0.5%
Rent to Value Ratio
Active
$300,000
3
bds
|
3
ba
|
1,914
sqft
|
built
1981
8 Rising Moon Trl, Ormond Beach, FL 32174
$-57
Cash flow
-1.0%
Cash-on-Cash Return
5.9%
Cap rate
0.8%
Rent to Value Ratio

Active
$279,900
3
bds
|
2
ba
|
1,122
sqft
|
built
1986
925 Roswell Ter, Deltona, FL 32738
$-473
Cash flow
-8.8%
Cash-on-Cash Return
4.1%
Cap rate
0.6%
Rent to Value Ratio
Active
$485,000
3
bds
|
2
ba
|
2,100
sqft
|
built
1960
39 Benjamin Dr, Ormond Beach, FL 32176
$-1,104
Cash flow
-11.9%
Cash-on-Cash Return
3.4%
Cap rate
0.5%
Rent to Value Ratio
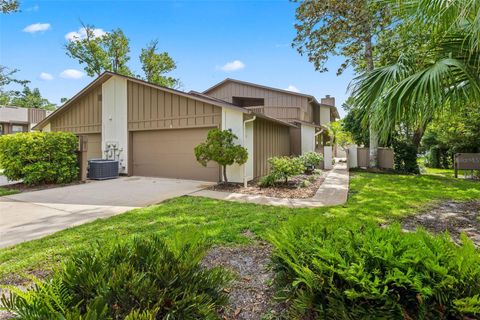
Active
$544,300
3
bds
|
4
ba
|
2,383
sqft
|
built
1999
6230 Cranberry Dr, Port Orange, FL 32127
$-1,282
Cash flow
-12.3%
Cash-on-Cash Return
3.3%
Cap rate
0.6%
Rent to Value Ratio

Active
$344,000
2
bds
|
3
ba
|
1,328
sqft
|
built
1980
122 Cedar Dunes Dr, New Smyrna Beach, FL 32169
$-865
Cash flow
-13.1%
Cash-on-Cash Return
3.1%
Cap rate
0.6%
Rent to Value Ratio

Active
$1,699,000
2
bds
|
1
ba
|
1,531
sqft
|
built
1955
8 Richmond Dr, New Smyrna Beach, FL 32169
$-7,276
Cash flow
-22.3%
Cash-on-Cash Return
1.0%
Cap rate
0.2%
Rent to Value Ratio
Active
$285,000
3
bds
|
2
ba
|
1,244
sqft
|
built
1973
1810 Western Rd, South Daytona, FL 32119
$-286
Cash flow
-5.2%
Cash-on-Cash Return
4.9%
Cap rate
0.6%
Rent to Value Ratio
Active
$484,900
2
bds
|
2
ba
|
1,396
sqft
|
built
1951
812 Faulkner St, New Smyrna Beach, FL 32168
$-1,032
Cash flow
-11.1%
Cash-on-Cash Return
3.6%
Cap rate
0.6%
Rent to Value Ratio

Active
$367,000
3
bds
|
2
ba
|
1,774
sqft
|
built
2017
2672 Star Coral Ln, New Smyrna Beach, FL 32168
$-657
Cash flow
-9.3%
Cash-on-Cash Return
4.0%
Cap rate
0.6%
Rent to Value Ratio
Active
$650,000
3
bds
|
3
ba
|
2,140
sqft
|
built
2004
2055 S Atlantic Ave, Daytona Beach Shores, FL 32118
$-2,365
Cash flow
-19.0%
Cash-on-Cash Return
1.8%
Cap rate
0.6%
Rent to Value Ratio
Active
$369,000
3
bds
|
2
ba
|
1,482
sqft
|
built
2001
620 Middlebury Loop, New Smyrna Beach, FL 32168
$-782
Cash flow
-11.1%
Cash-on-Cash Return
3.6%
Cap rate
0.6%
Rent to Value Ratio
Active
$675,000
2
bds
|
2
ba
|
1,385
sqft
|
built
1984
4139 S Atlantic Ave, New Smyrna Beach, FL 32169
$-1,895
Cash flow
-14.6%
Cash-on-Cash Return
2.8%
Cap rate
0.5%
Rent to Value Ratio
Active
$524,900
3
bds
|
3
ba
|
2,174
sqft
|
built
2007
2250 Davis Dr, New Smyrna Beach, FL 32168
$-1,054
Cash flow
-10.5%
Cash-on-Cash Return
3.7%
Cap rate
0.5%
Rent to Value Ratio