Hinsdale, IL Investment Properties for Sale
Browse homes for sale and investment properties in Hinsdale, IL. Refine your search by price, property type, or more.
Best cash flowing properties in Hinsdale, IL
Active
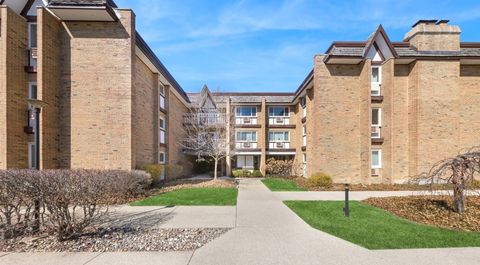
$320,000
2
bds
|
2
ba
|
1,163
sqft
|
built
1968
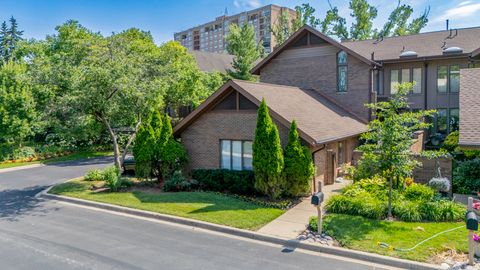
300 Claymoor, Hinsdale, IL 60521
$-629
Cash flow
-10.3%
Cash-on-Cash Return
3.3%
Cap rate
0.7%
Rent to Value Ratio
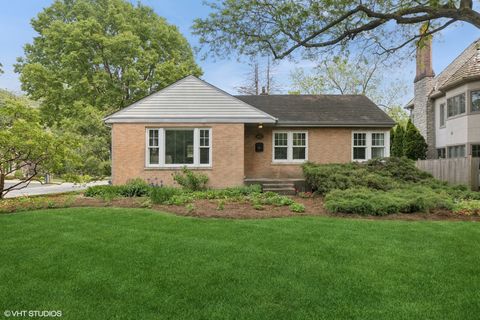
Active
$569,000
2
bds
|
1
ba
|
1,063
sqft
|
built
1948
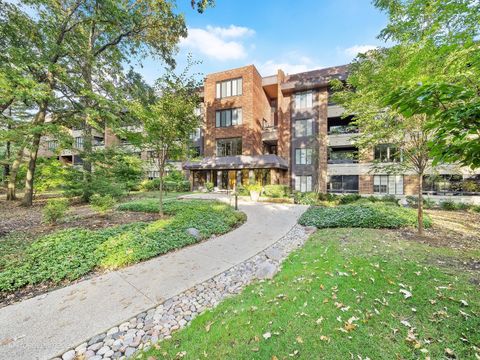
625 N County Line Rd, Hinsdale, IL 60521
$-1,072
Cash flow
-9.8%
Cash-on-Cash Return
3.4%
Cap rate
0.6%
Rent to Value Ratio
18 out of 35 properties for sale in Hinsdale, IL
Limited Results Shown
Create a free account, or log in to reveal all property listings and enjoy the complete experience.
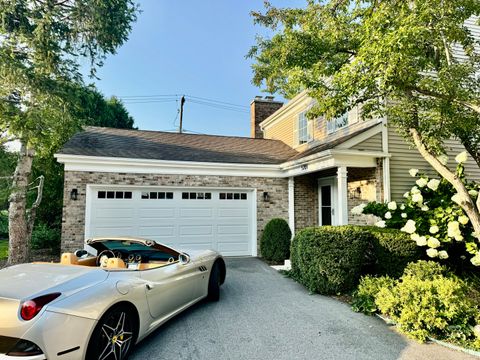
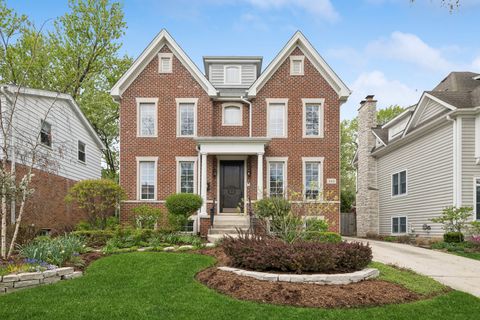
Active
$799,999
3
bds
|
3
ba
|
3,000
sqft
|
built
1986
5701 Foxgate Ln, Hinsdale, IL 60521
$-2,539
Cash flow
-16.6%
Cash-on-Cash Return
1.9%
Cap rate
0.4%
Rent to Value Ratio
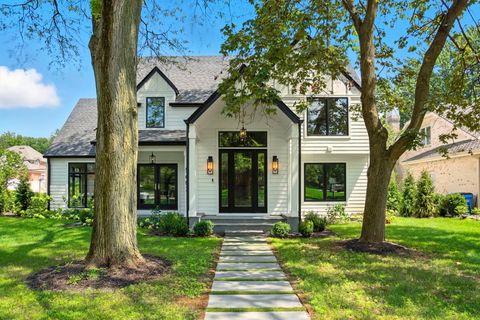
Active
$1,799,999
4
bds
|
6
ba
|
5,300
sqft
|
built
1954
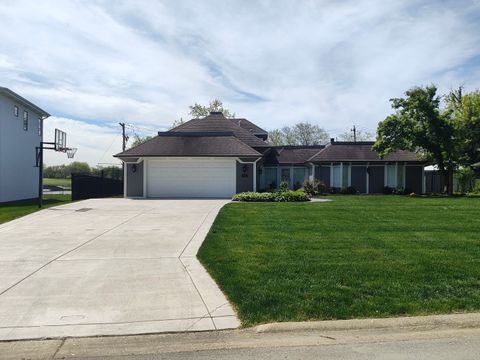
5603 S Garfield St, Hinsdale, IL 60521
$-2,897
Cash flow
-8.4%
Cash-on-Cash Return
3.7%
Cap rate
0.5%
Rent to Value Ratio
Active
$1,499,999
4
bds
|
6
ba
|
2,583
sqft
|
built
2003
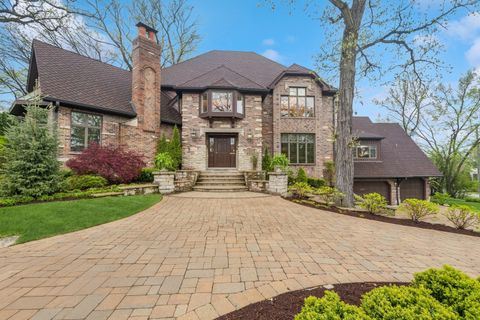
840 S Madison St, Hinsdale, IL 60521
$-5,408
Cash flow
-18.8%
Cash-on-Cash Return
1.4%
Cap rate
0.3%
Rent to Value Ratio
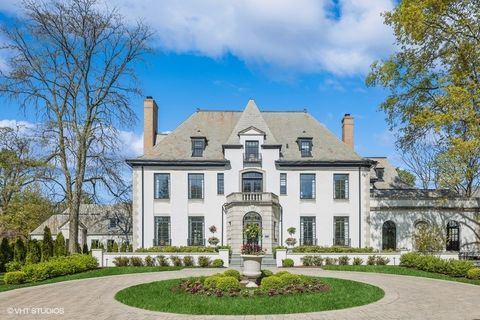
Active
$4,995,000
6
bds
|
7
ba
|
0
sqft
|
built
1924
420 S Park Ave, Hinsdale, IL 60521
$-22,557
Cash flow
-23.6%
Cash-on-Cash Return
0.3%
Cap rate
0.2%
Rent to Value Ratio
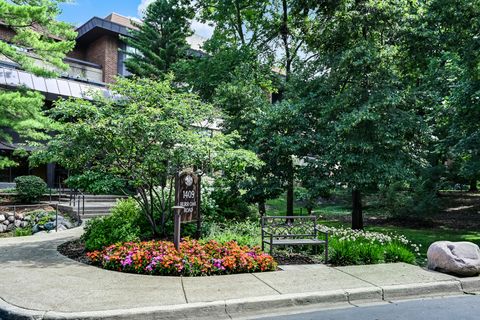
Active
$729,000
2
bds
|
2
ba
|
1,932
sqft
|
built
1978
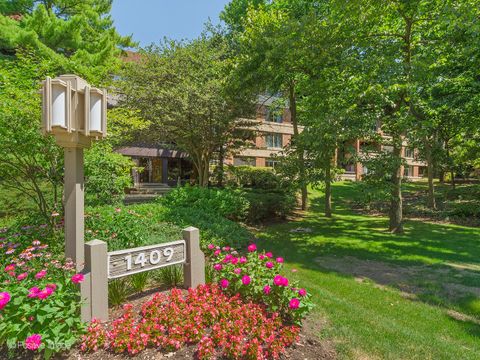
1409 Burr Oak Rd, Hinsdale, IL 60521
$-2,298
Cash flow
-16.4%
Cash-on-Cash Return
1.9%
Cap rate
0.6%
Rent to Value Ratio

Active
$595,000
2
bds
|
2
ba
|
1,932
sqft
|
built
1978
1409 Burr Oak Rd, Hinsdale, IL 60521
$-1,470
Cash flow
-12.9%
Cash-on-Cash Return
2.7%
Cap rate
0.7%
Rent to Value Ratio

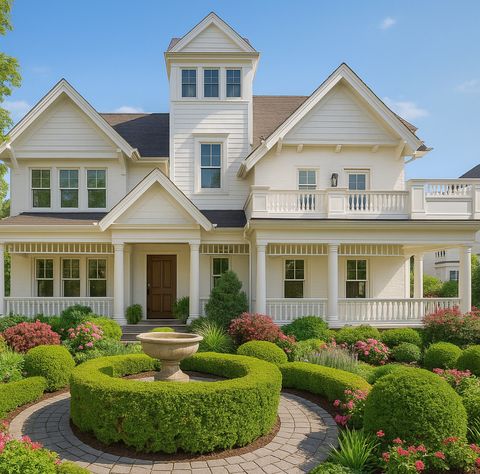
Active
$3,599,000
5
bds
|
7
ba
|
7,800
sqft
|
built
2016
125 S Madison St, Hinsdale, IL 60521
$-14,821
Cash flow
-21.5%
Cash-on-Cash Return
0.7%
Cap rate
0.2%
Rent to Value Ratio
Active
$2,999,000
5
bds
|
7
ba
|
7,072
sqft
|
built
1998
125 N Park Ave, Hinsdale, IL 60521
$-13,259
Cash flow
-23.1%
Cash-on-Cash Return
0.4%
Cap rate
0.2%
Rent to Value Ratio
Active
$1,100,000
4
bds
|
4
ba
|
2,968
sqft
|
built
1956
544 W 58th Pl, Hinsdale, IL 60521
$-1,994
Cash flow
-9.5%
Cash-on-Cash Return
3.5%
Cap rate
0.5%
Rent to Value Ratio
Active
$2,750,000
5
bds
|
7
ba
|
6,432
sqft
|
built
1989
440 Woodside Ave, Hinsdale, IL 60521
$-12,246
Cash flow
-23.2%
Cash-on-Cash Return
0.3%
Cap rate
0.2%
Rent to Value Ratio

Active
$1,349,900
5
bds
|
6
ba
|
5,022
sqft
|
built
1952
608 W 55th St, Hinsdale, IL 60521
$-1,796
Cash flow
-6.9%
Cash-on-Cash Return
4.1%
Cap rate
0.6%
Rent to Value Ratio
Active
$1,289,000
4
bds
|
6
ba
|
6,568
sqft
|
built
1988
1210 Hawthorne Ln, Hinsdale, IL 60521
$-3,220
Cash flow
-13.0%
Cash-on-Cash Return
2.7%
Cap rate
0.6%
Rent to Value Ratio
Active
$549,900
2
bds
|
3
ba
|
1,876
sqft
|
built
1977
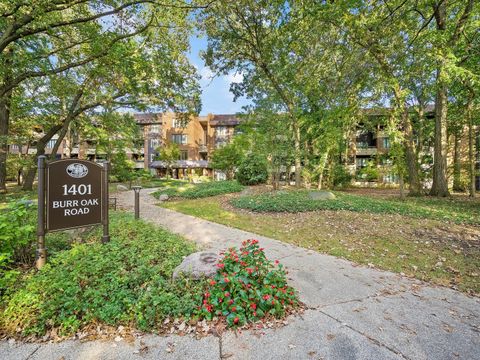
1401 Burr Oak Rd, Hinsdale, IL 60521
$-1,864
Cash flow
-17.7%
Cash-on-Cash Return
1.6%
Cap rate
0.6%
Rent to Value Ratio

Active
$849,000
4
bds
|
3
ba
|
3,431
sqft
|
built
1989
545 Minneola St, Hinsdale, IL 60521
$-1,632
Cash flow
-10.0%
Cash-on-Cash Return
3.4%
Cap rate
0.6%
Rent to Value Ratio
Active
$569,000
2
bds
|
2
ba
|
2,071
sqft
|
built
1978
1401 Burr Oak Rd, Hinsdale, IL 60521
$-1,684
Cash flow
-15.4%
Cash-on-Cash Return
2.1%
Cap rate
0.7%
Rent to Value Ratio
Active
$525,000
2
bds
|
3
ba
|
1,876
sqft
|
built
1978
1409 Burr Oak Rd, Hinsdale, IL 60521
$-1,367
Cash flow
-13.6%
Cash-on-Cash Return
2.6%
Cap rate
0.7%
Rent to Value Ratio