Houma, LA Investment Properties for Sale
Browse homes for sale and investment properties in Houma, LA. Refine your search by price, property type, or more.
Best cash flowing properties in Houma, LA
Active
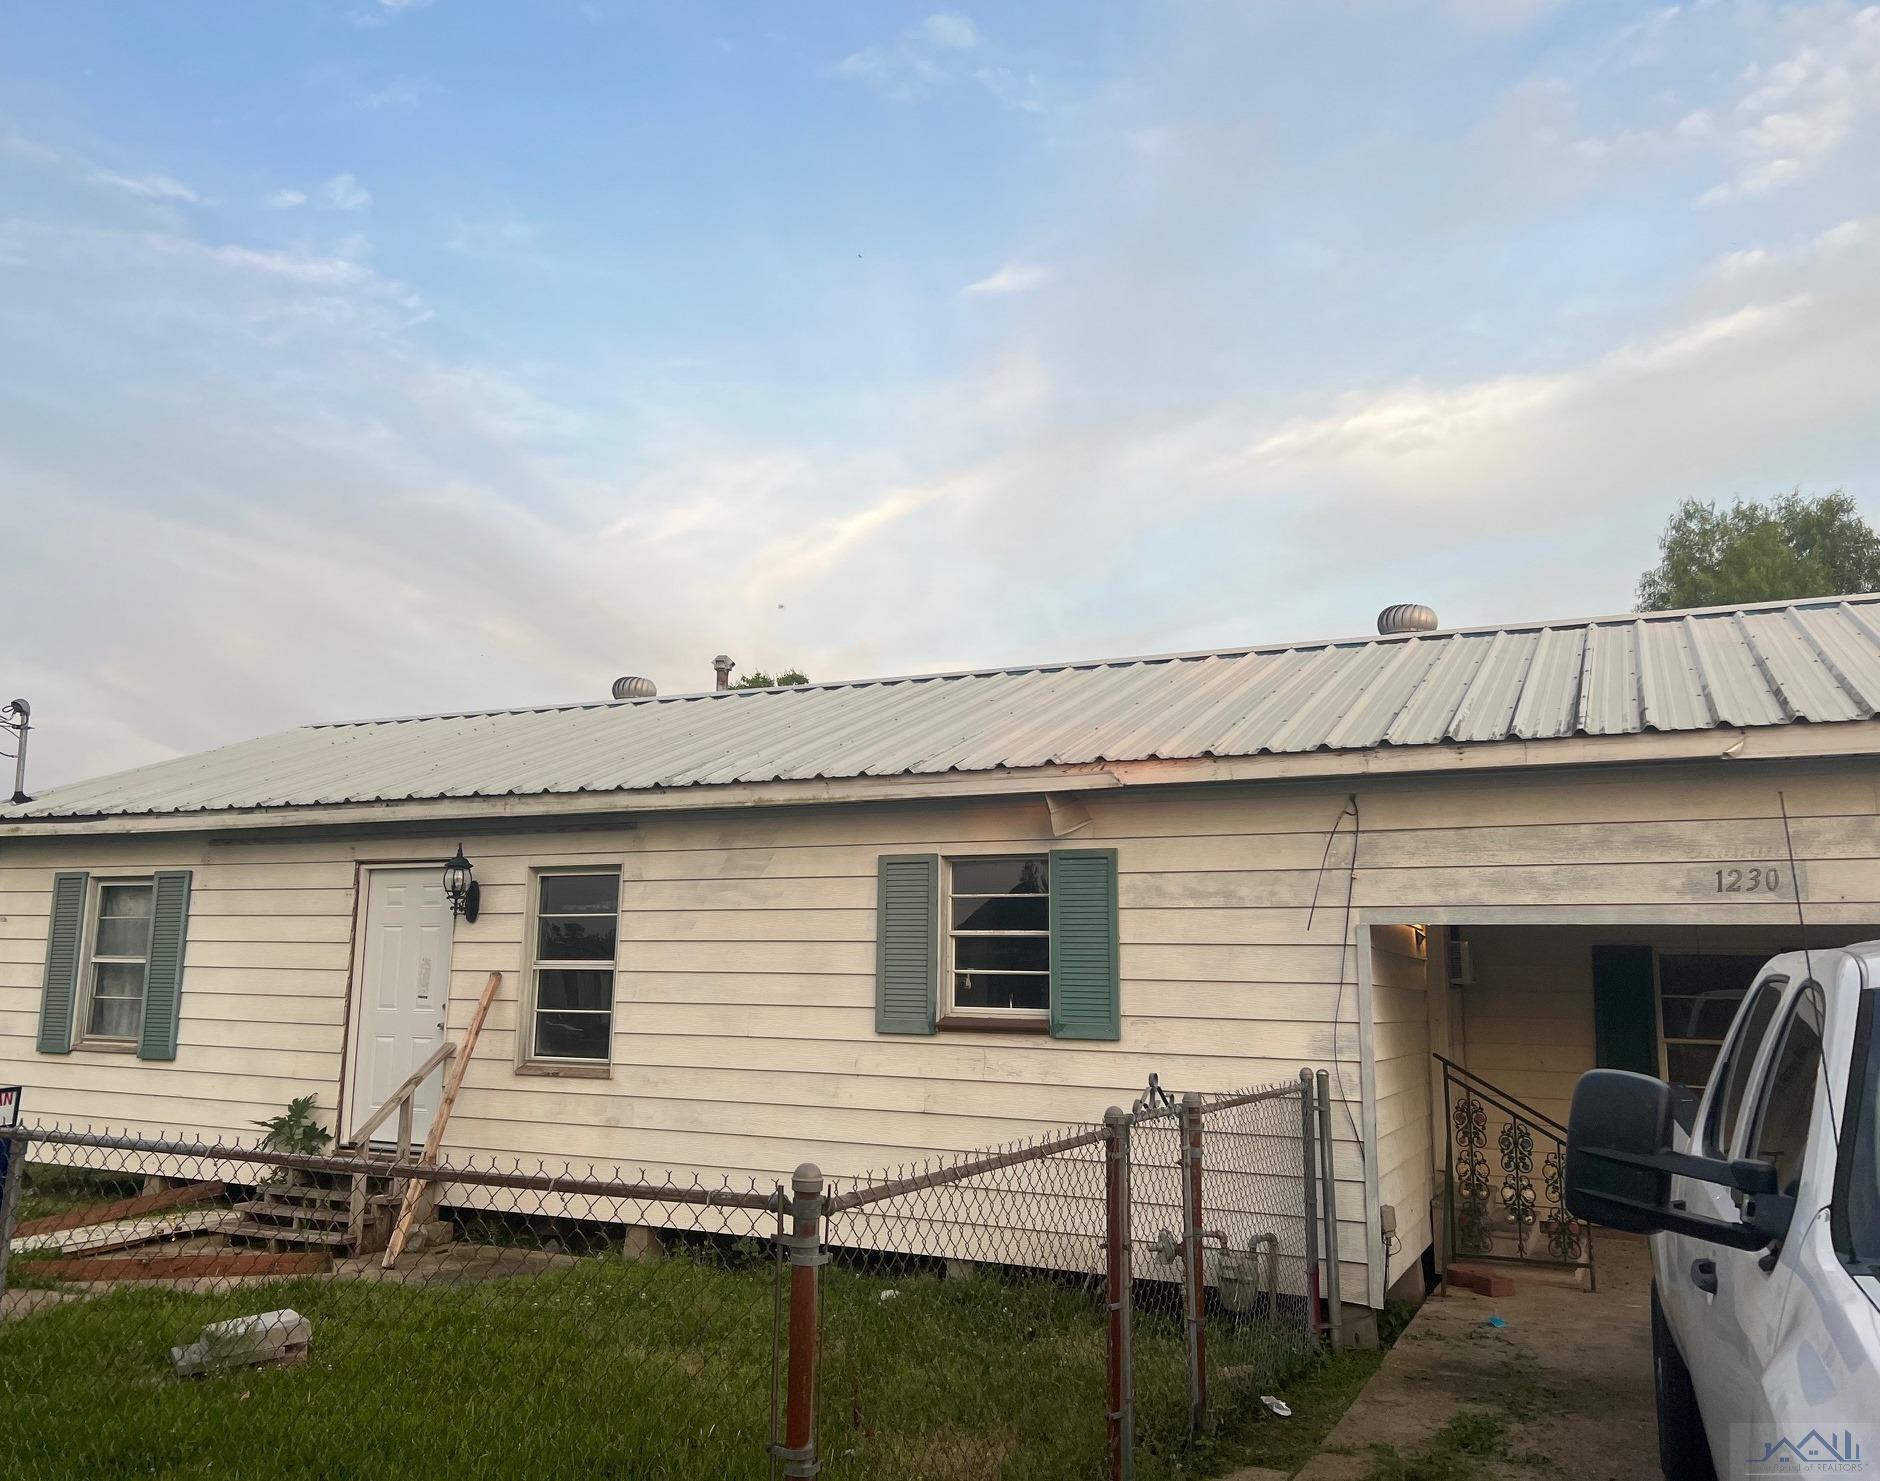
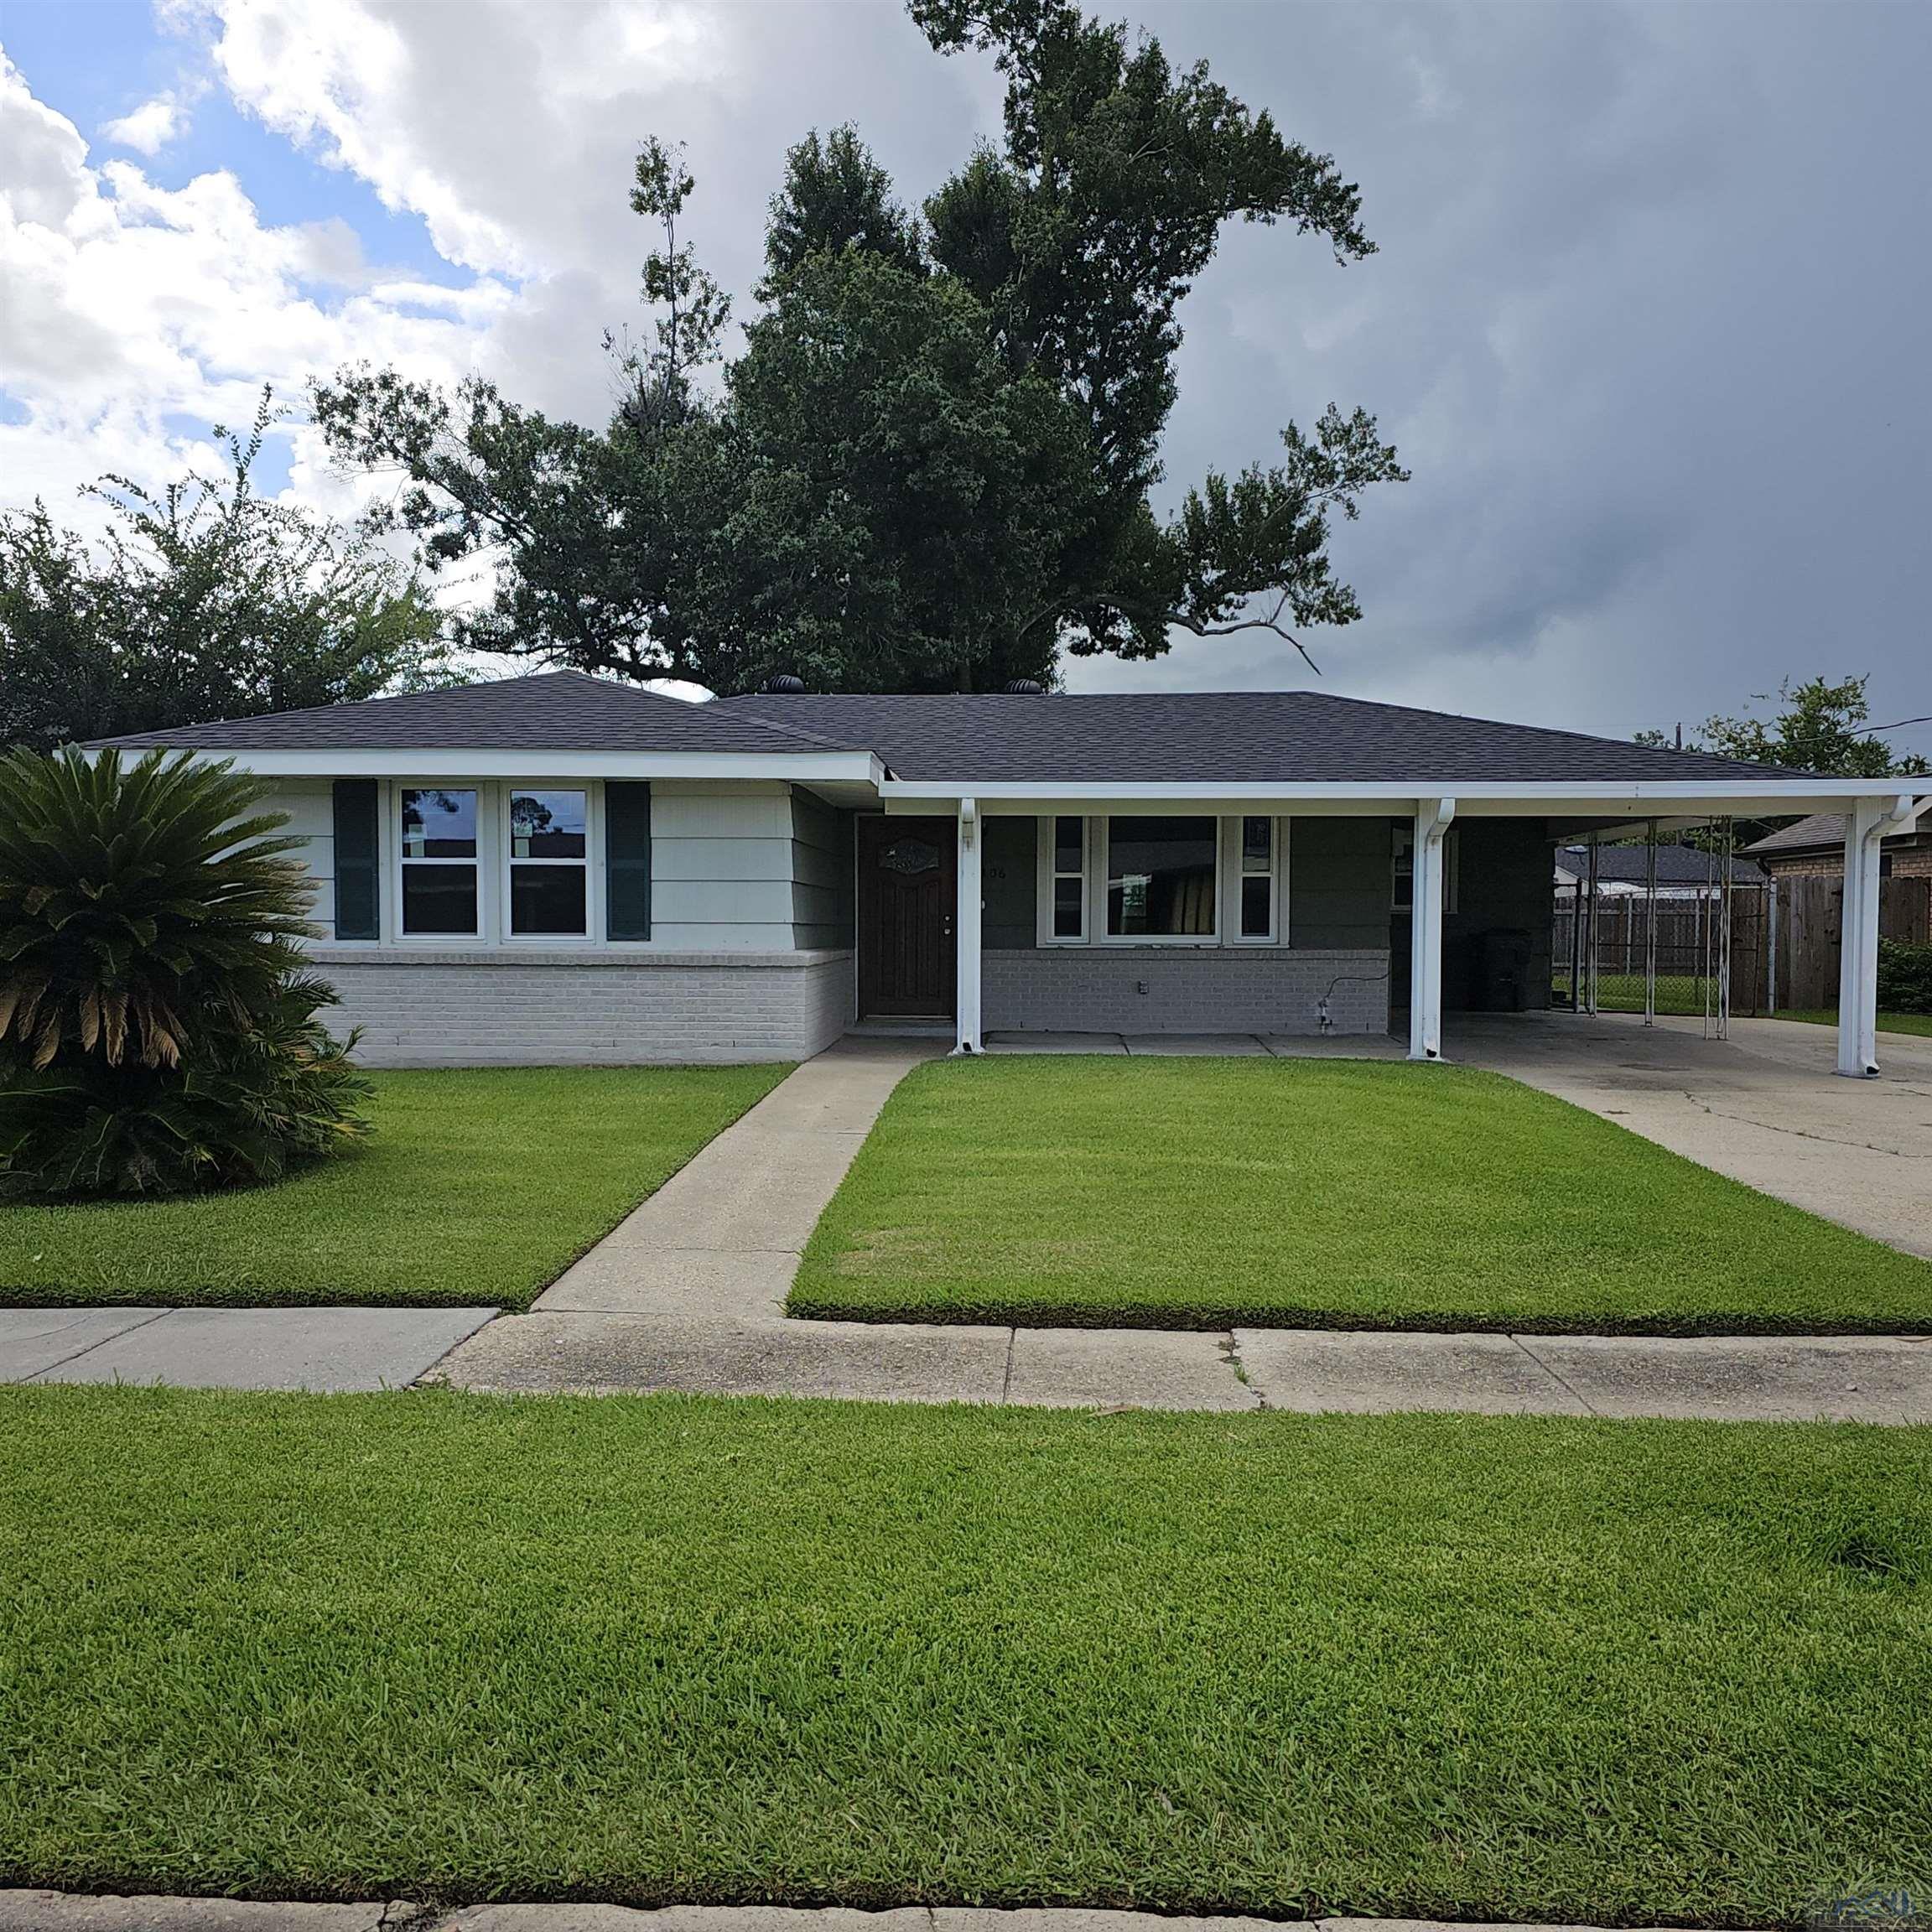
$72,500
2
bds
|
1
ba
|
1,051
sqft
|
built
2002
1230 Lacroix Dr, Houma, LA 70364
$621
Cash flow
10.0%
Cash-on-Cash Return
10.3%
Cap rate
1.2%
Rent to Value Ratio
Active
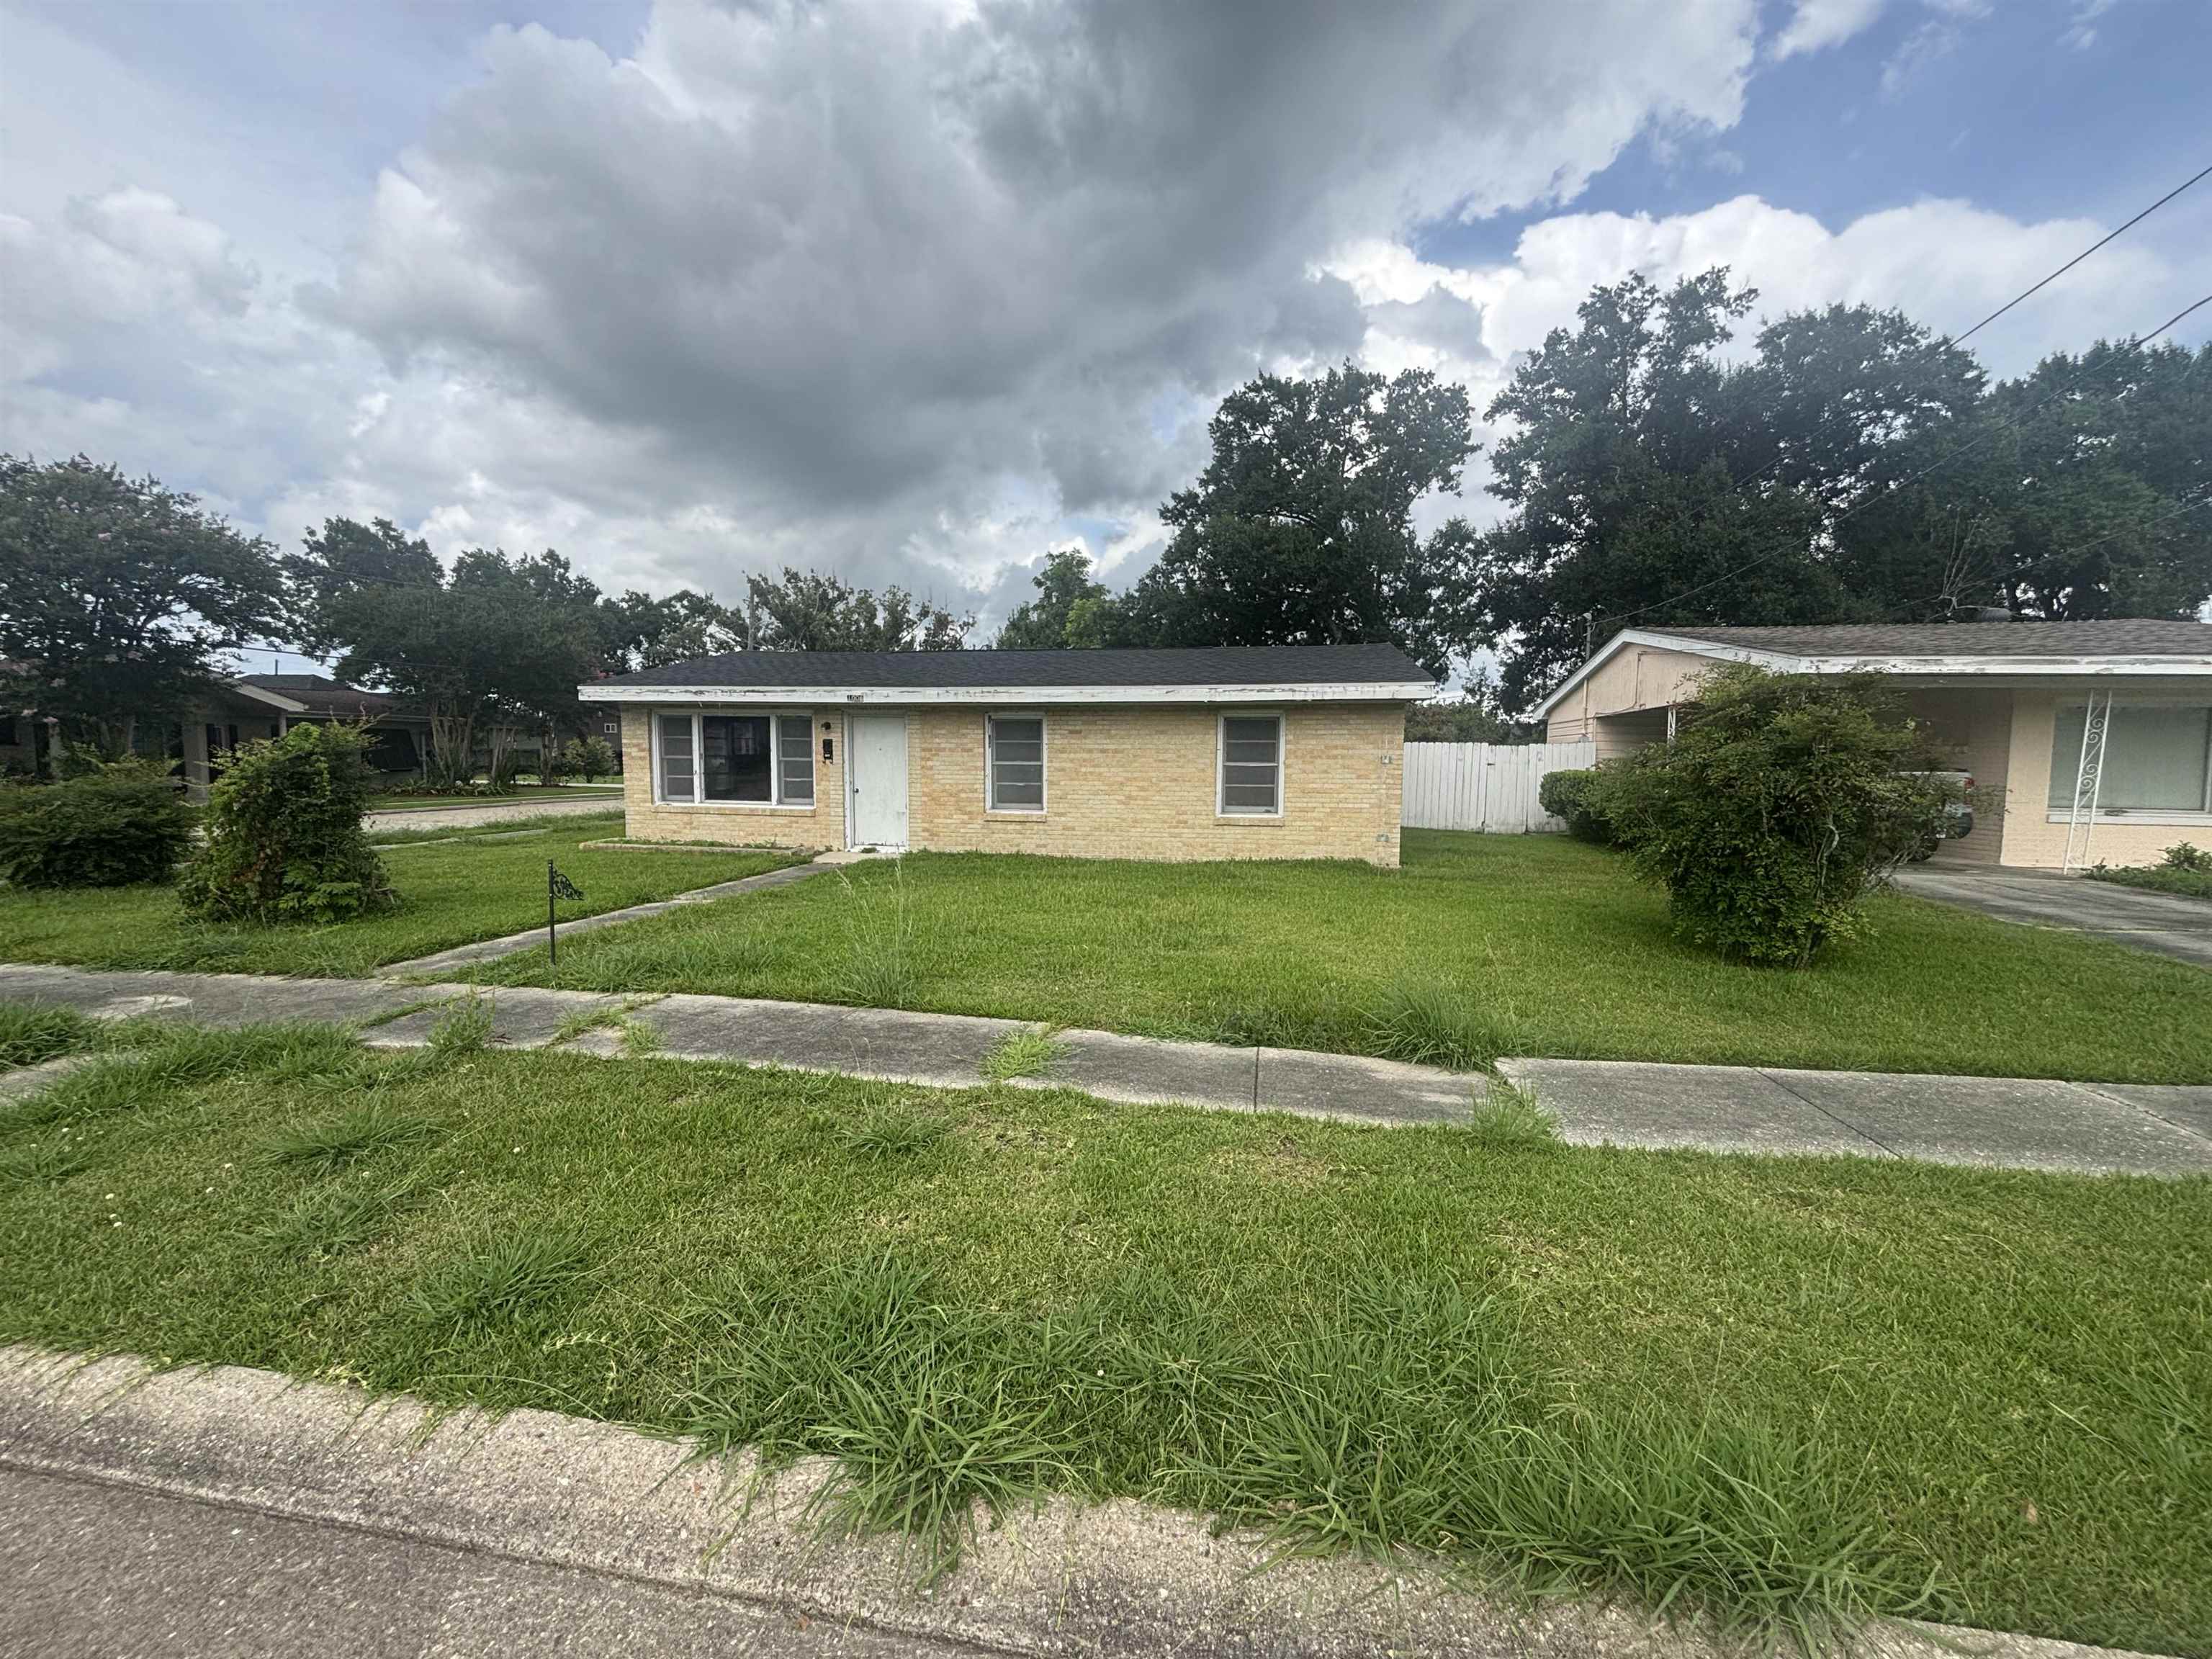
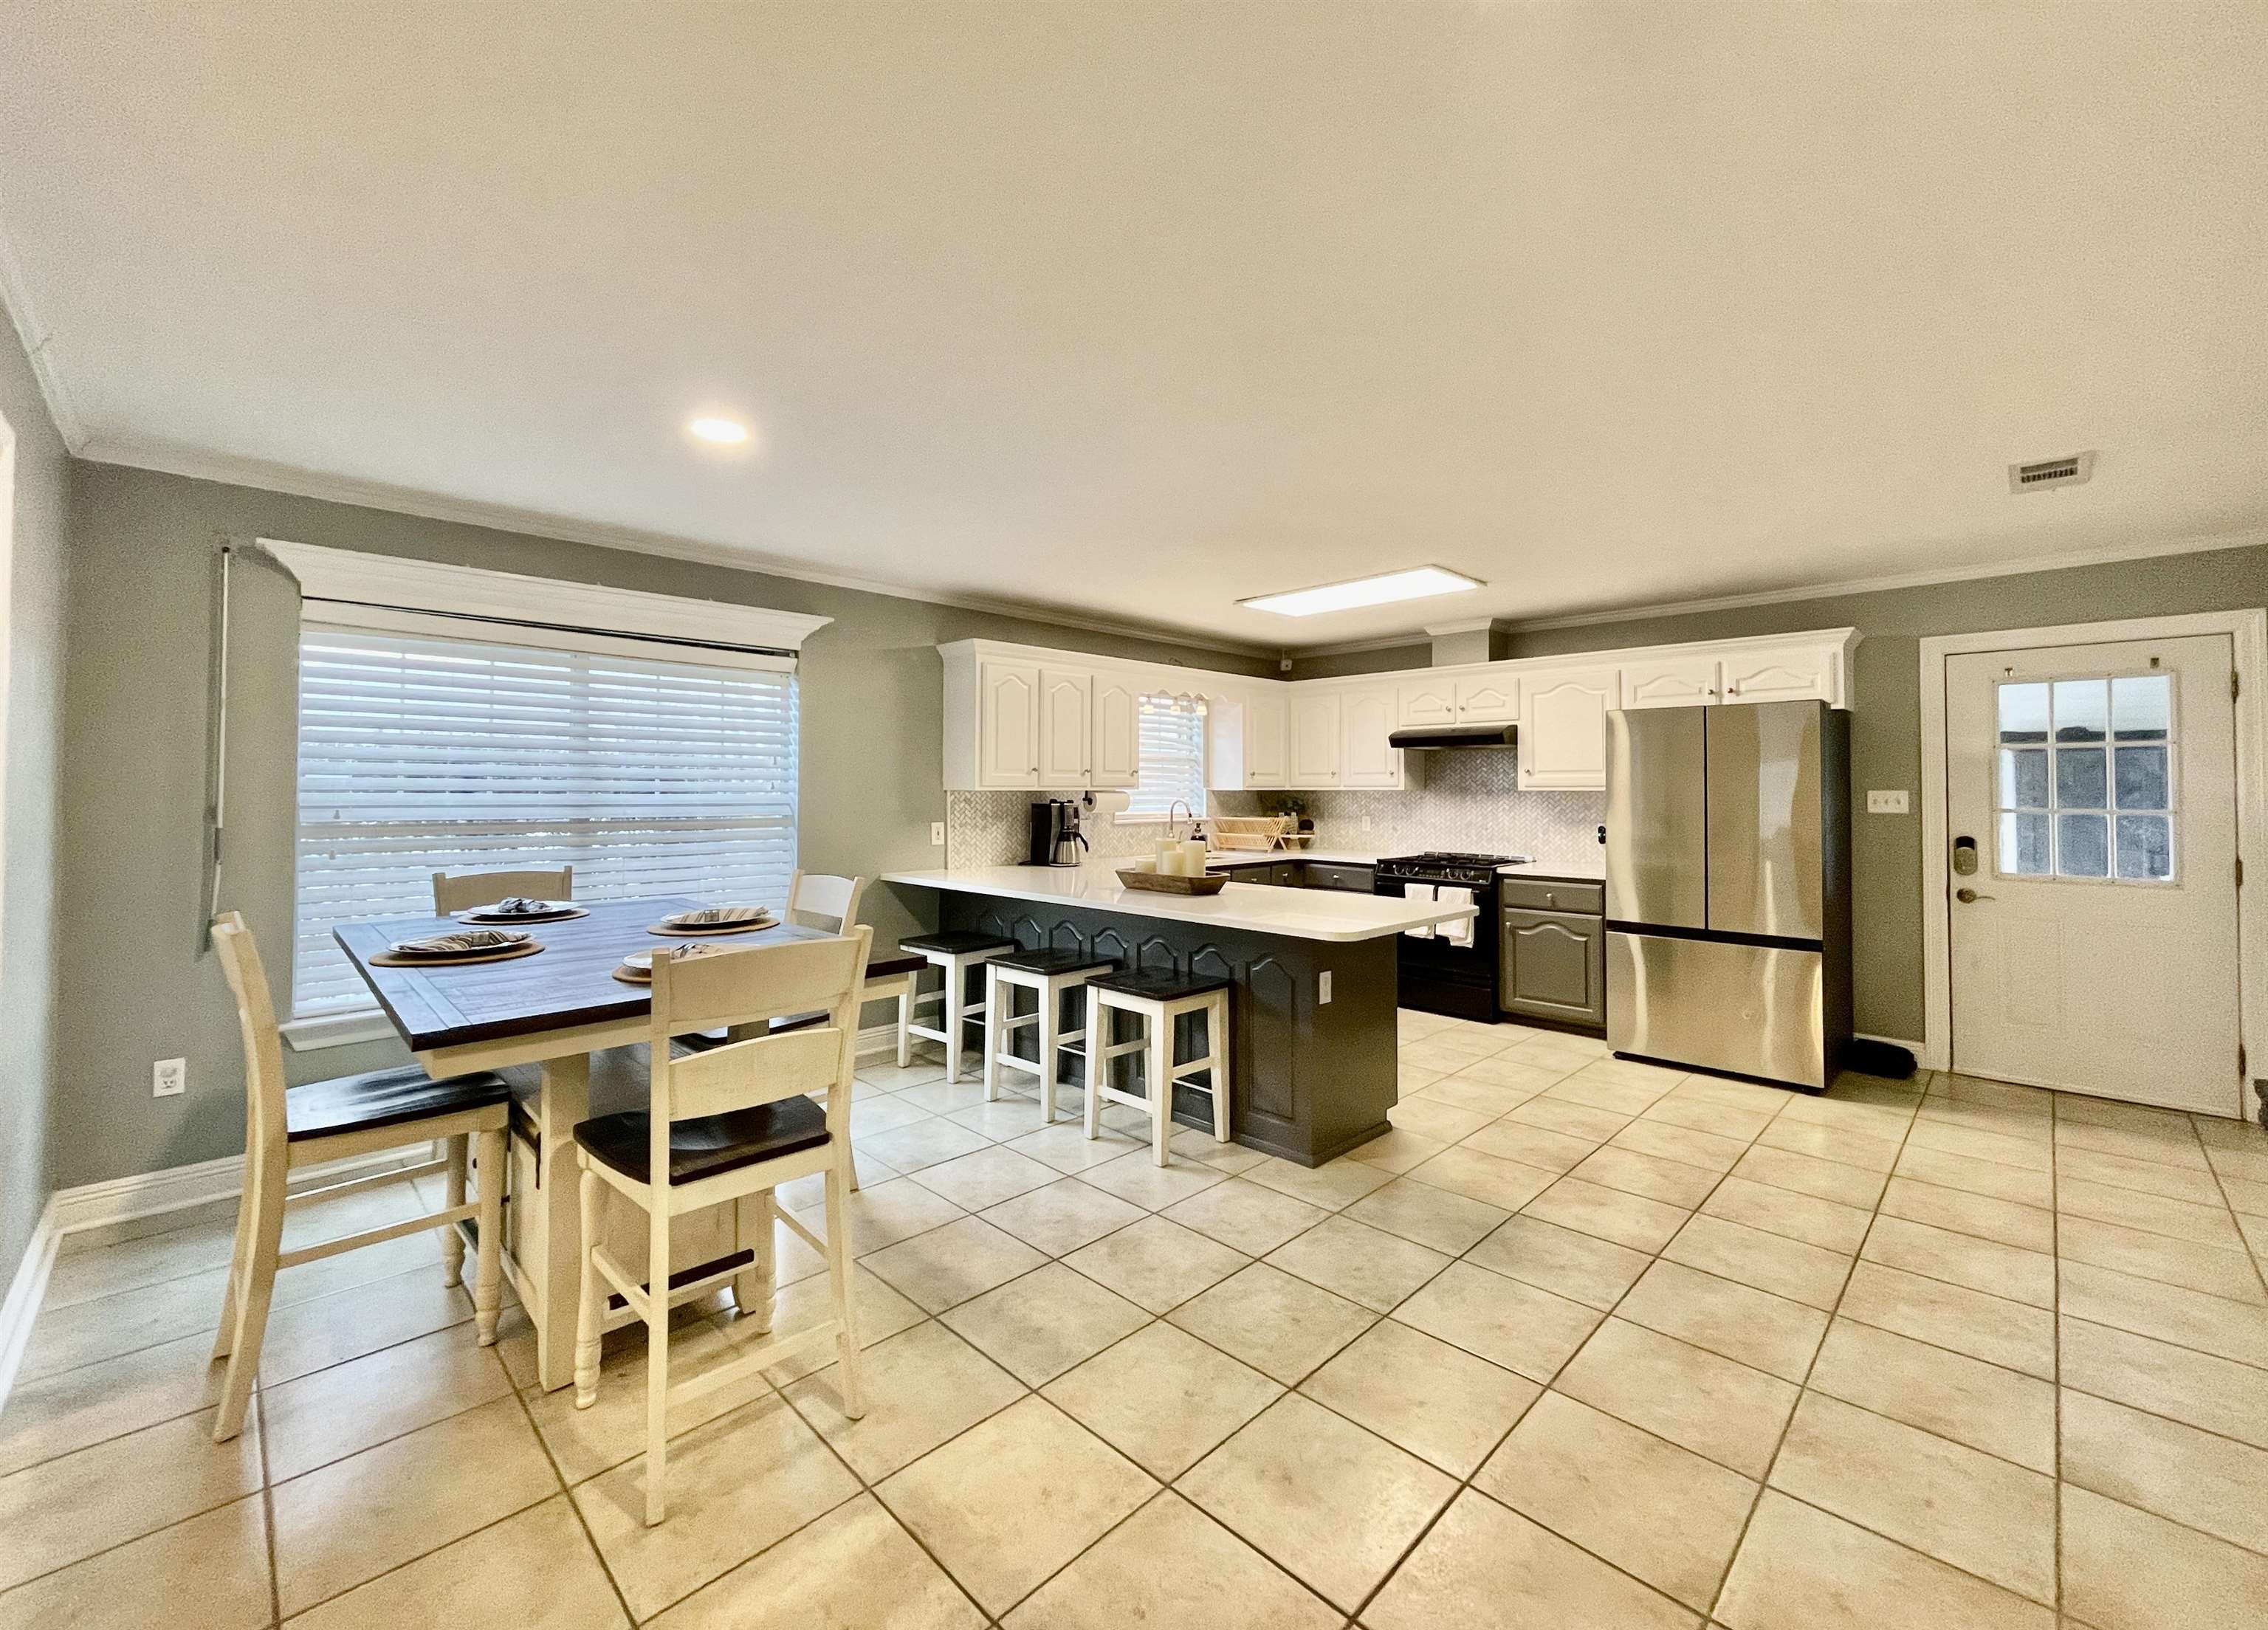
$90,000
3
bds
|
1
ba
|
1,407
sqft
|
built
1954
1006 Franklin Ave, Houma, LA 70364
$471
Cash flow
27.3%
Cash-on-Cash Return
12.0%
Cap rate
1.4%
Rent to Value Ratio
315 out of 342 properties for sale in Houma, LA
Limited Results Shown
Create a free account, or log in to reveal all property listings and enjoy the complete experience.

Active
$1,300,000
4
bds
|
6
ba
|
6,741
sqft
|
built
1972
1621 Bayou Black Dr, Houma, LA 70360
$-4,427
Cash flow
-17.8%
Cash-on-Cash Return
1.6%
Cap rate
0.2%
Rent to Value Ratio

Pending
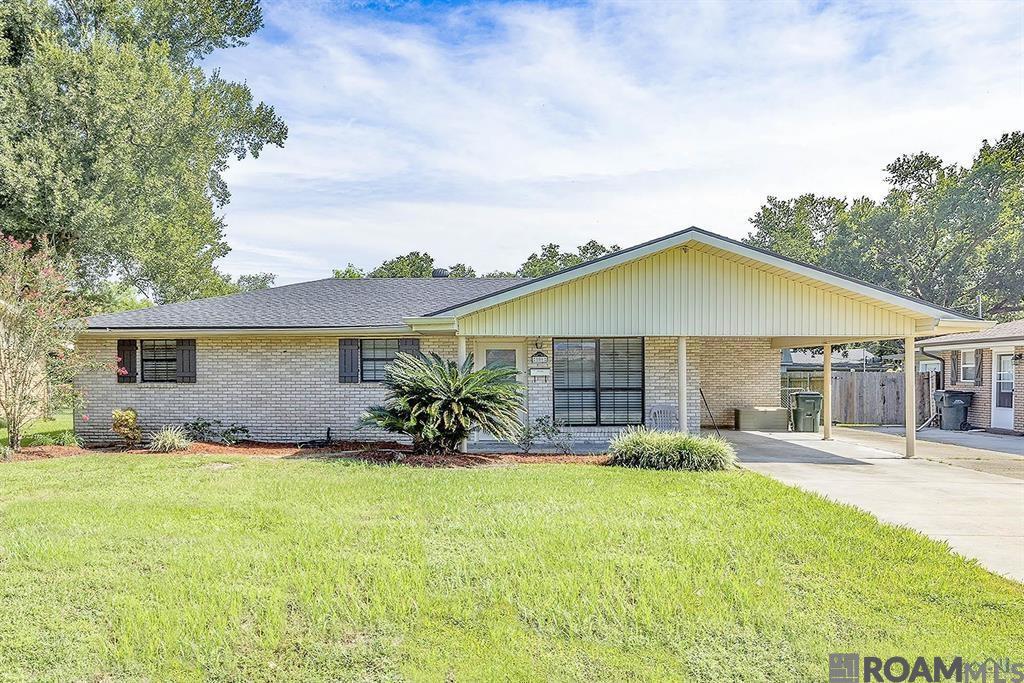
$165,000
3
bds
|
2
ba
|
1,250
sqft
|
built
2002
341 Garden View Dr, Houma, LA 70364
$185
Cash flow
5.8%
Cash-on-Cash Return
7.0%
Cap rate
0.8%
Rent to Value Ratio
Active
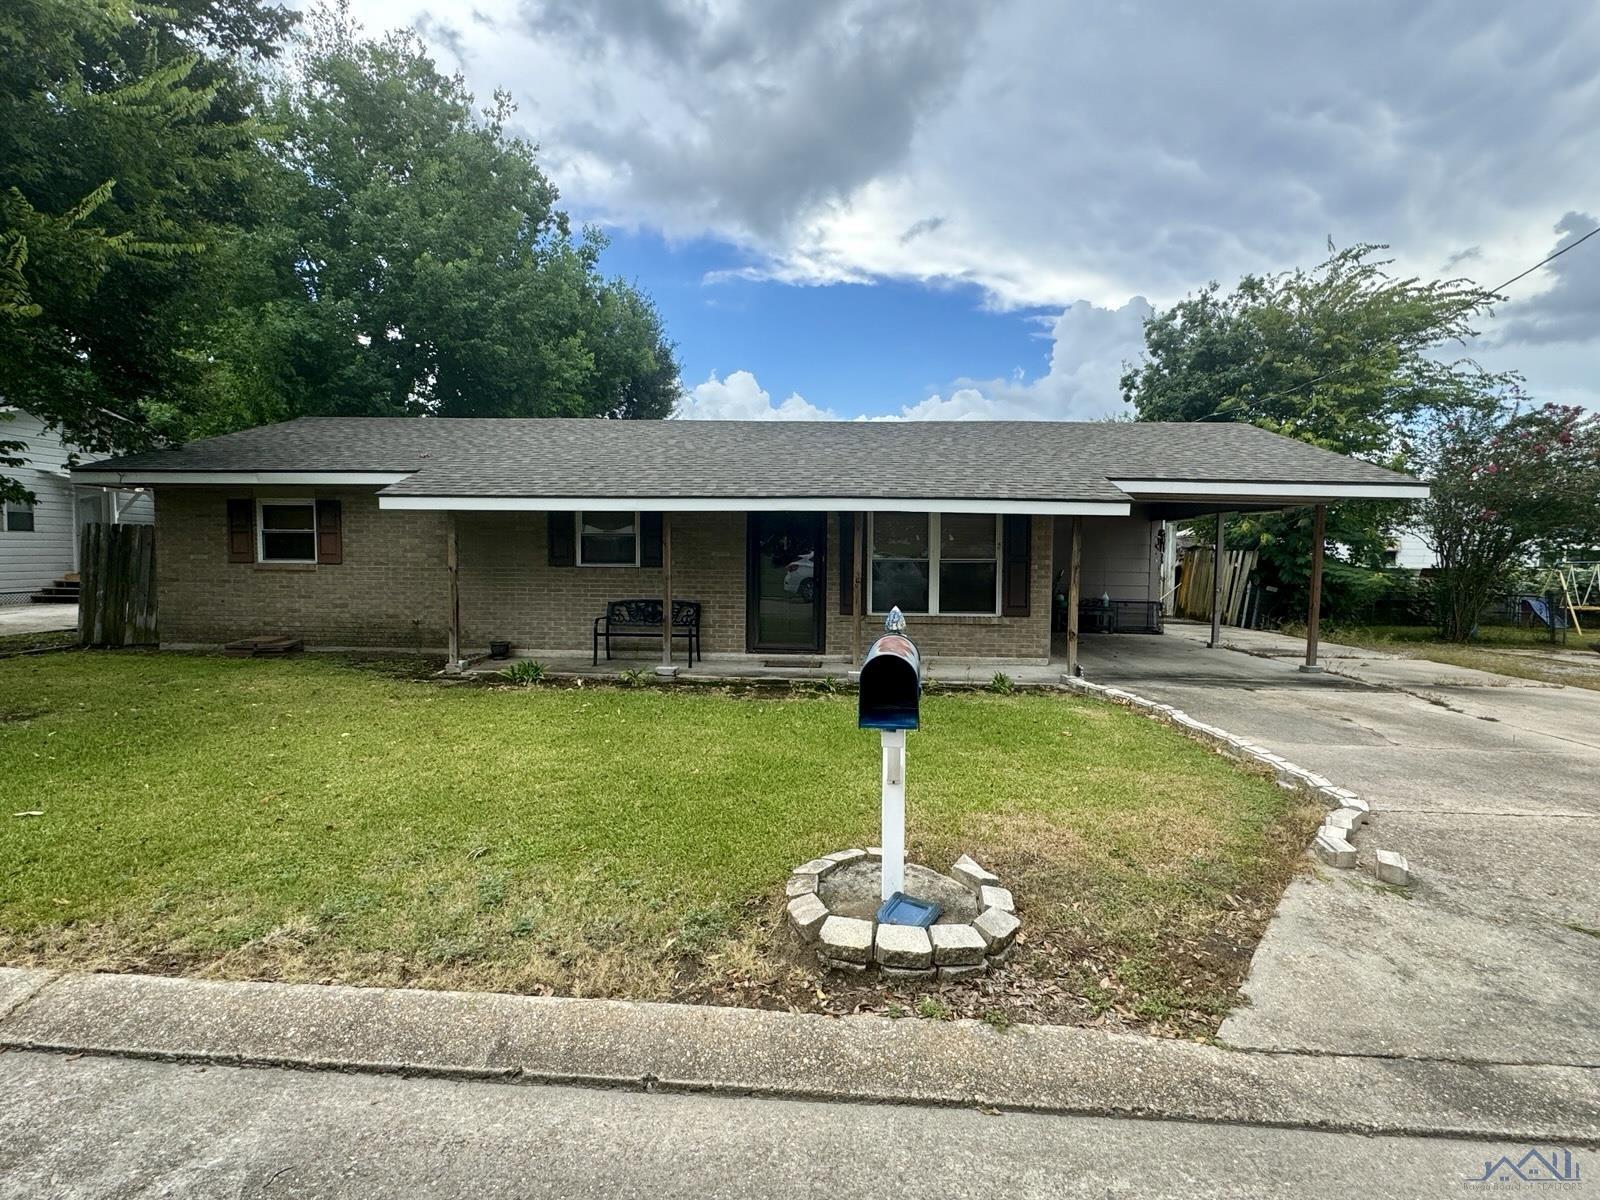
$205,000
4
bds
|
2
ba
|
1,505
sqft
|
built
1968
16 Hms Dr, Houma, LA 70364
$-4
Cash flow
-0.1%
Cash-on-Cash Return
5.7%
Cap rate
0.7%
Rent to Value Ratio
Active
$334,900
3
bds
|
2
ba
|
2,273
sqft
|
built
2007
504 Sugar Plum St, Houma, LA 70364
$-347
Cash flow
-5.4%
Cash-on-Cash Return
4.4%
Cap rate
0.5%
Rent to Value Ratio

Pending
$335,000
4
bds
|
3
ba
|
2,105
sqft
|
built
1990
360 Sugar Plum St, Houma, LA 70364
$-481
Cash flow
-7.5%
Cash-on-Cash Return
4.0%
Cap rate
0.5%
Rent to Value Ratio
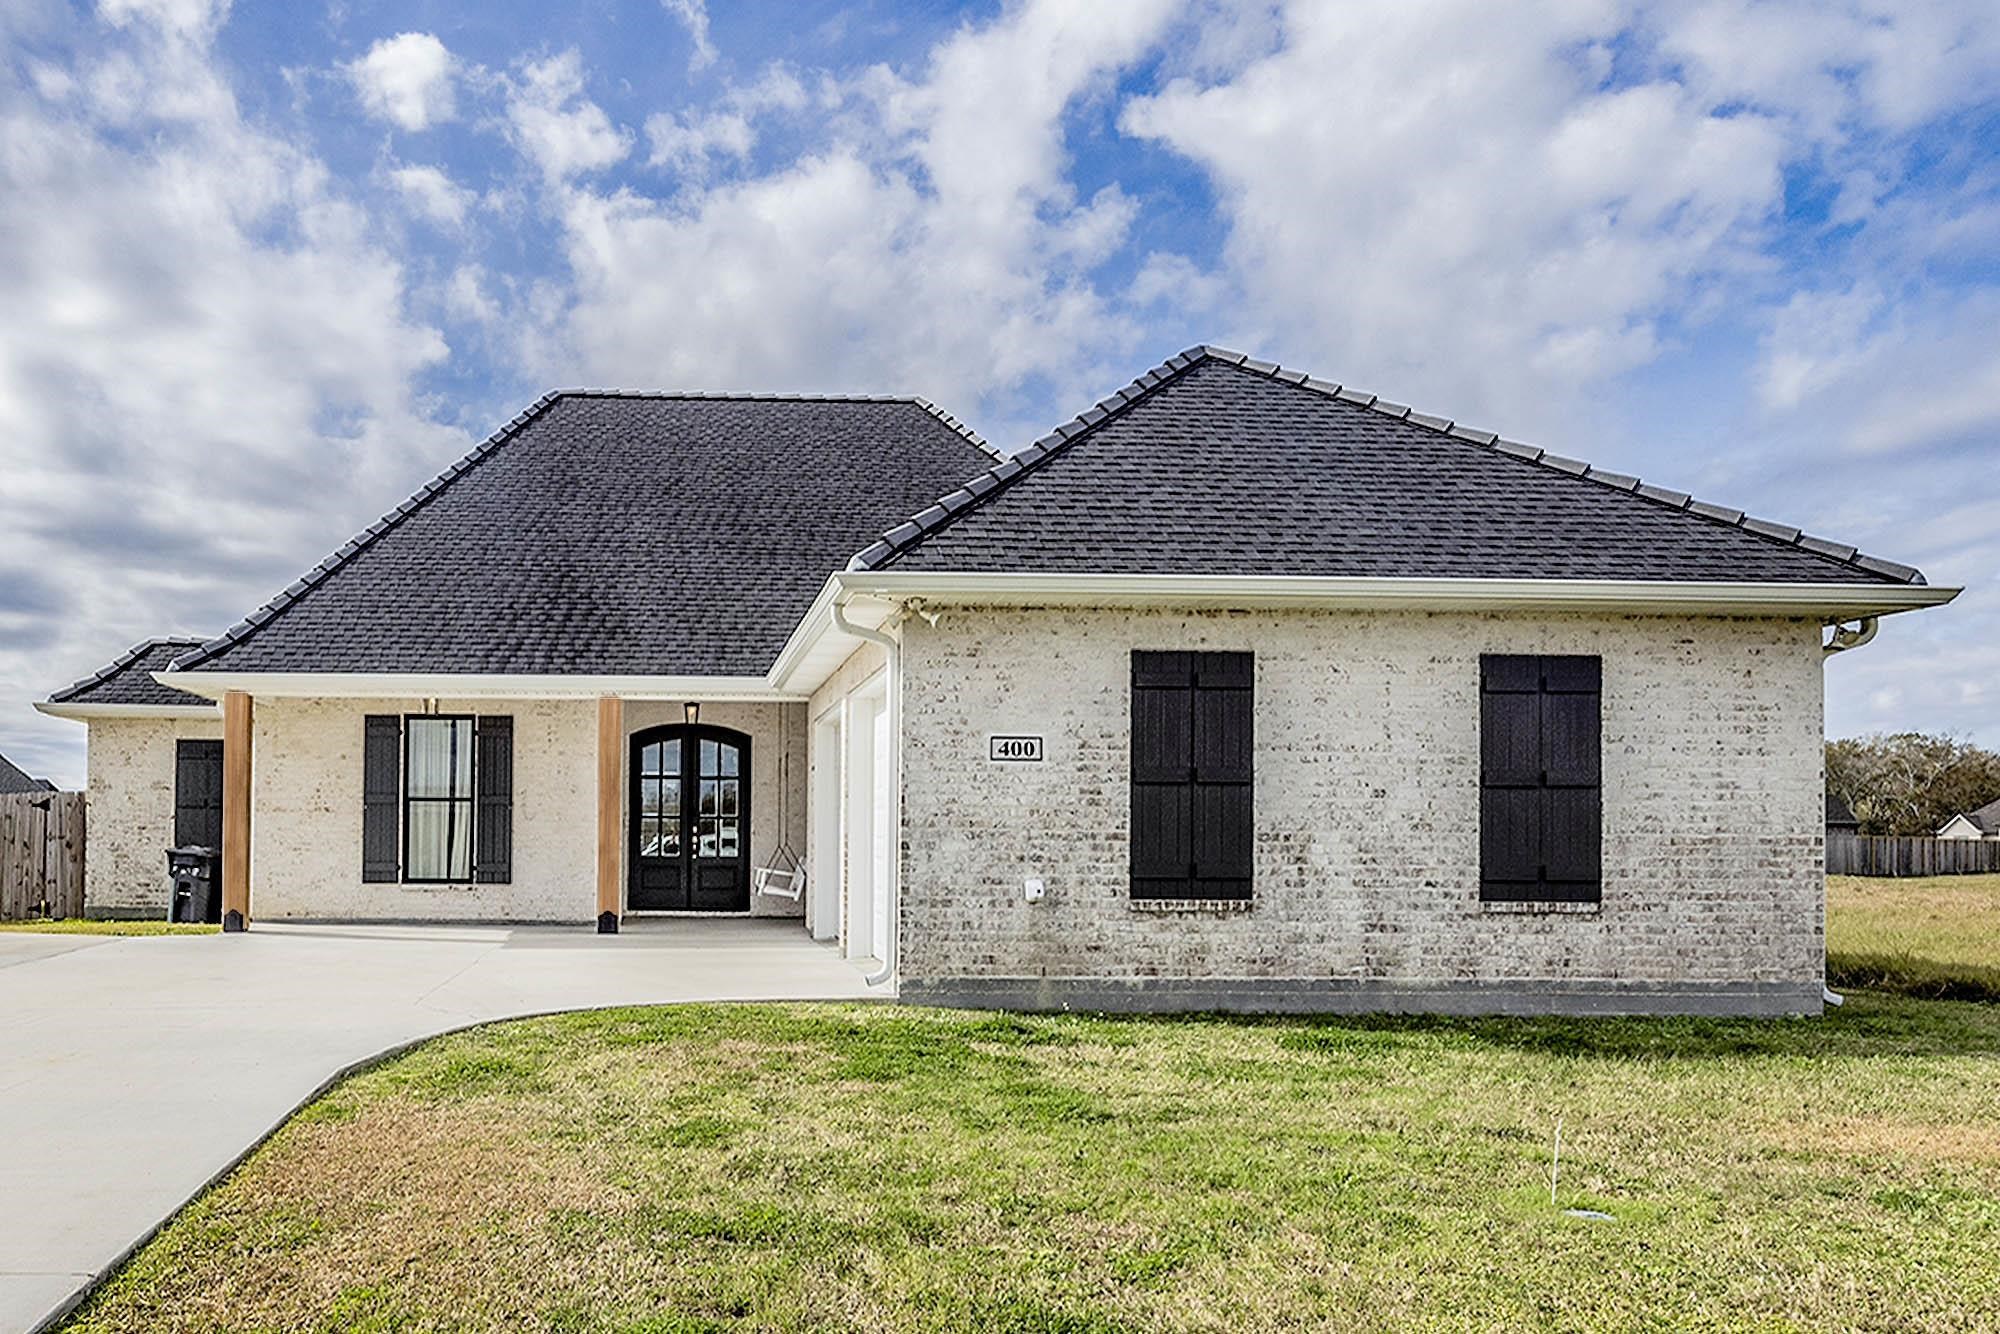
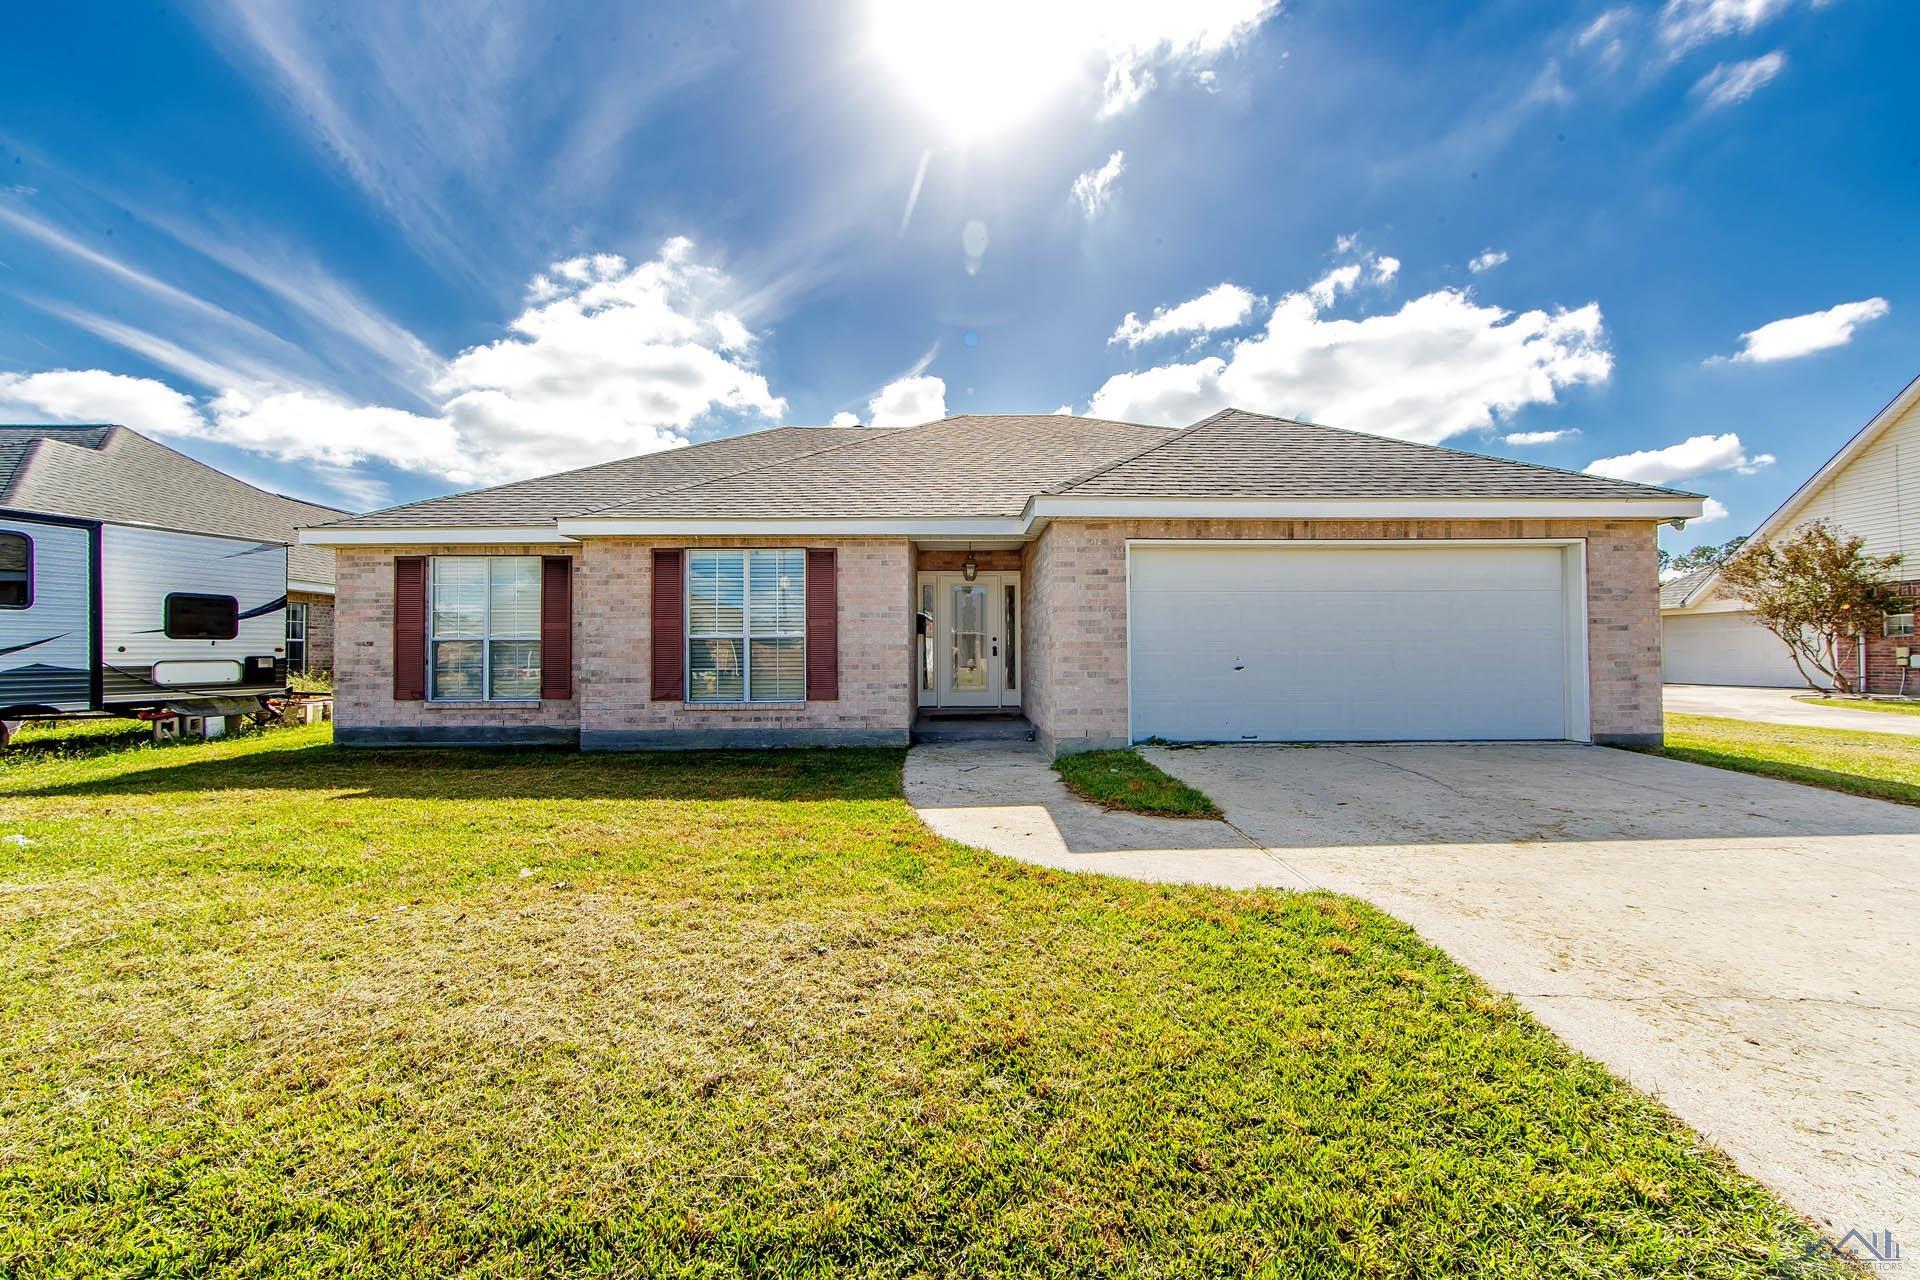
Active
$439,000
4
bds
|
3
ba
|
2,032
sqft
|
built
2021
400 Independence Dr, Houma, LA 70360
$-145
Cash flow
-1.7%
Cash-on-Cash Return
5.3%
Cap rate
0.6%
Rent to Value Ratio

Active
$120,000
2
bds
|
1
ba
|
1,108
sqft
|
built
1965
250 Carlos St, Houma, LA 70364
$329
Cash flow
14.3%
Cash-on-Cash Return
9.0%
Cap rate
1.1%
Rent to Value Ratio
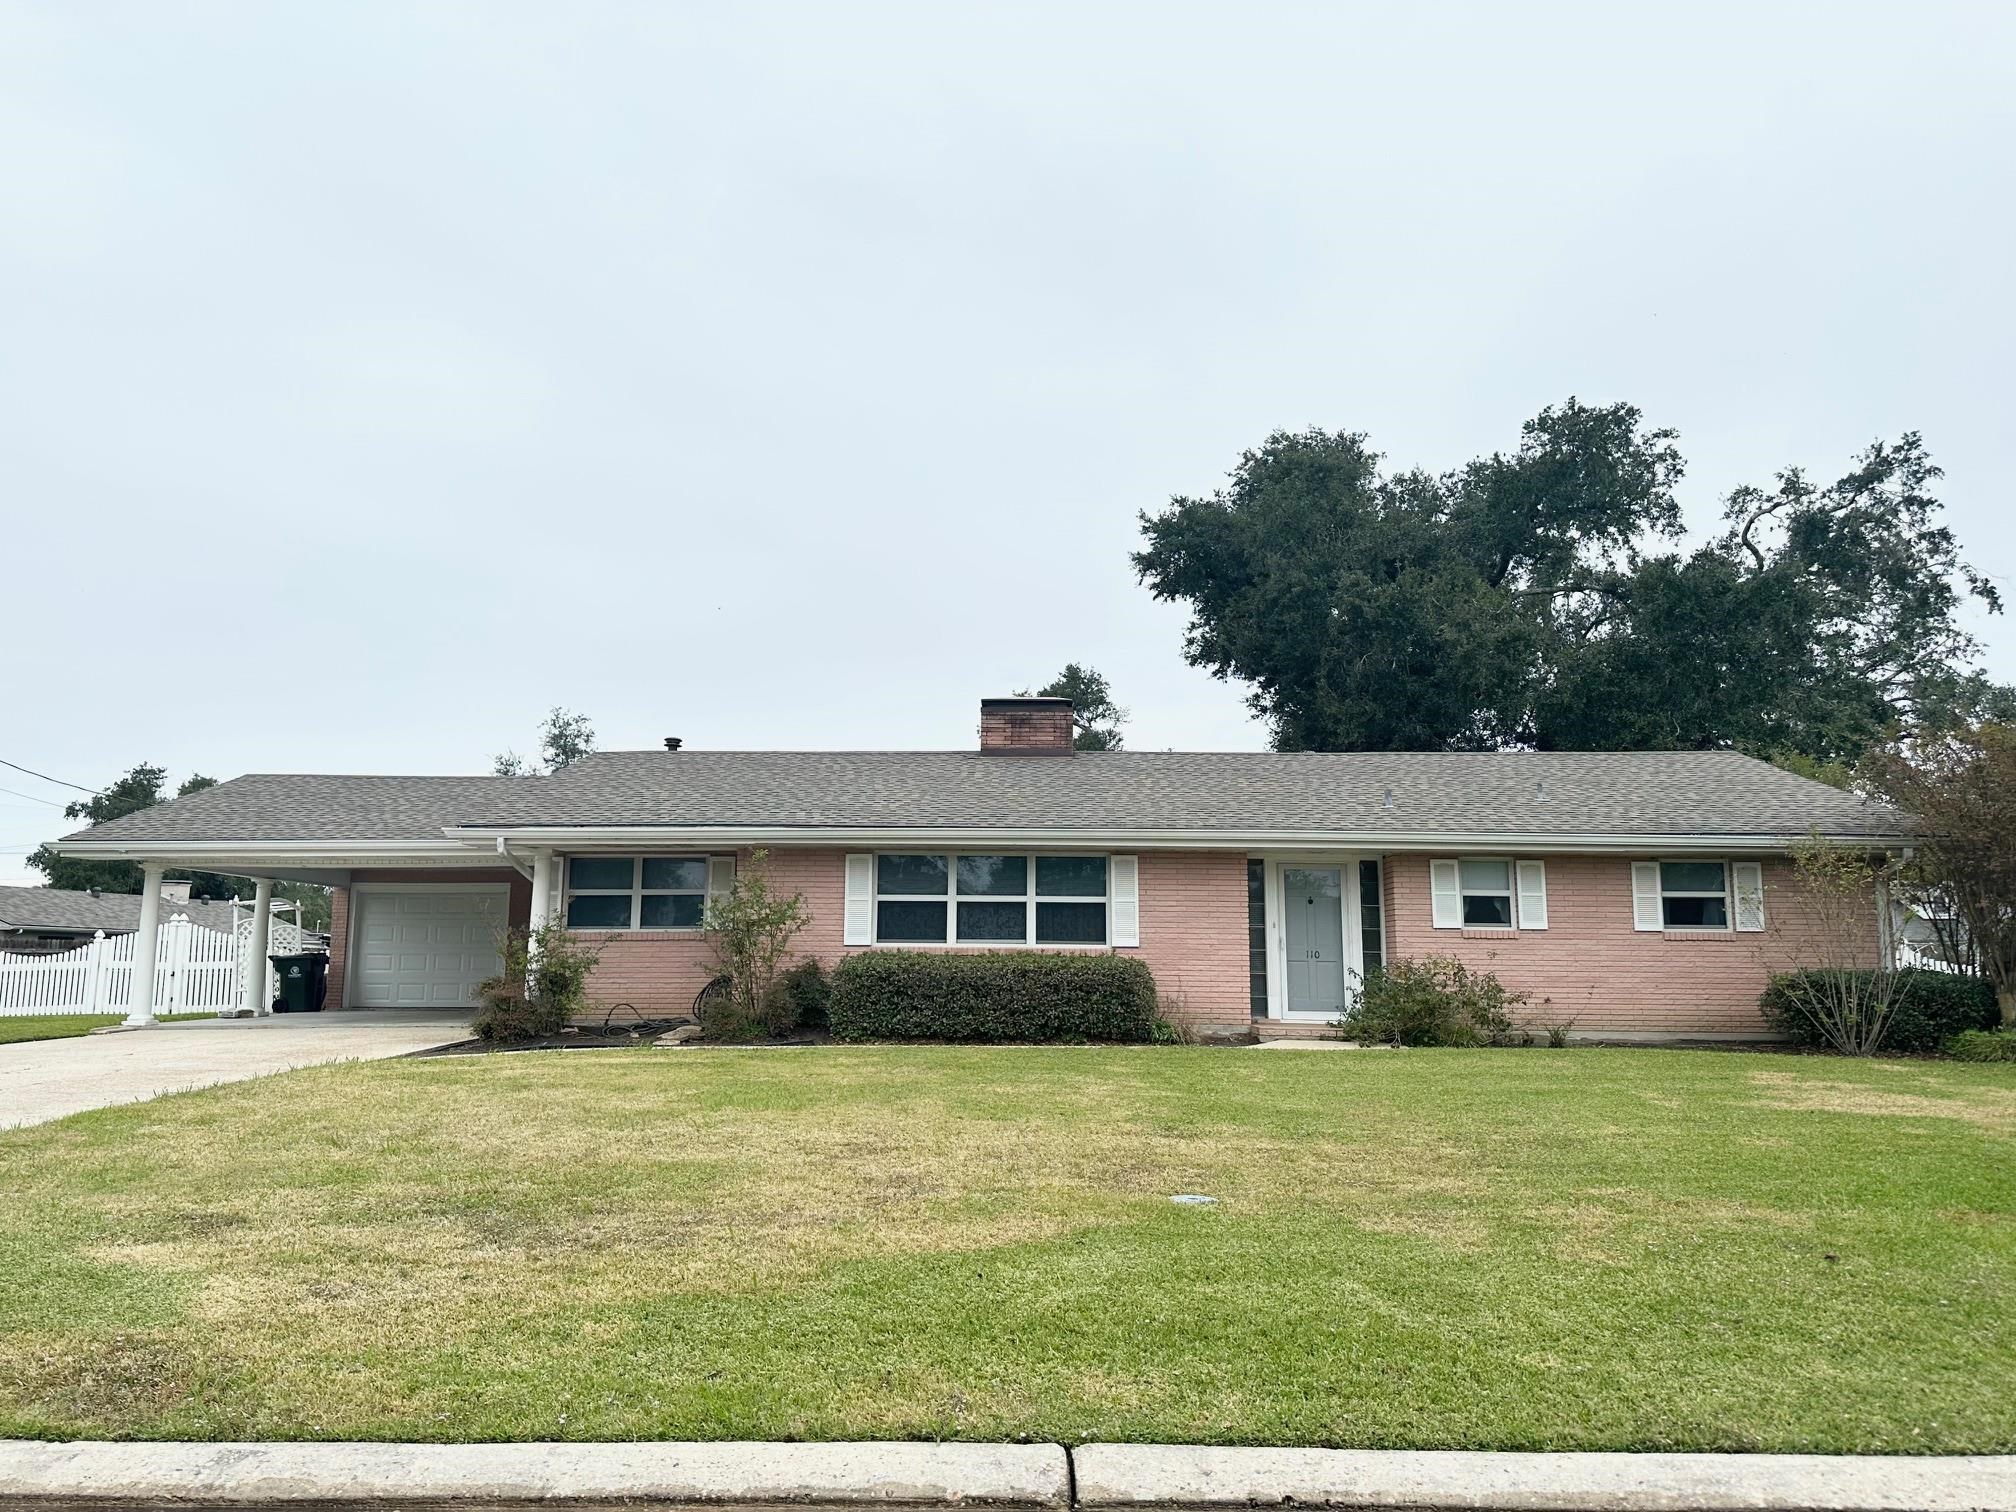
Active
$345,000
3
bds
|
2
ba
|
2,409
sqft
|
built
1956
110 Sherman St, Houma, LA 70360
$-391
Cash flow
-5.9%
Cash-on-Cash Return
4.3%
Cap rate
0.5%
Rent to Value Ratio
Active
$459,500
4
bds
|
3
ba
|
2,260
sqft
|
built
1971
602 Terre Haute Pl, Houma, LA 70364
$-794
Cash flow
-9.0%
Cash-on-Cash Return
3.6%
Cap rate
0.4%
Rent to Value Ratio

Active
$160,000
3
bds
|
2
ba
|
1,250
sqft
|
built
1971
302 Troy St, Houma, LA 70363
$209
Cash flow
6.8%
Cash-on-Cash Return
7.2%
Cap rate
0.9%
Rent to Value Ratio
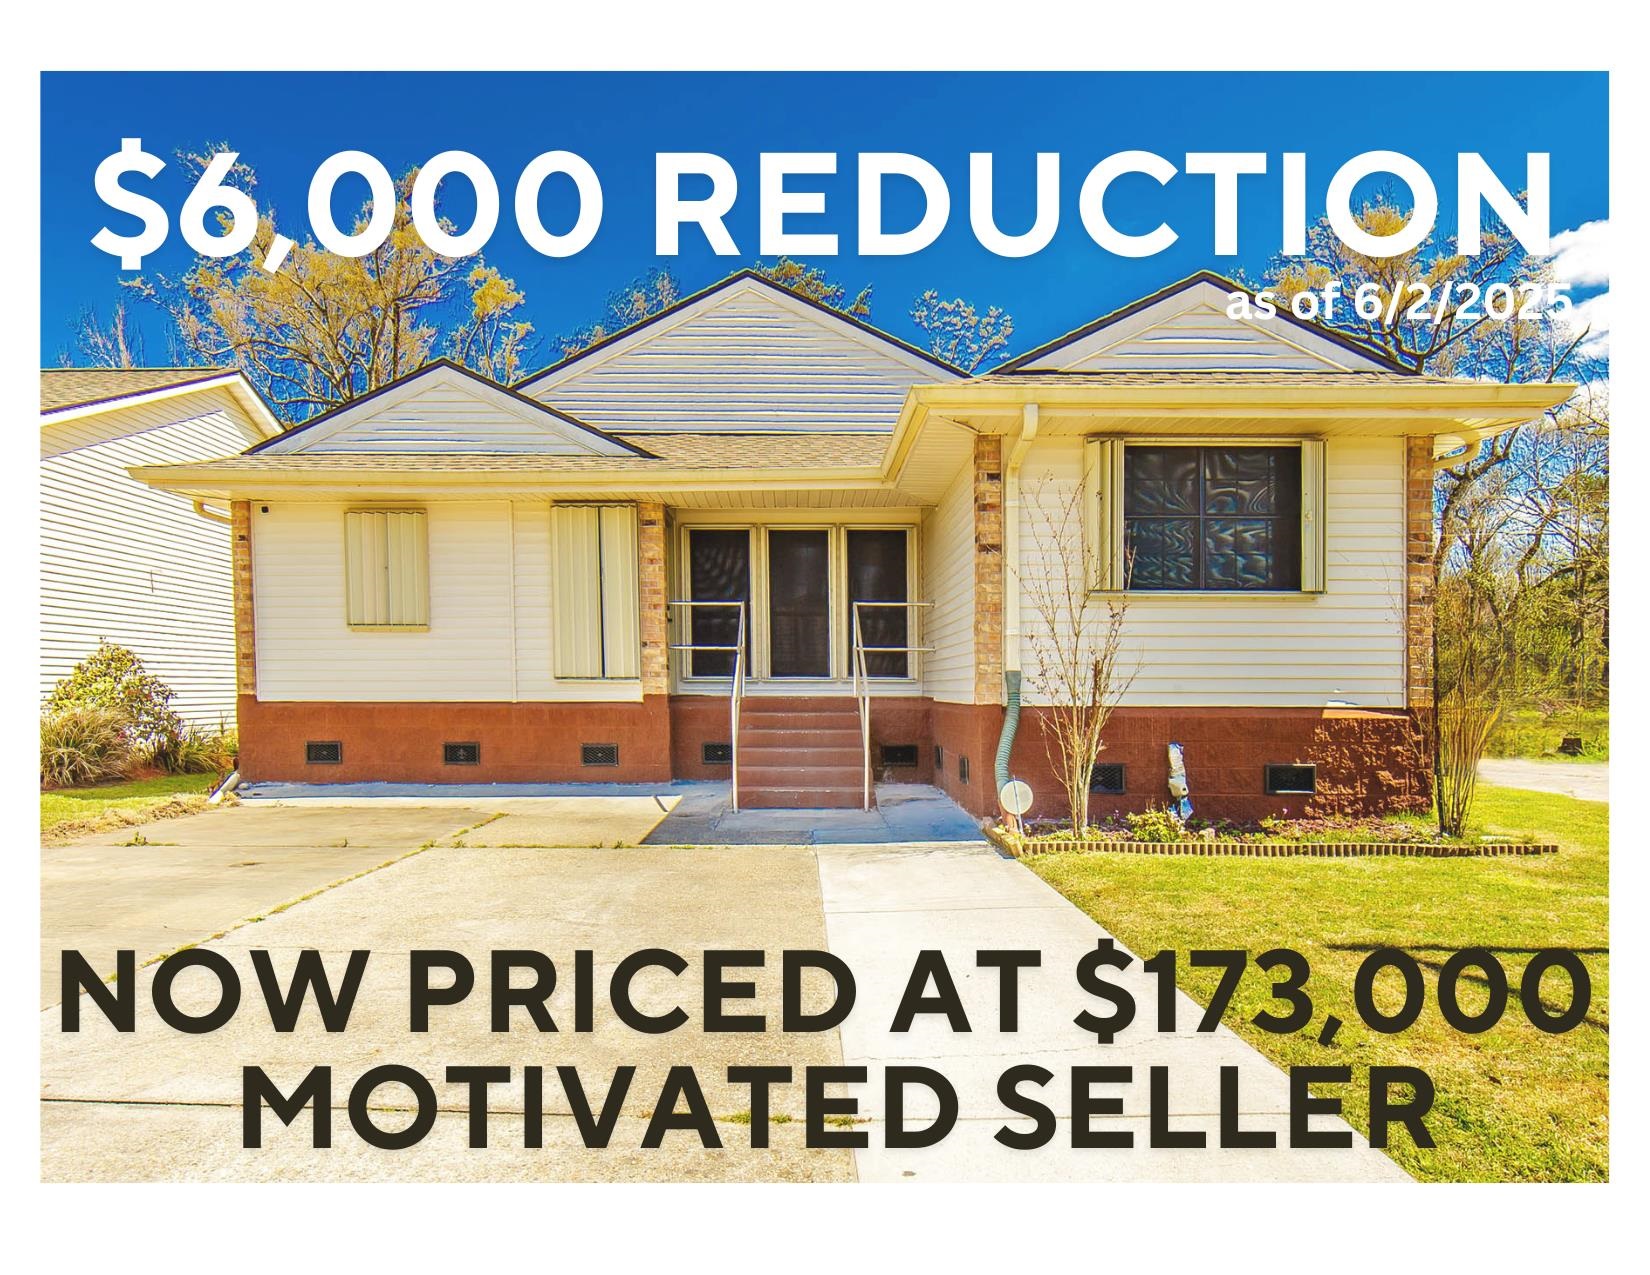
Active
$173,000
3
bds
|
2
ba
|
1,400
sqft
|
built
1984
3290 Boxwood Dr, Houma, LA 70364
$147
Cash flow
4.4%
Cash-on-Cash Return
6.7%
Cap rate
0.8%
Rent to Value Ratio

Active
$585,000
3
bds
|
3
ba
|
2,861
sqft
|
built
2002
108 Ouiski Bayou Dr, Houma, LA 70360
$-1,250
Cash flow
-11.1%
Cash-on-Cash Return
3.1%
Cap rate
0.4%
Rent to Value Ratio

Active
$180,000
5
bds
|
2
ba
|
2,084
sqft
|
built
1986
305 Harding Dr, Houma, LA 70364
$252
Cash flow
7.3%
Cash-on-Cash Return
7.4%
Cap rate
0.9%
Rent to Value Ratio

Active
$389,000
3
bds
|
3
ba
|
2,248
sqft
|
built
2003
335 Tulsa Ave, Houma, LA 70360
$-461
Cash flow
-6.2%
Cash-on-Cash Return
4.3%
Cap rate
0.5%
Rent to Value Ratio
Active
$540,000
bds
|
0
ba
|
6,840
sqft
|
built
1407 Memory Ln, Houma, LA 70363
$-1,934
Cash flow
-18.7%
Cash-on-Cash Return
1.4%
Cap rate
0.2%
Rent to Value Ratio
Active
$176,200
4
bds
|
2
ba
|
1,900
sqft
|
built
1975
417 Walker Dr, Houma, LA 70364
$201
Cash flow
6.0%
Cash-on-Cash Return
7.0%
Cap rate
0.9%
Rent to Value Ratio
Active under contract
$437,000
4
bds
|
4
ba
|
2,679
sqft
|
built
2007
3377 Caleb Dr, Houma, LA 70360
$-826
Cash flow
-9.9%
Cash-on-Cash Return
3.4%
Cap rate
0.4%
Rent to Value Ratio
Active
$191,000
2
bds
|
2
ba
|
1,308
sqft
|
built
1996
115 Saxony Dr, Houma, LA 70364
$62
Cash flow
1.7%
Cash-on-Cash Return
6.1%
Cap rate
0.7%
Rent to Value Ratio
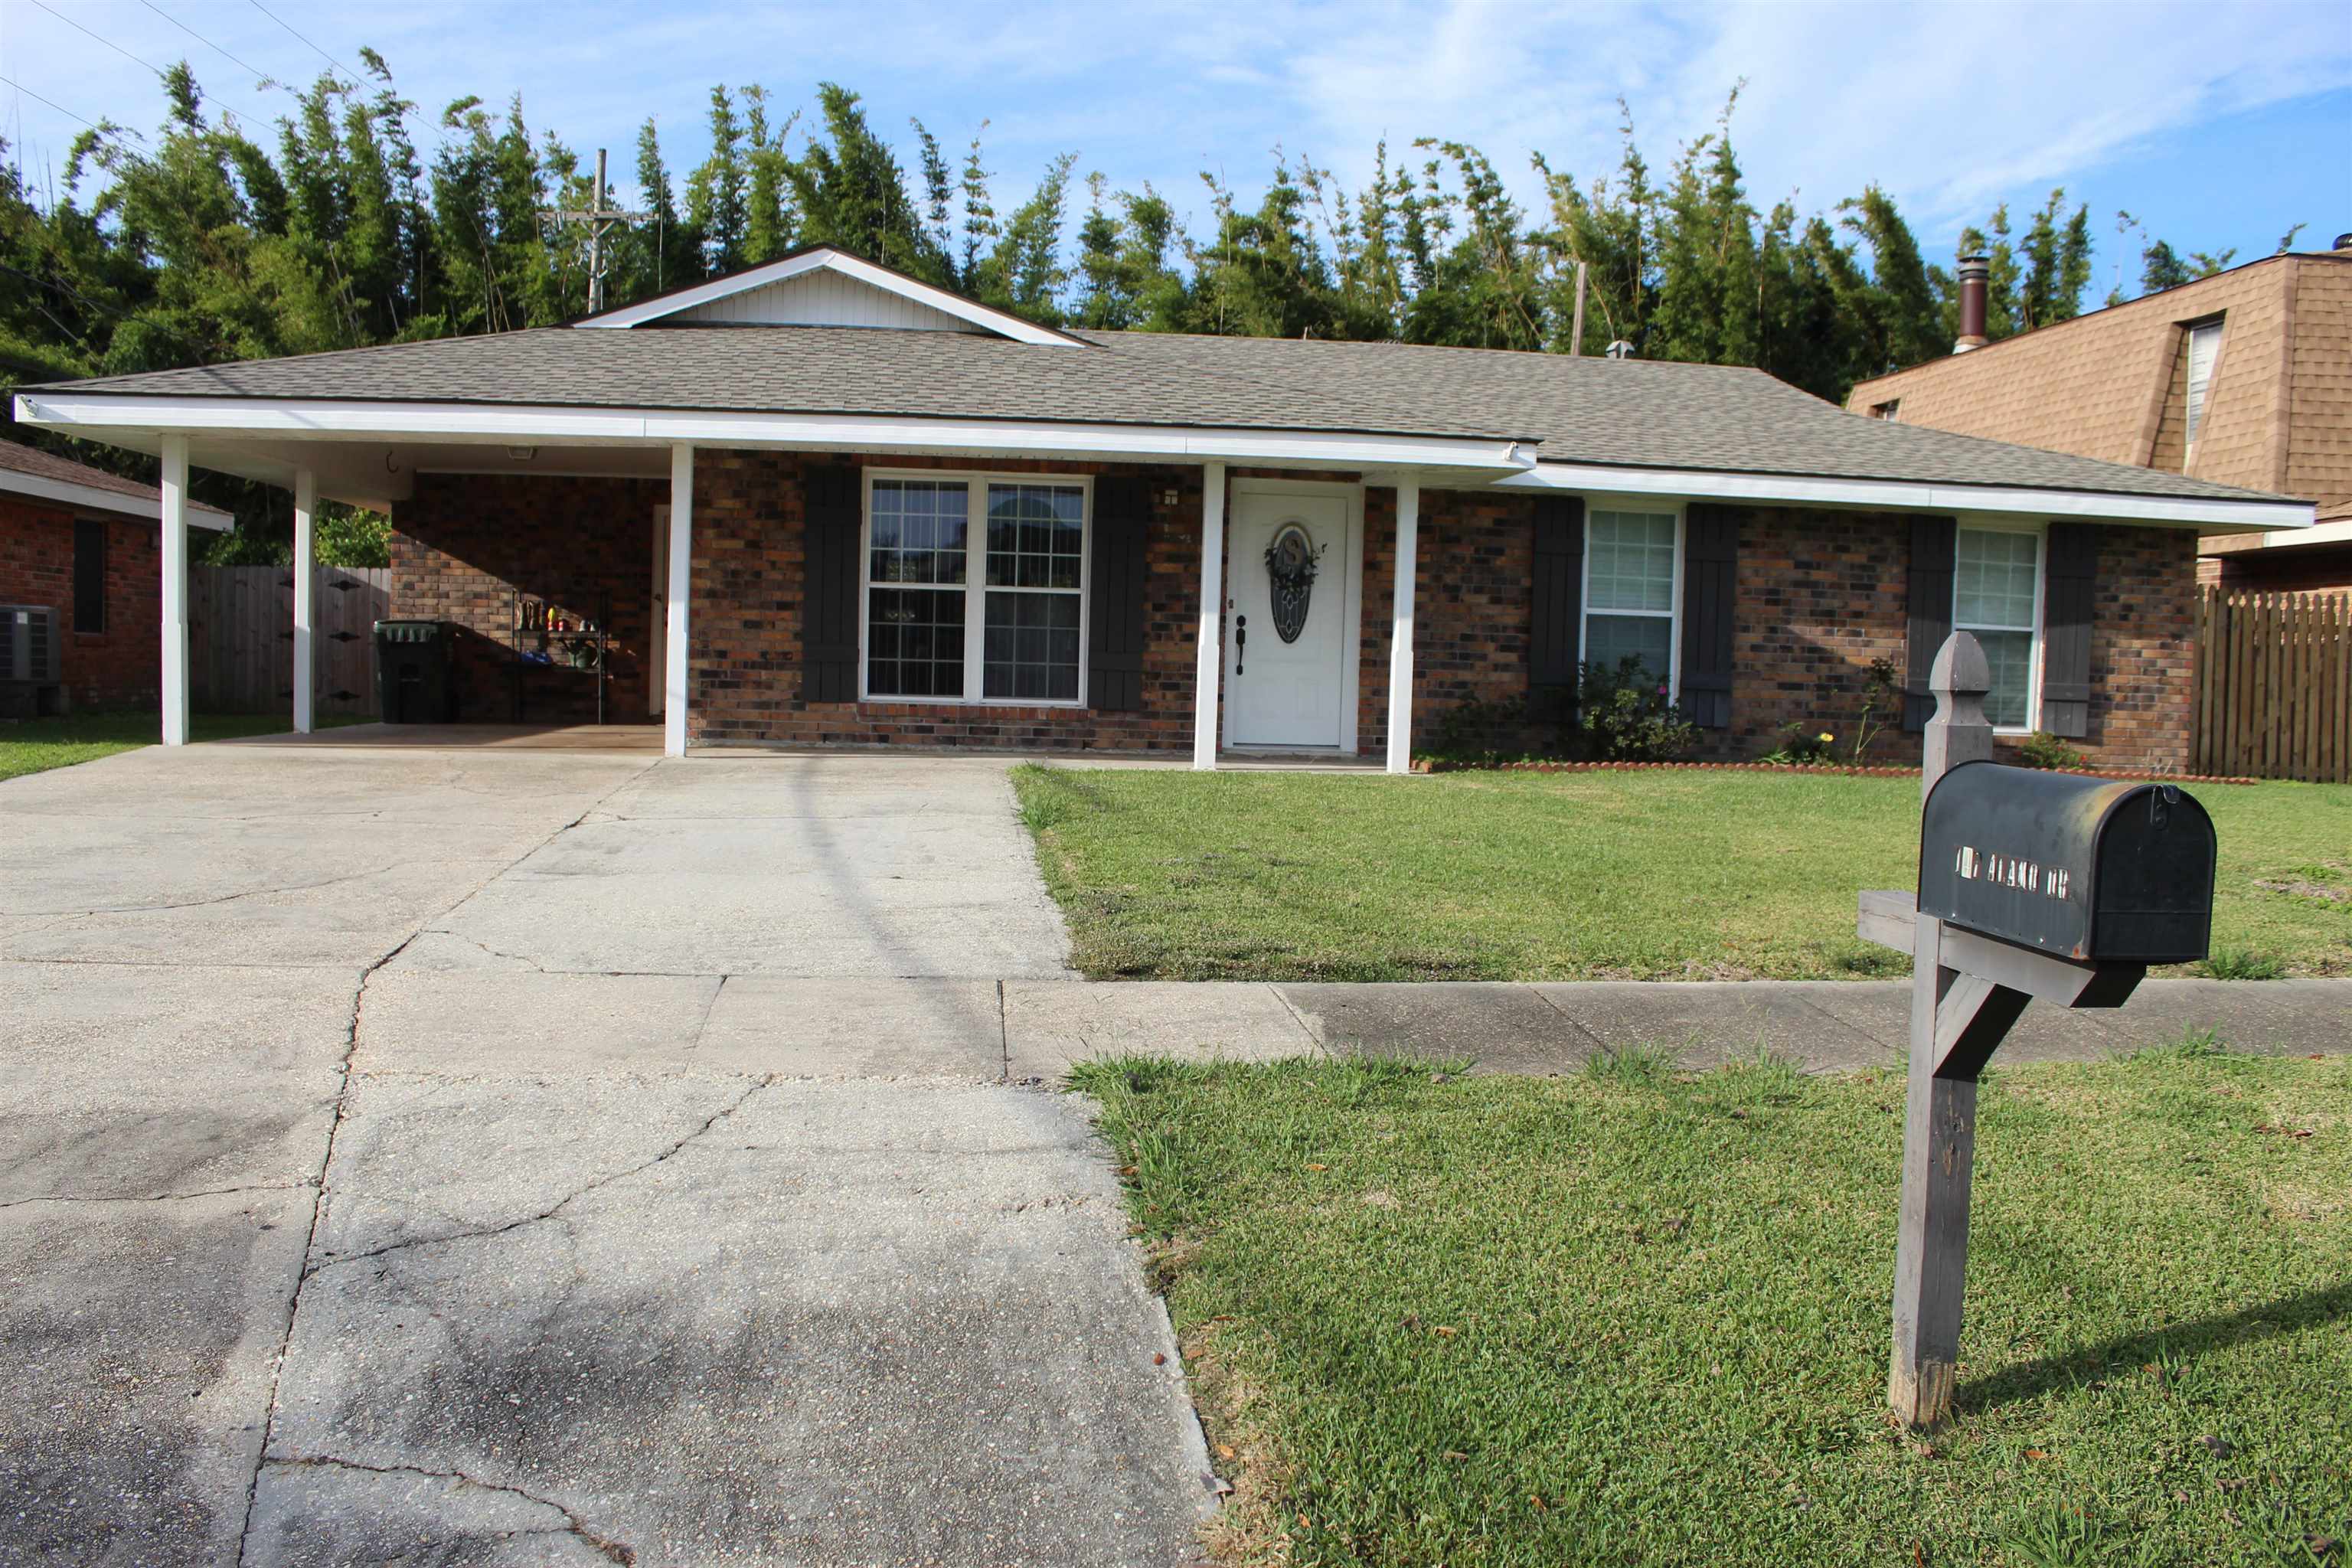
Active
$245,000
3
bds
|
2
ba
|
1,700
sqft
|
built
1967
170 Alamo Dr, Houma, LA 70360
$-55
Cash flow
-1.2%
Cash-on-Cash Return
5.4%
Cap rate
0.7%
Rent to Value Ratio
Active
$210,000
3
bds
|
1
ba
|
1,511
sqft
|
built
1958
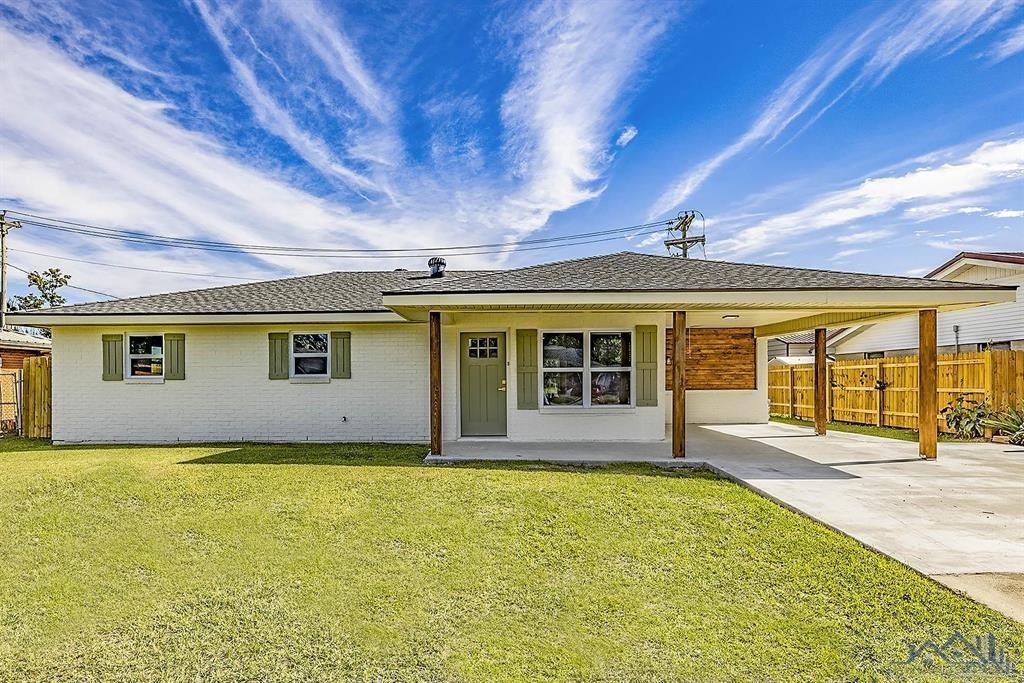
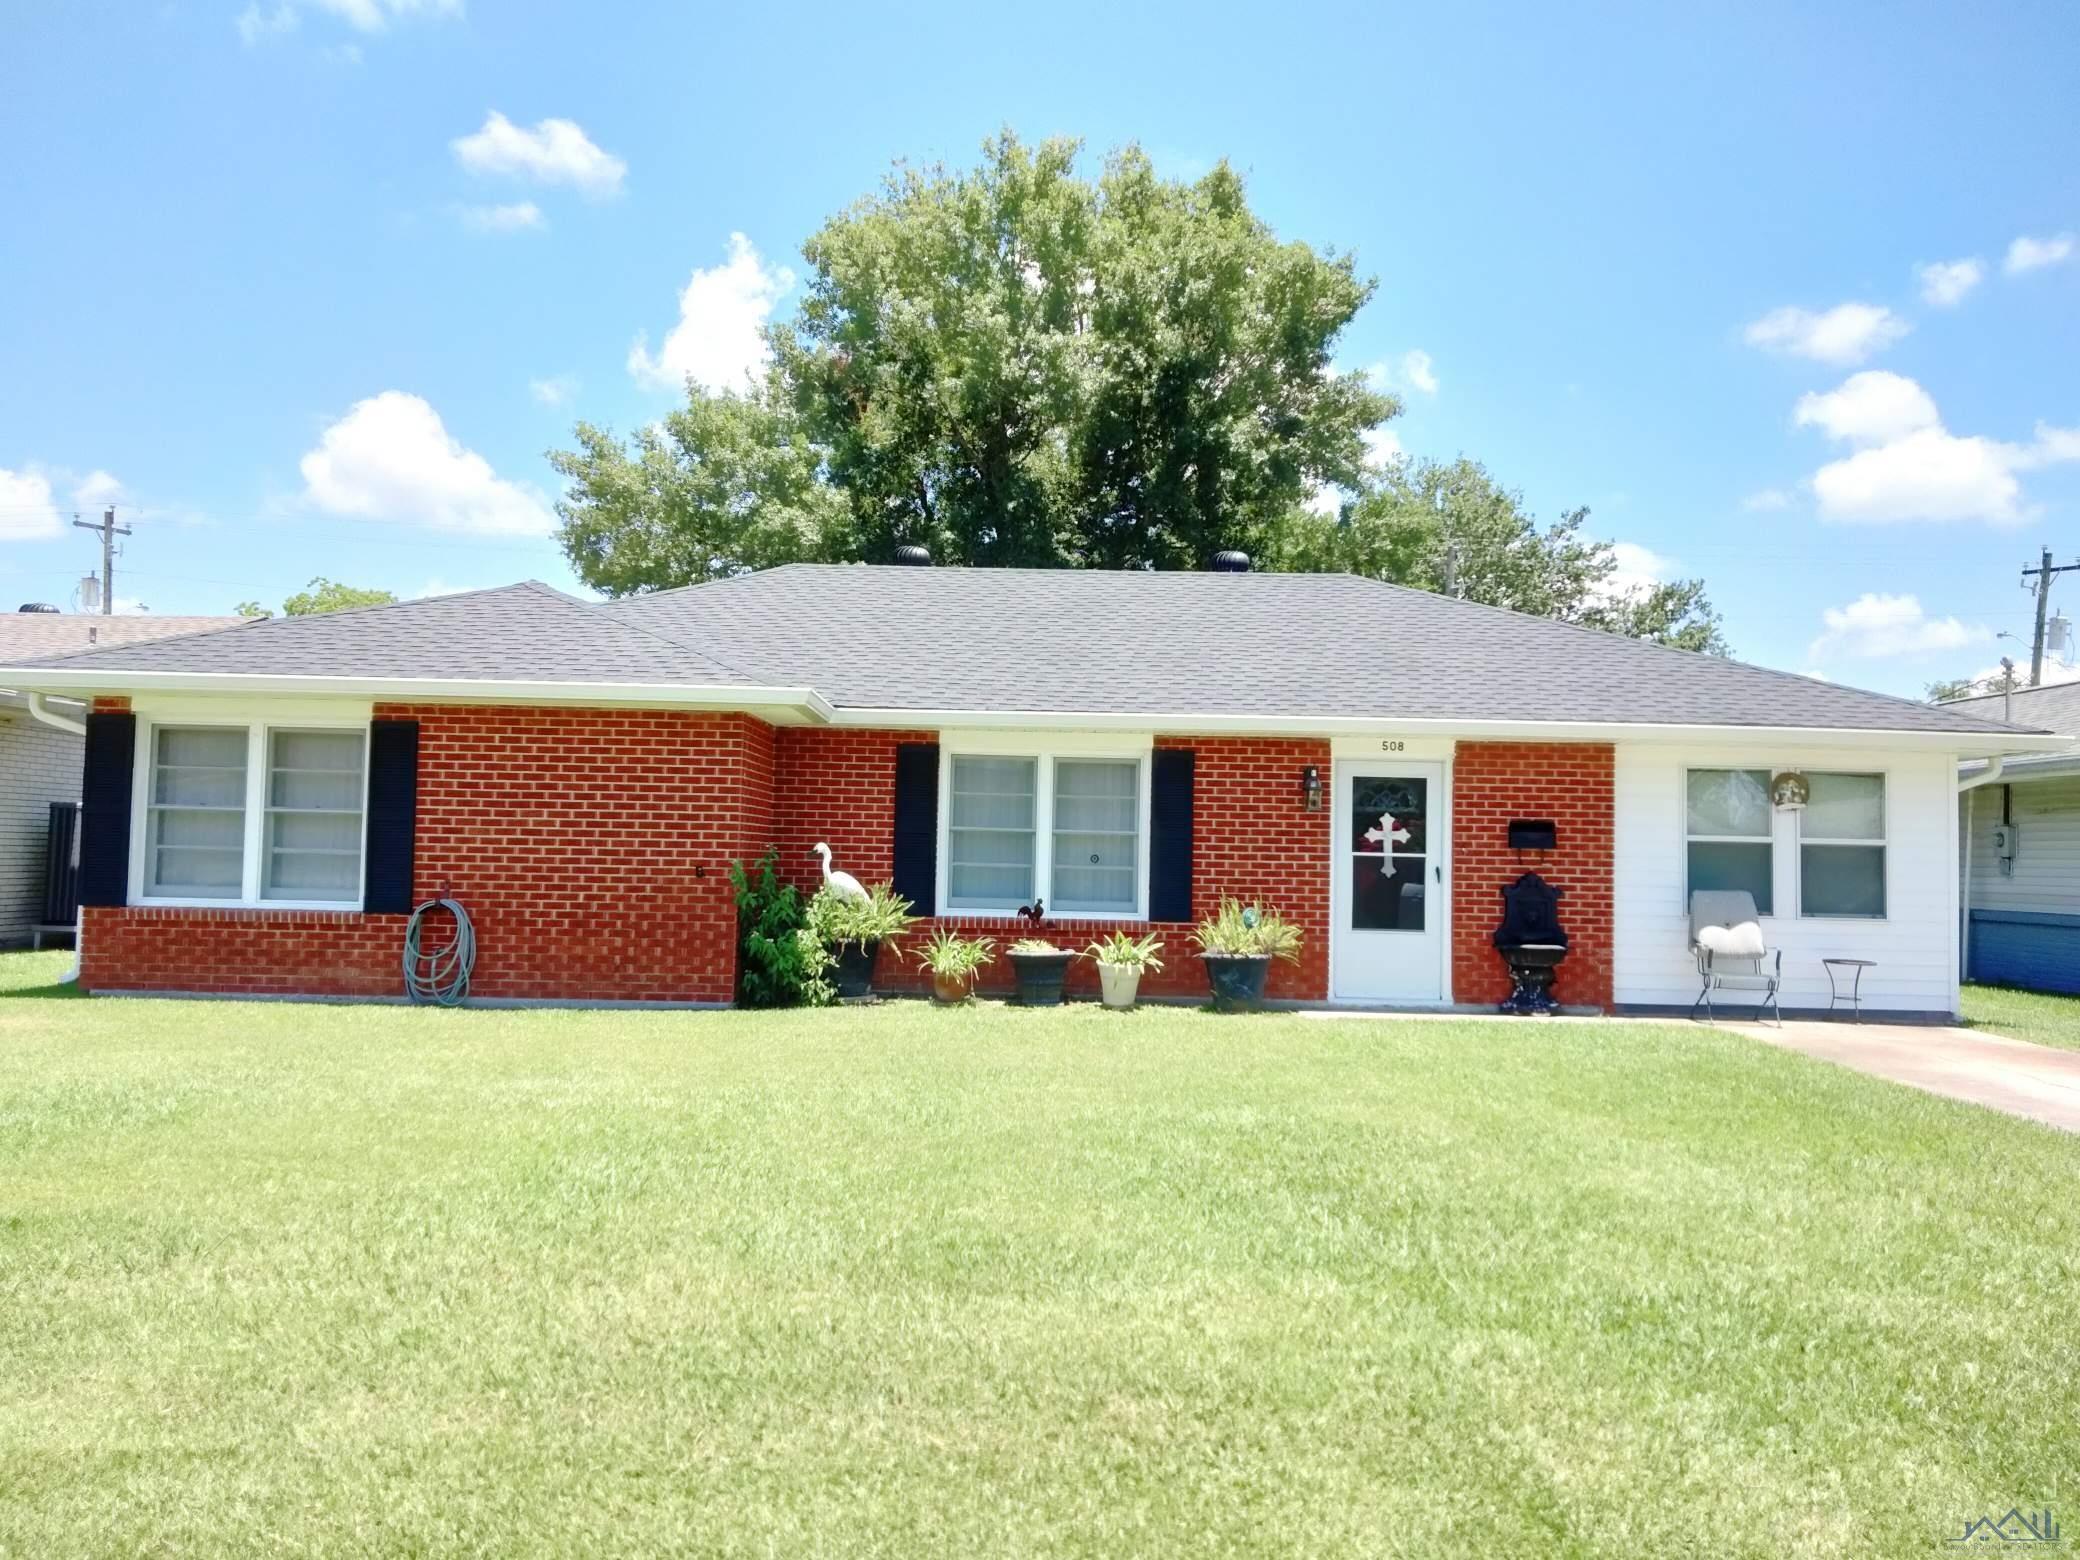
508 Forest Blvd, Houma, LA 70360
$110
Cash flow
2.7%
Cash-on-Cash Return
6.3%
Cap rate
0.8%
Rent to Value Ratio
Active
$175,000
4
bds
|
3
ba
|
2,772
sqft
|
built
1973
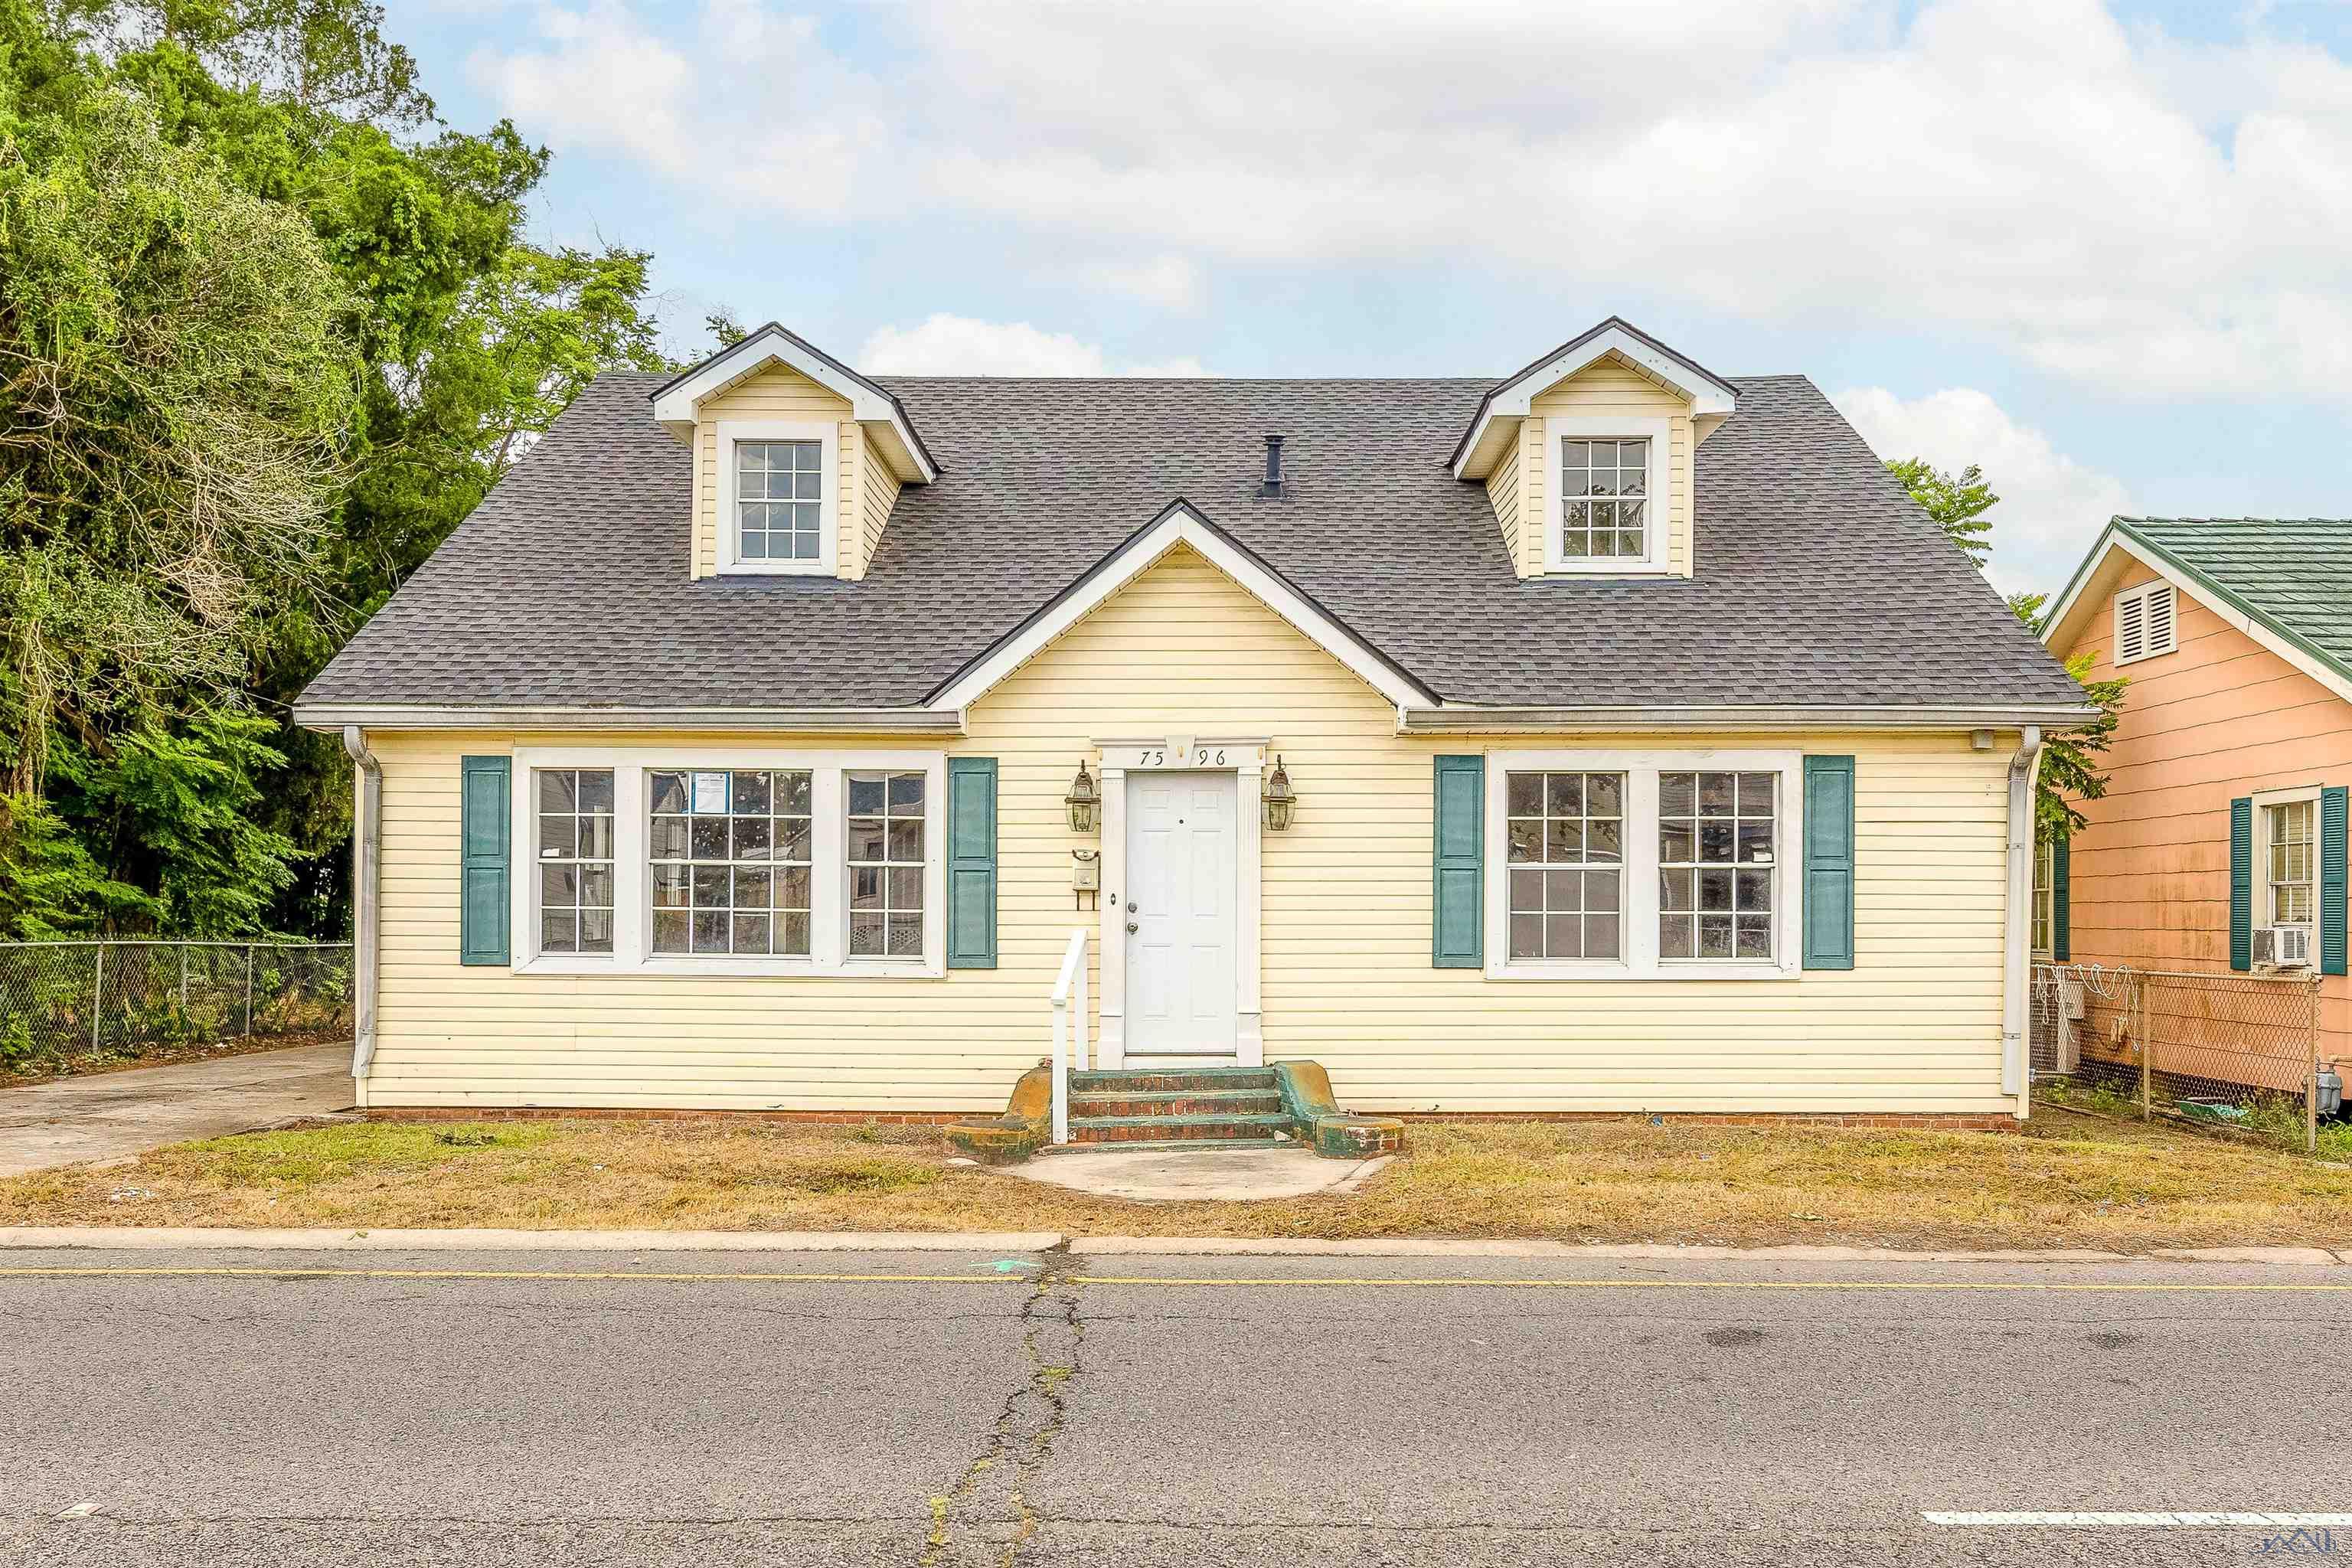
7596 Park Ave, Houma, LA 70364
$138
Cash flow
4.1%
Cash-on-Cash Return
6.6%
Cap rate
0.8%
Rent to Value Ratio
Active
$289,000
3
bds
|
2
ba
|
2,294
sqft
|
built
1980
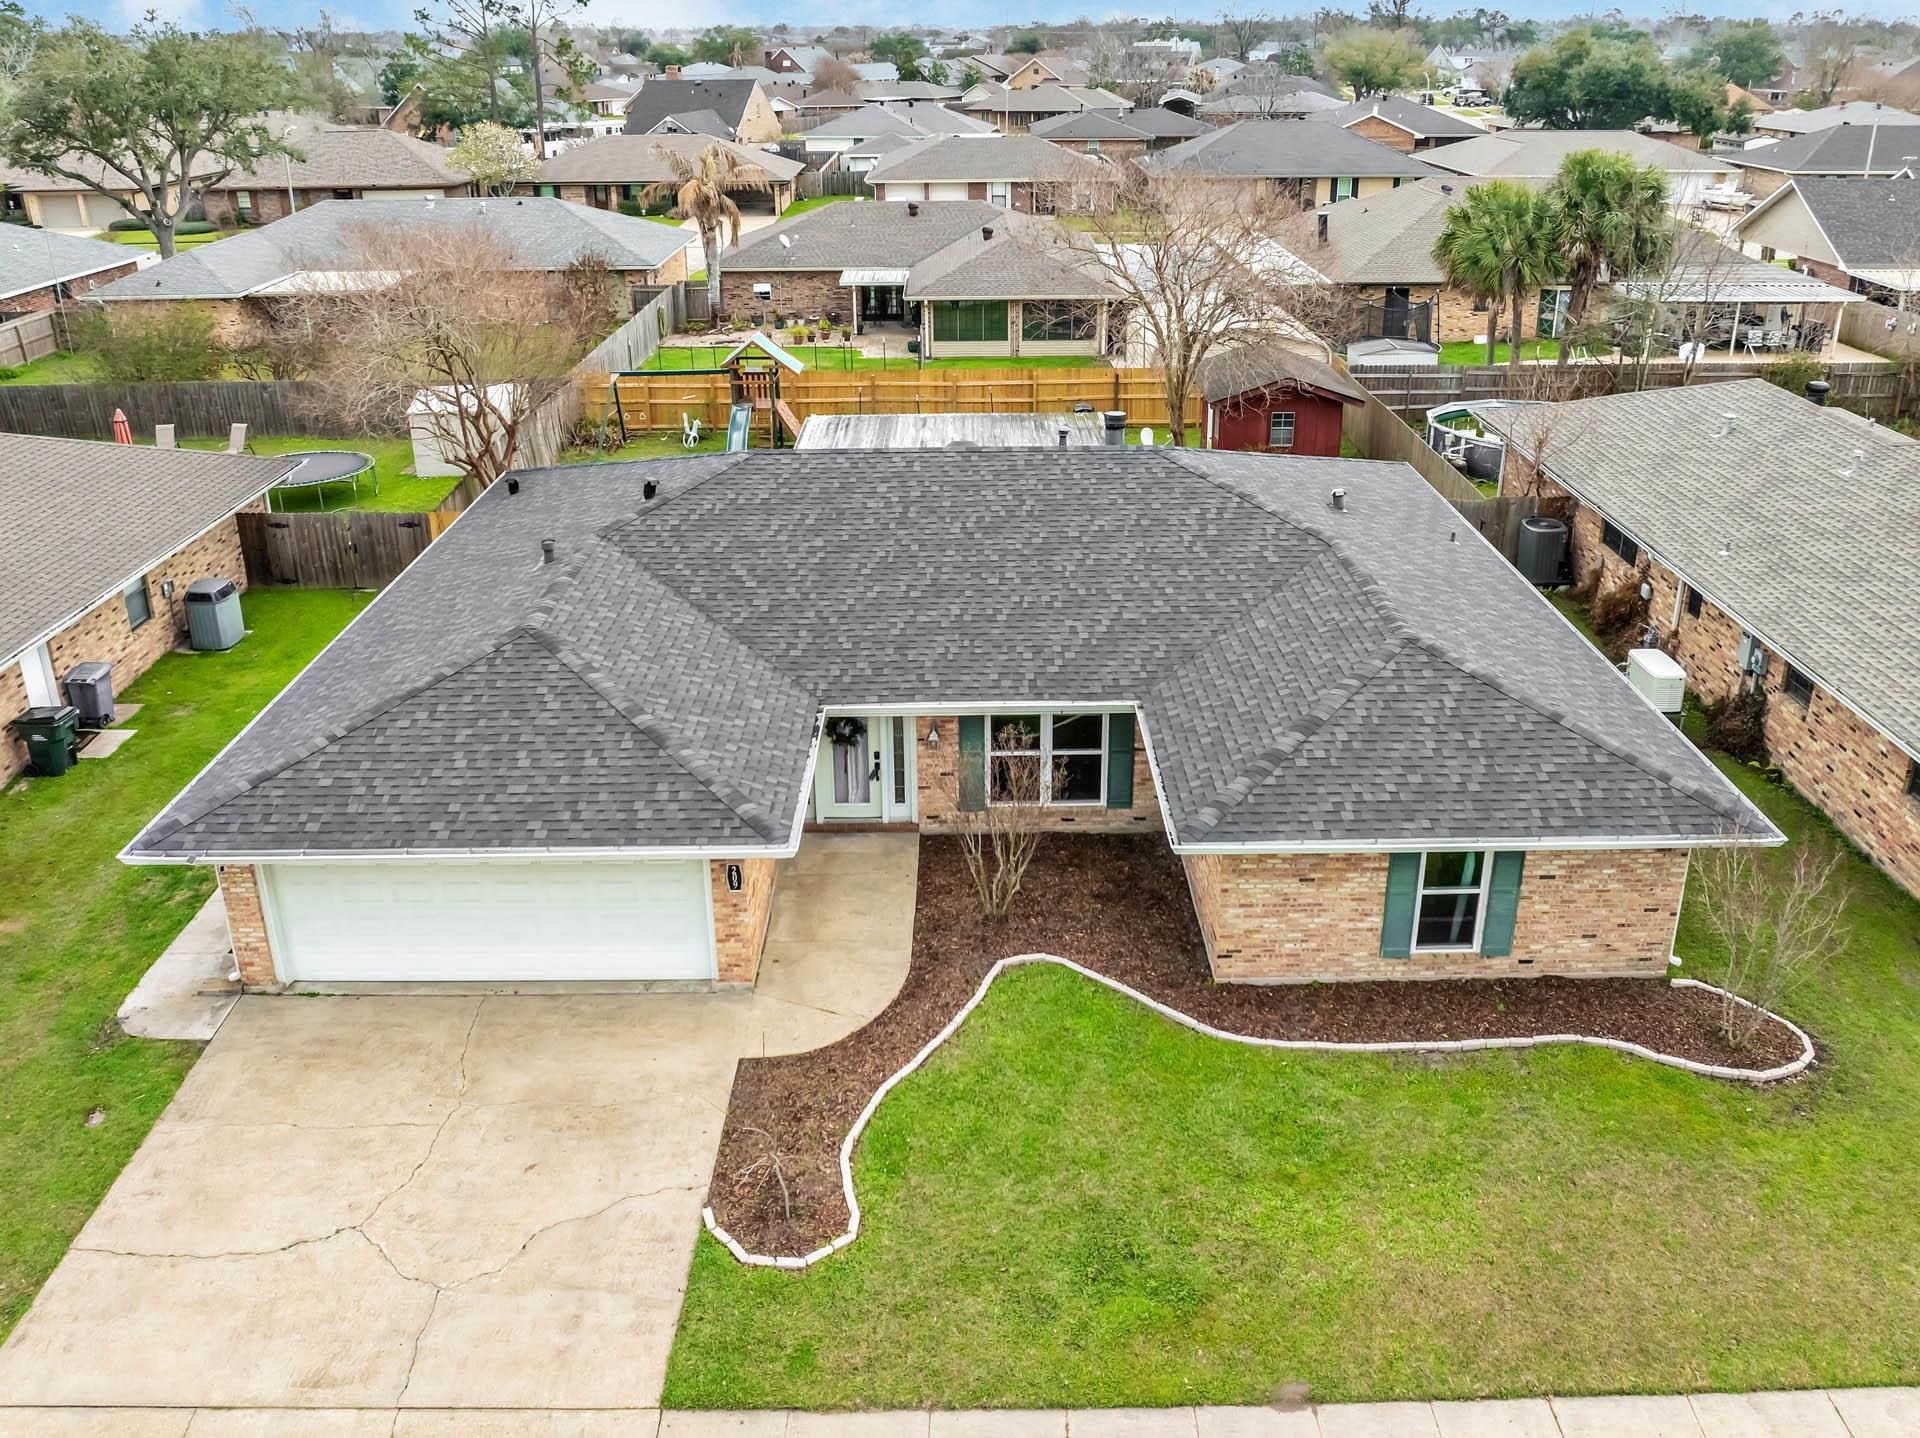
209 Coachman Dr, Houma, LA 70360
$12
Cash flow
0.2%
Cash-on-Cash Return
5.7%
Cap rate
0.7%
Rent to Value Ratio
Active
$185,000
3
bds
|
1
ba
|
1,531
sqft
|
built
1979
406 Dauphine Ave, Houma, LA 70363
$22
Cash flow
0.6%
Cash-on-Cash Return
5.8%
Cap rate
0.7%
Rent to Value Ratio
Active
$72,500
2
bds
|
1
ba
|
1,051
sqft
|
built
2002
1230 Lacroix Dr, Houma, LA 70364
$621
Cash flow
10.0%
Cash-on-Cash Return
10.3%
Cap rate
1.2%
Rent to Value Ratio
Active
$332,900
3
bds
|
2
ba
|
2,016
sqft
|
built
1996
324 Hawthorne Dr, Houma, LA 70360
$-333
Cash flow
-5.2%
Cash-on-Cash Return
4.5%
Cap rate
0.5%
Rent to Value Ratio
Active
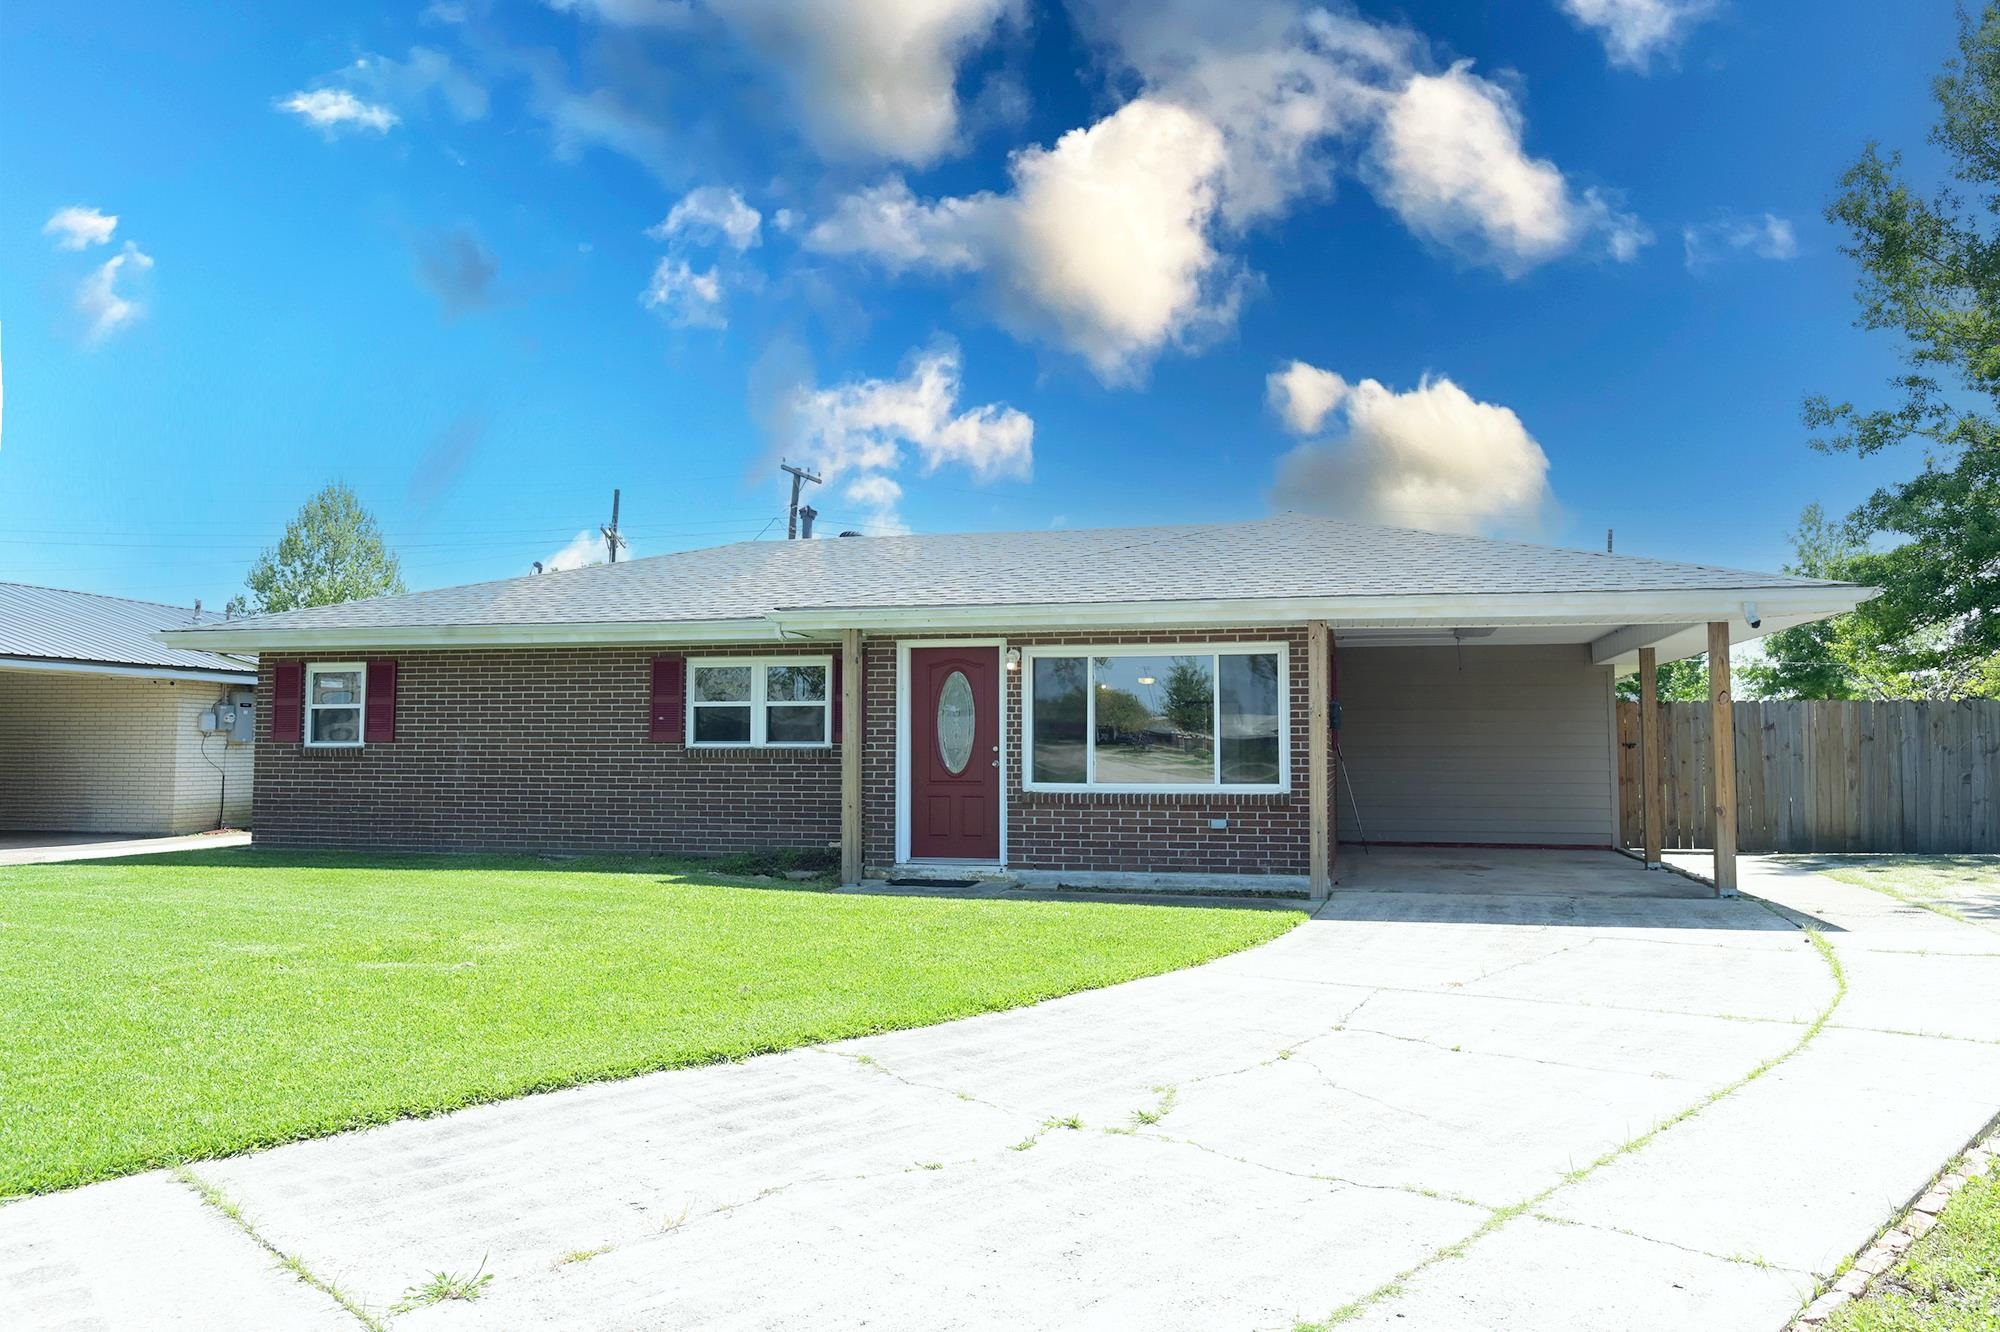
$185,000
3
bds
|
1
ba
|
1,270
sqft
|
built
1962
806 Kenney St, Houma, LA 70364
$91
Cash flow
2.6%
Cash-on-Cash Return
6.3%
Cap rate
0.8%
Rent to Value Ratio
Active
$112,000
3
bds
|
2
ba
|
1,146
sqft
|
built
1971
309 Agnes St, Houma, LA 70363
$436
Cash flow
20.3%
Cash-on-Cash Return
10.4%
Cap rate
1.3%
Rent to Value Ratio
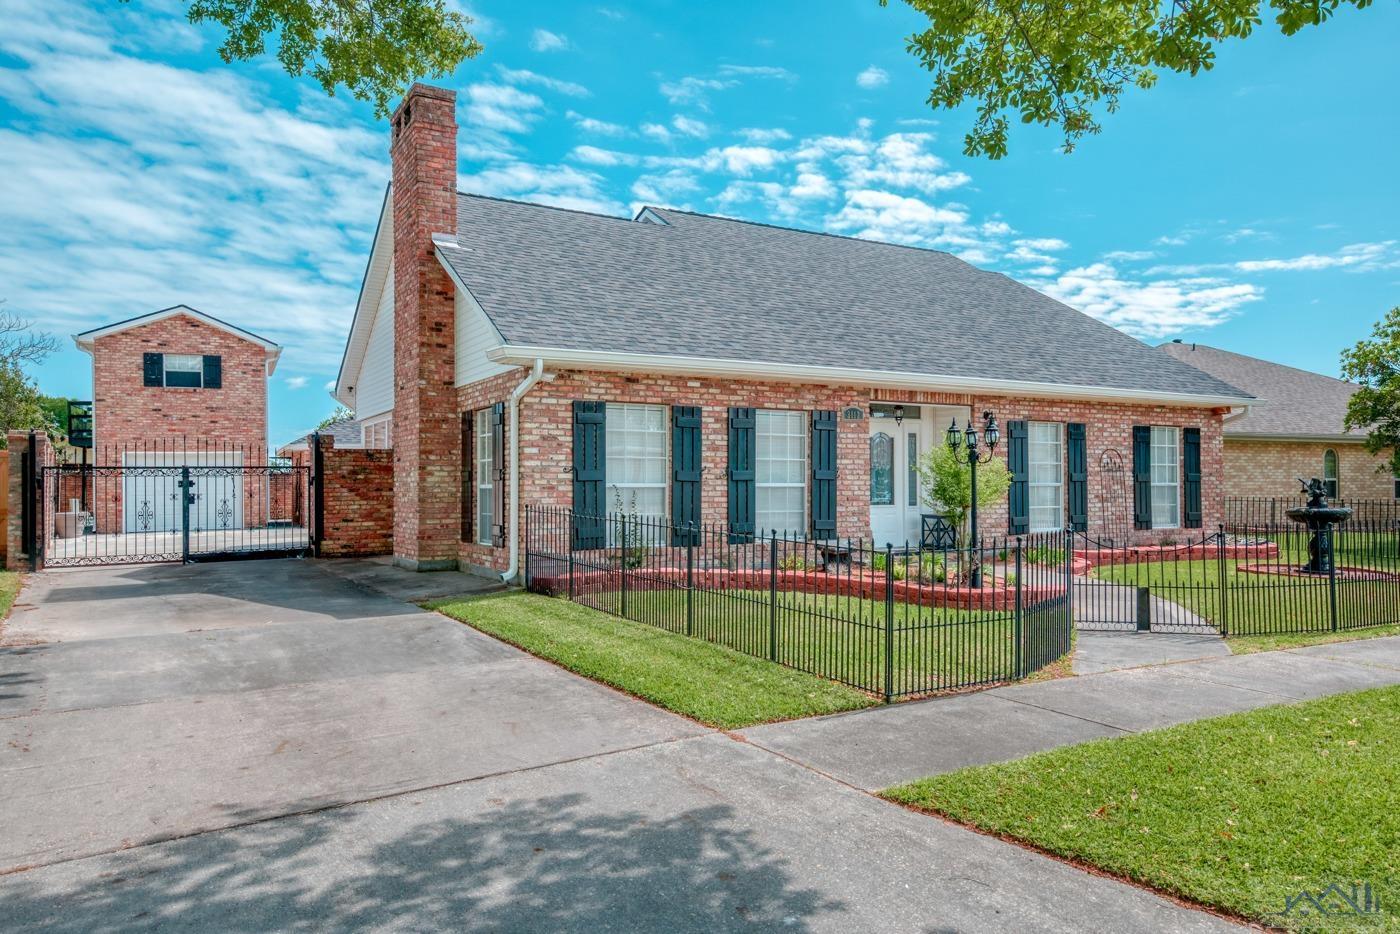
Active
$245,000
3
bds
|
2
ba
|
1,600
sqft
|
built
1968
147 Alamo Dr, Houma, LA 70360
$-55
Cash flow
-1.2%
Cash-on-Cash Return
5.4%
Cap rate
0.7%
Rent to Value Ratio
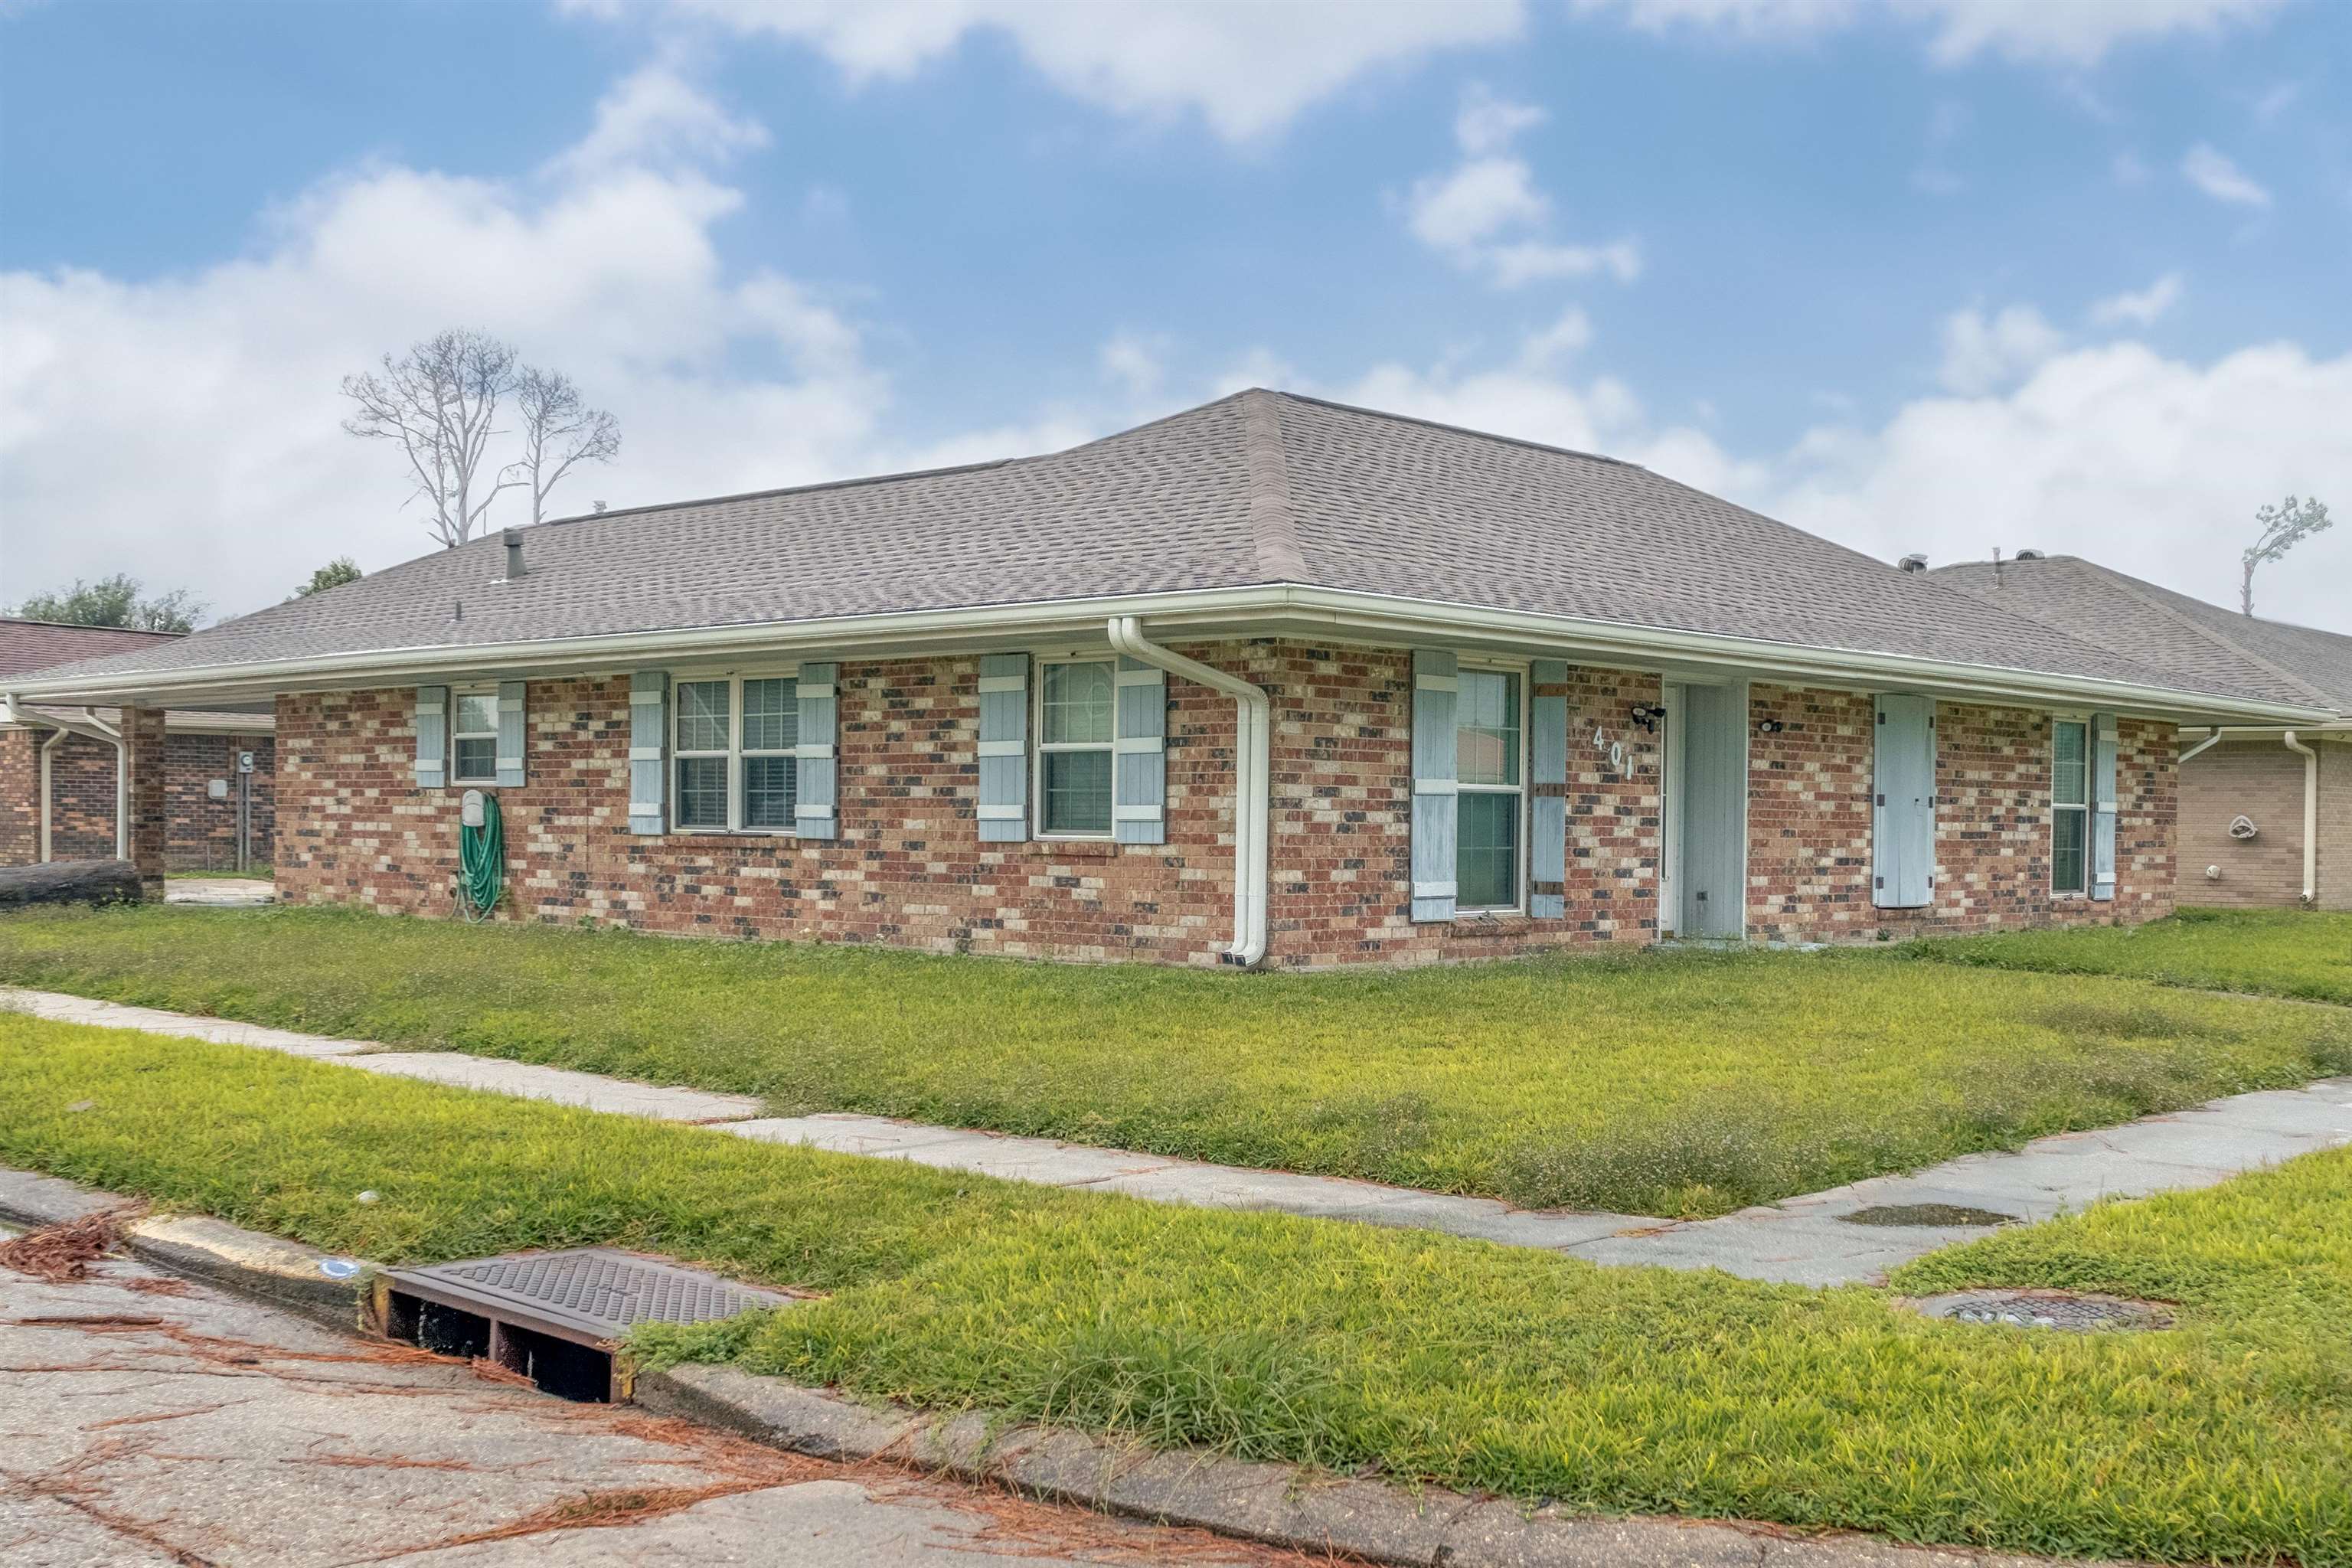
Active
$185,000
3
bds
|
2
ba
|
1,633
sqft
|
built
1970
401 Mary Hughes Dr, Houma, LA 70363
$91
Cash flow
2.6%
Cash-on-Cash Return
6.3%
Cap rate
0.8%
Rent to Value Ratio
Active
$289,000
3
bds
|
2
ba
|
1,700
sqft
|
built
2003
133 Tigerlily Dr, Houma, LA 70360
$-264
Cash flow
-4.8%
Cash-on-Cash Return
4.6%
Cap rate
0.6%
Rent to Value Ratio
Active
$294,000
3
bds
|
3
ba
|
2,213
sqft
|
built
1990
3012 Creole Dr, Houma, LA 70364
$-287
Cash flow
-5.1%
Cash-on-Cash Return
4.5%
Cap rate
0.5%
Rent to Value Ratio
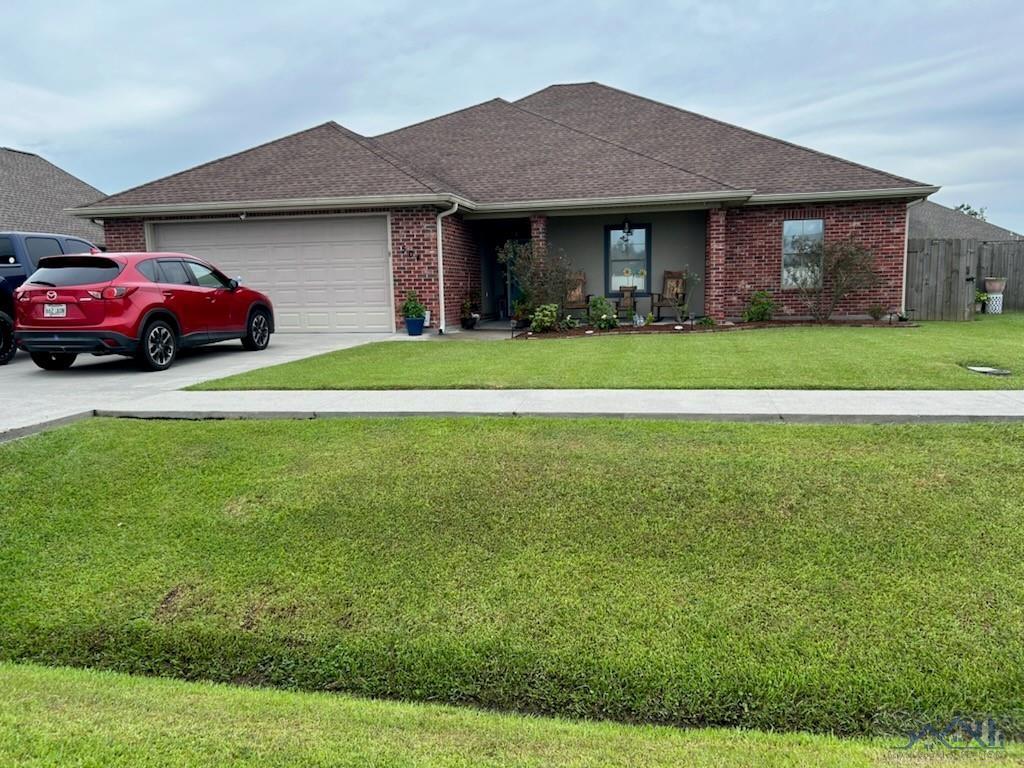
Active
$269,000
4
bds
|
3
ba
|
1,889
sqft
|
built
2013
445 Christopher Dr, Houma, LA 70364
$-169
Cash flow
-3.3%
Cash-on-Cash Return
4.9%
Cap rate
0.6%
Rent to Value Ratio
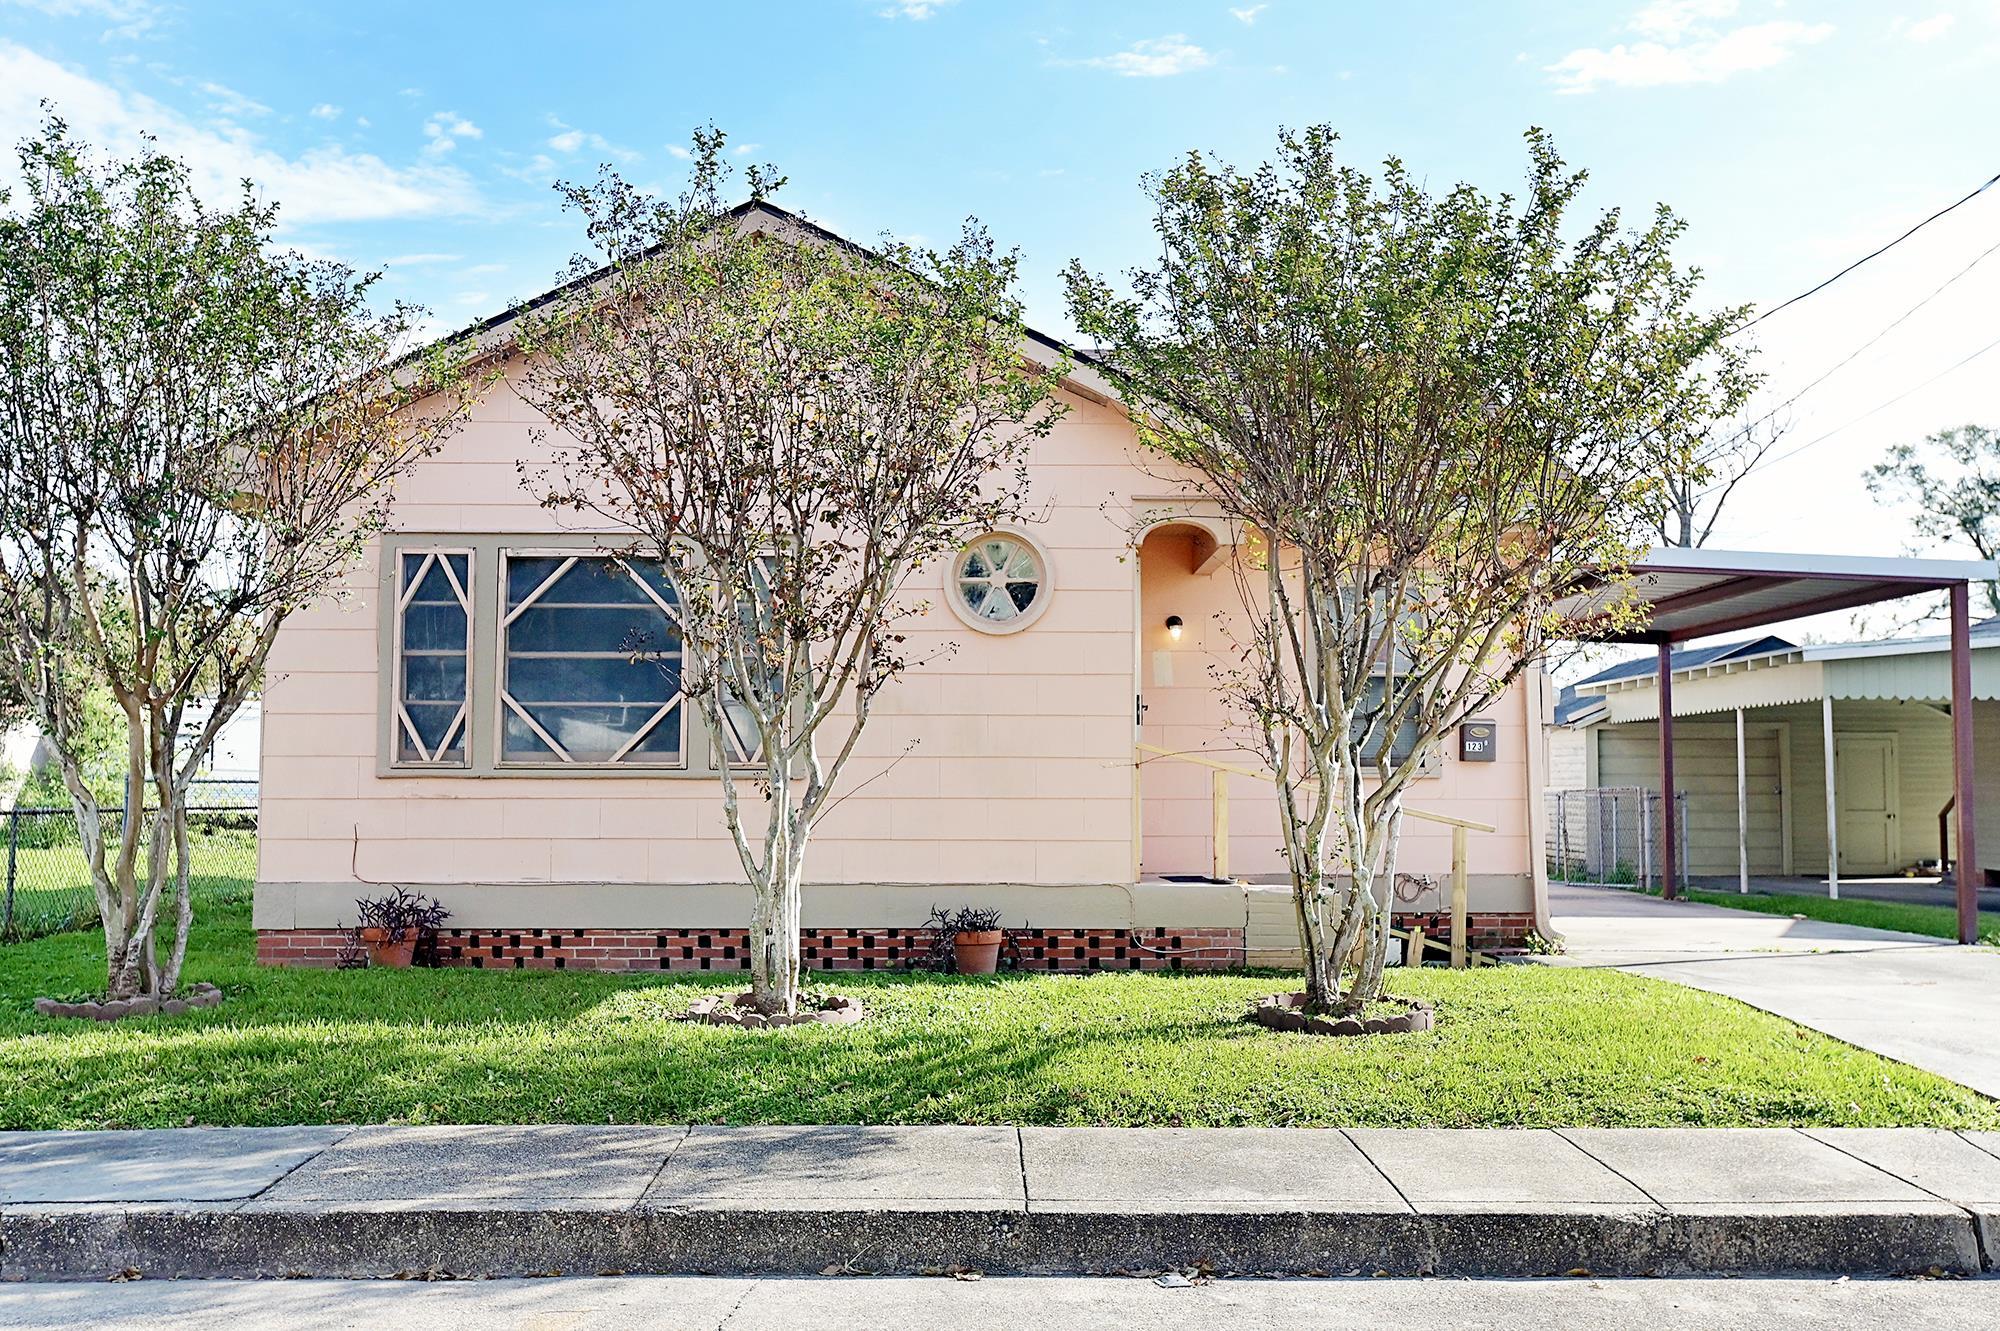
Active
$134,000
3
bds
|
1
ba
|
1,000
sqft
|
built
1959
123 Louise St, Houma, LA 70363
$263
Cash flow
10.2%
Cash-on-Cash Return
8.0%
Cap rate
1.0%
Rent to Value Ratio
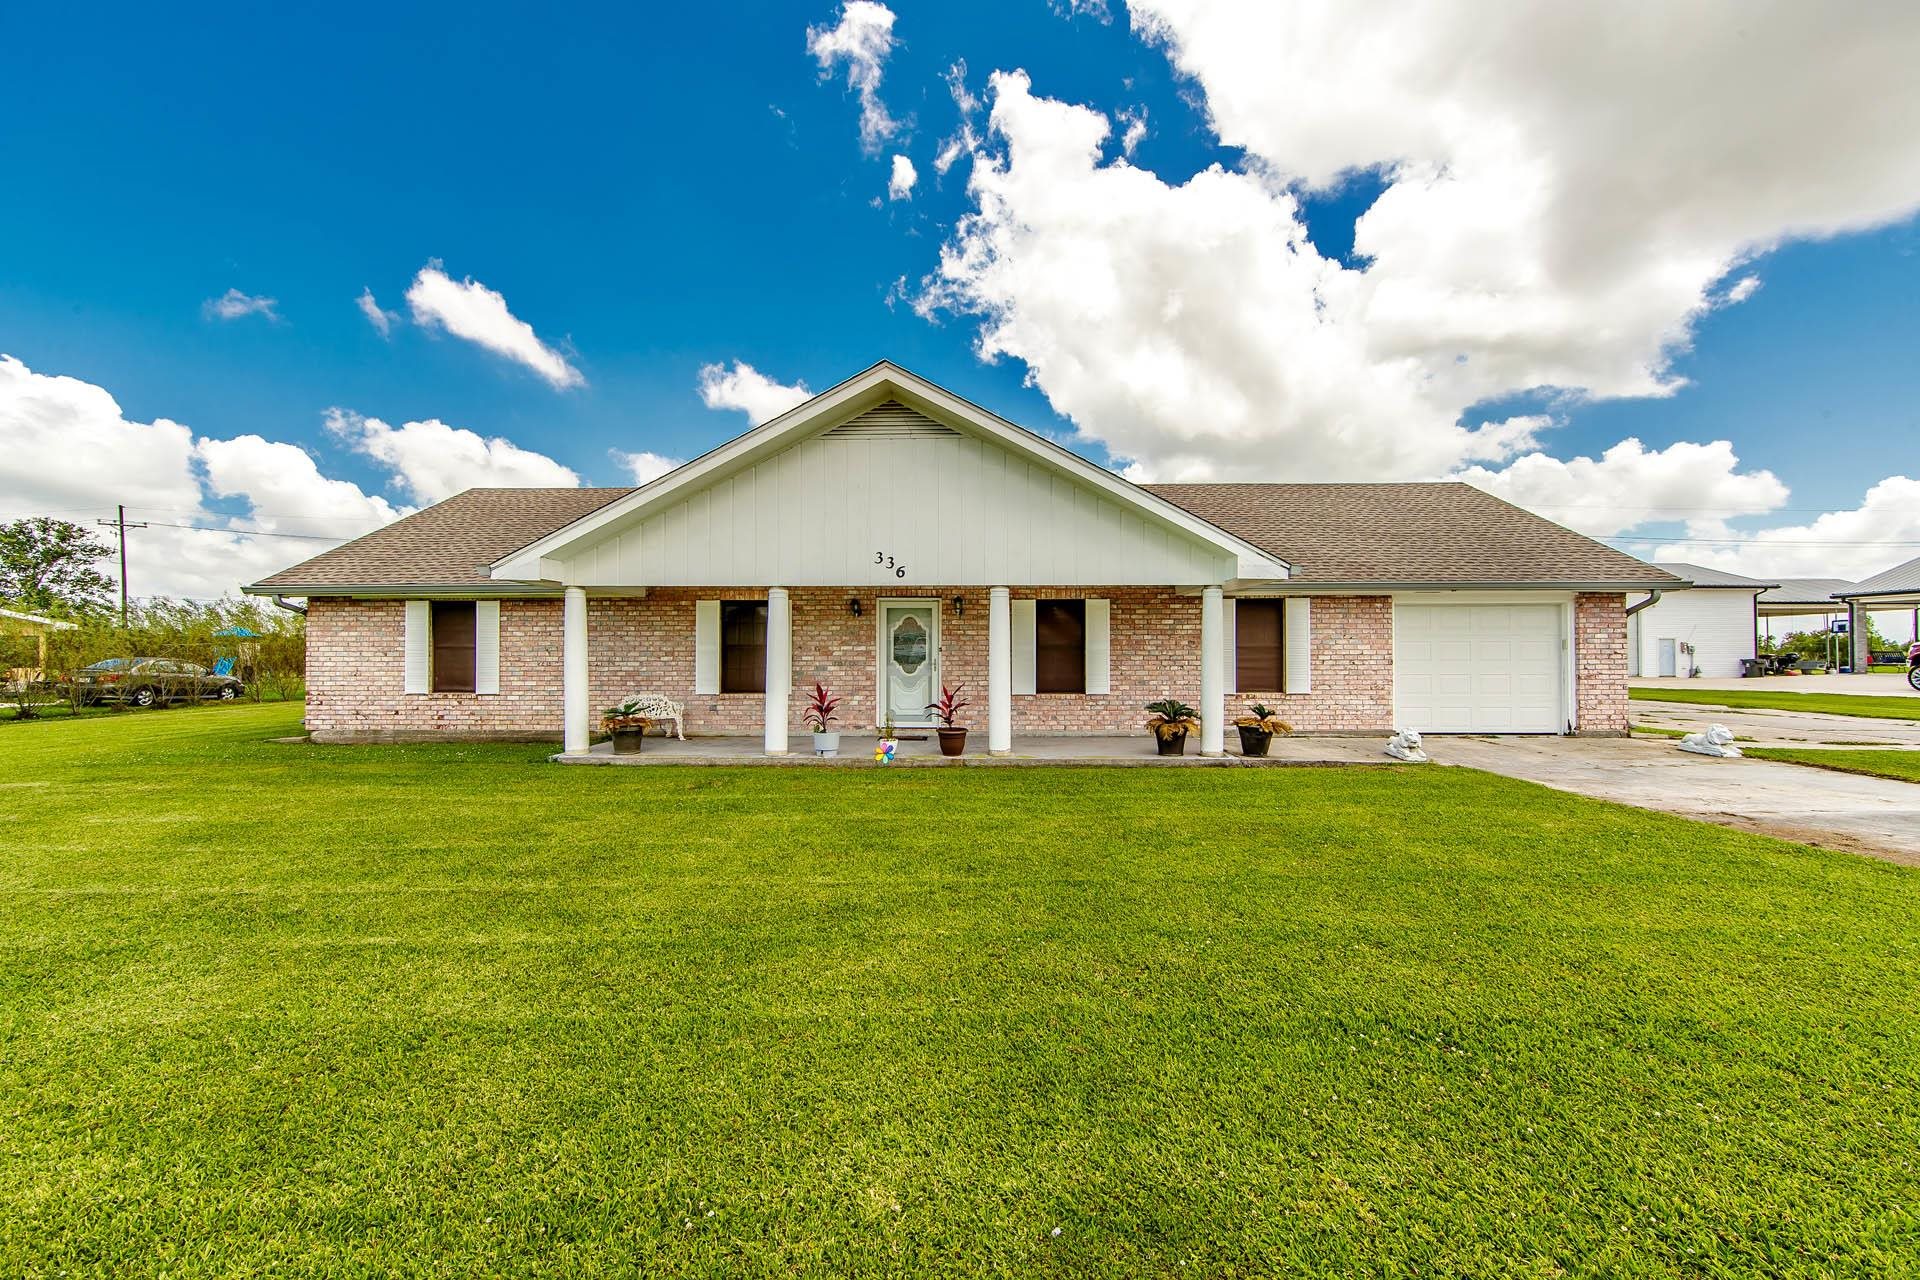
Active
$289,000
4
bds
|
2
ba
|
2,605
sqft
|
built
1994
336 E Woodlawn Ranch Rd, Houma, LA 70363
$-402
Cash flow
-7.3%
Cash-on-Cash Return
4.0%
Cap rate
0.5%
Rent to Value Ratio
Active
$599,000
6
bds
|
3
ba
|
3,588
sqft
|
built
2012
1705 Bayou Black Dr, Houma, LA 70360
$-1,248
Cash flow
-10.9%
Cash-on-Cash Return
3.2%
Cap rate
0.4%
Rent to Value Ratio
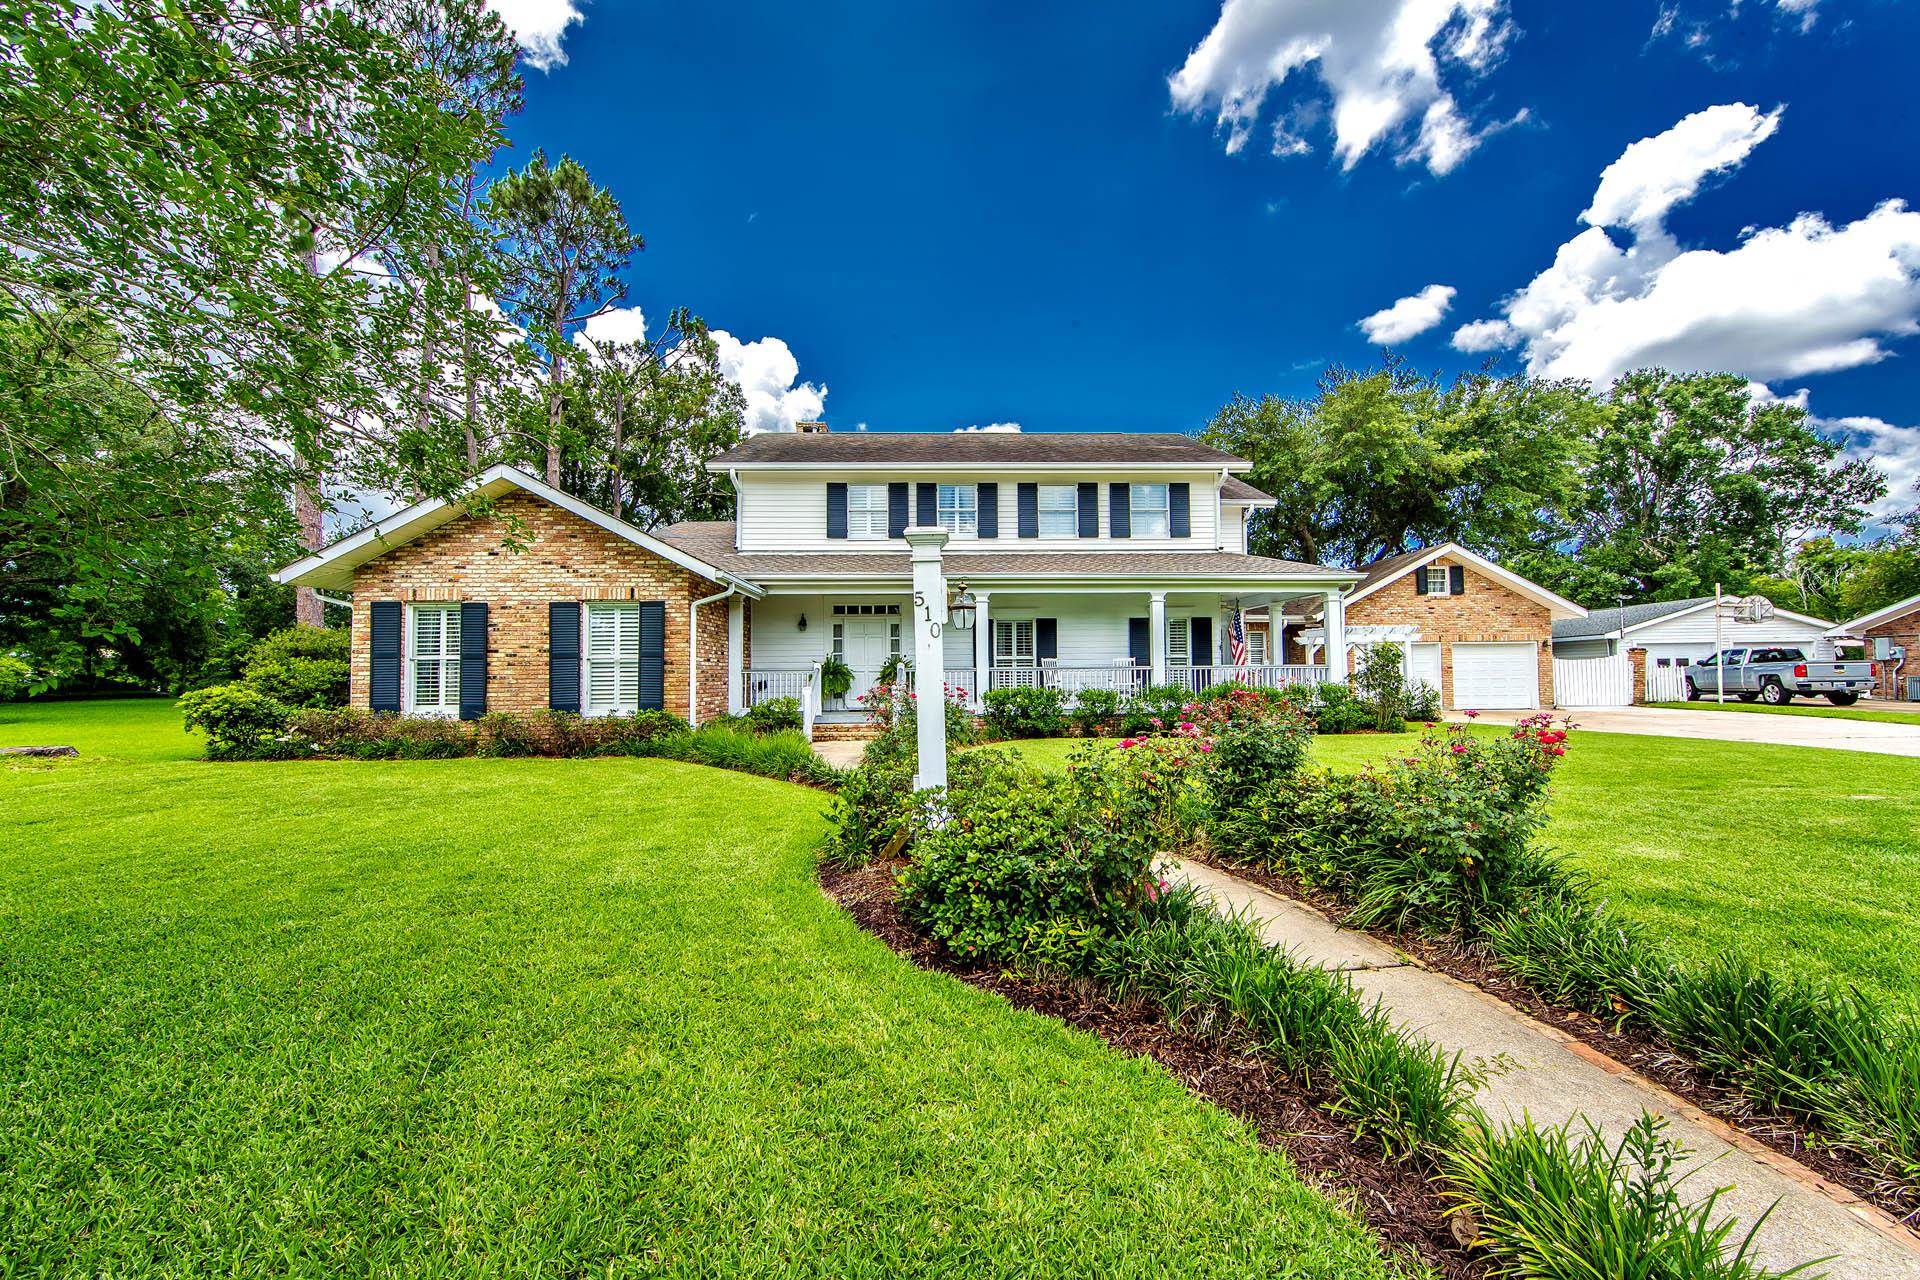
Active
$985,000
5
bds
|
4
ba
|
5,960
sqft
|
built
1985
510 Amarillo Dr, Houma, LA 70360
$-3,143
Cash flow
-16.6%
Cash-on-Cash Return
1.8%
Cap rate
0.2%
Rent to Value Ratio
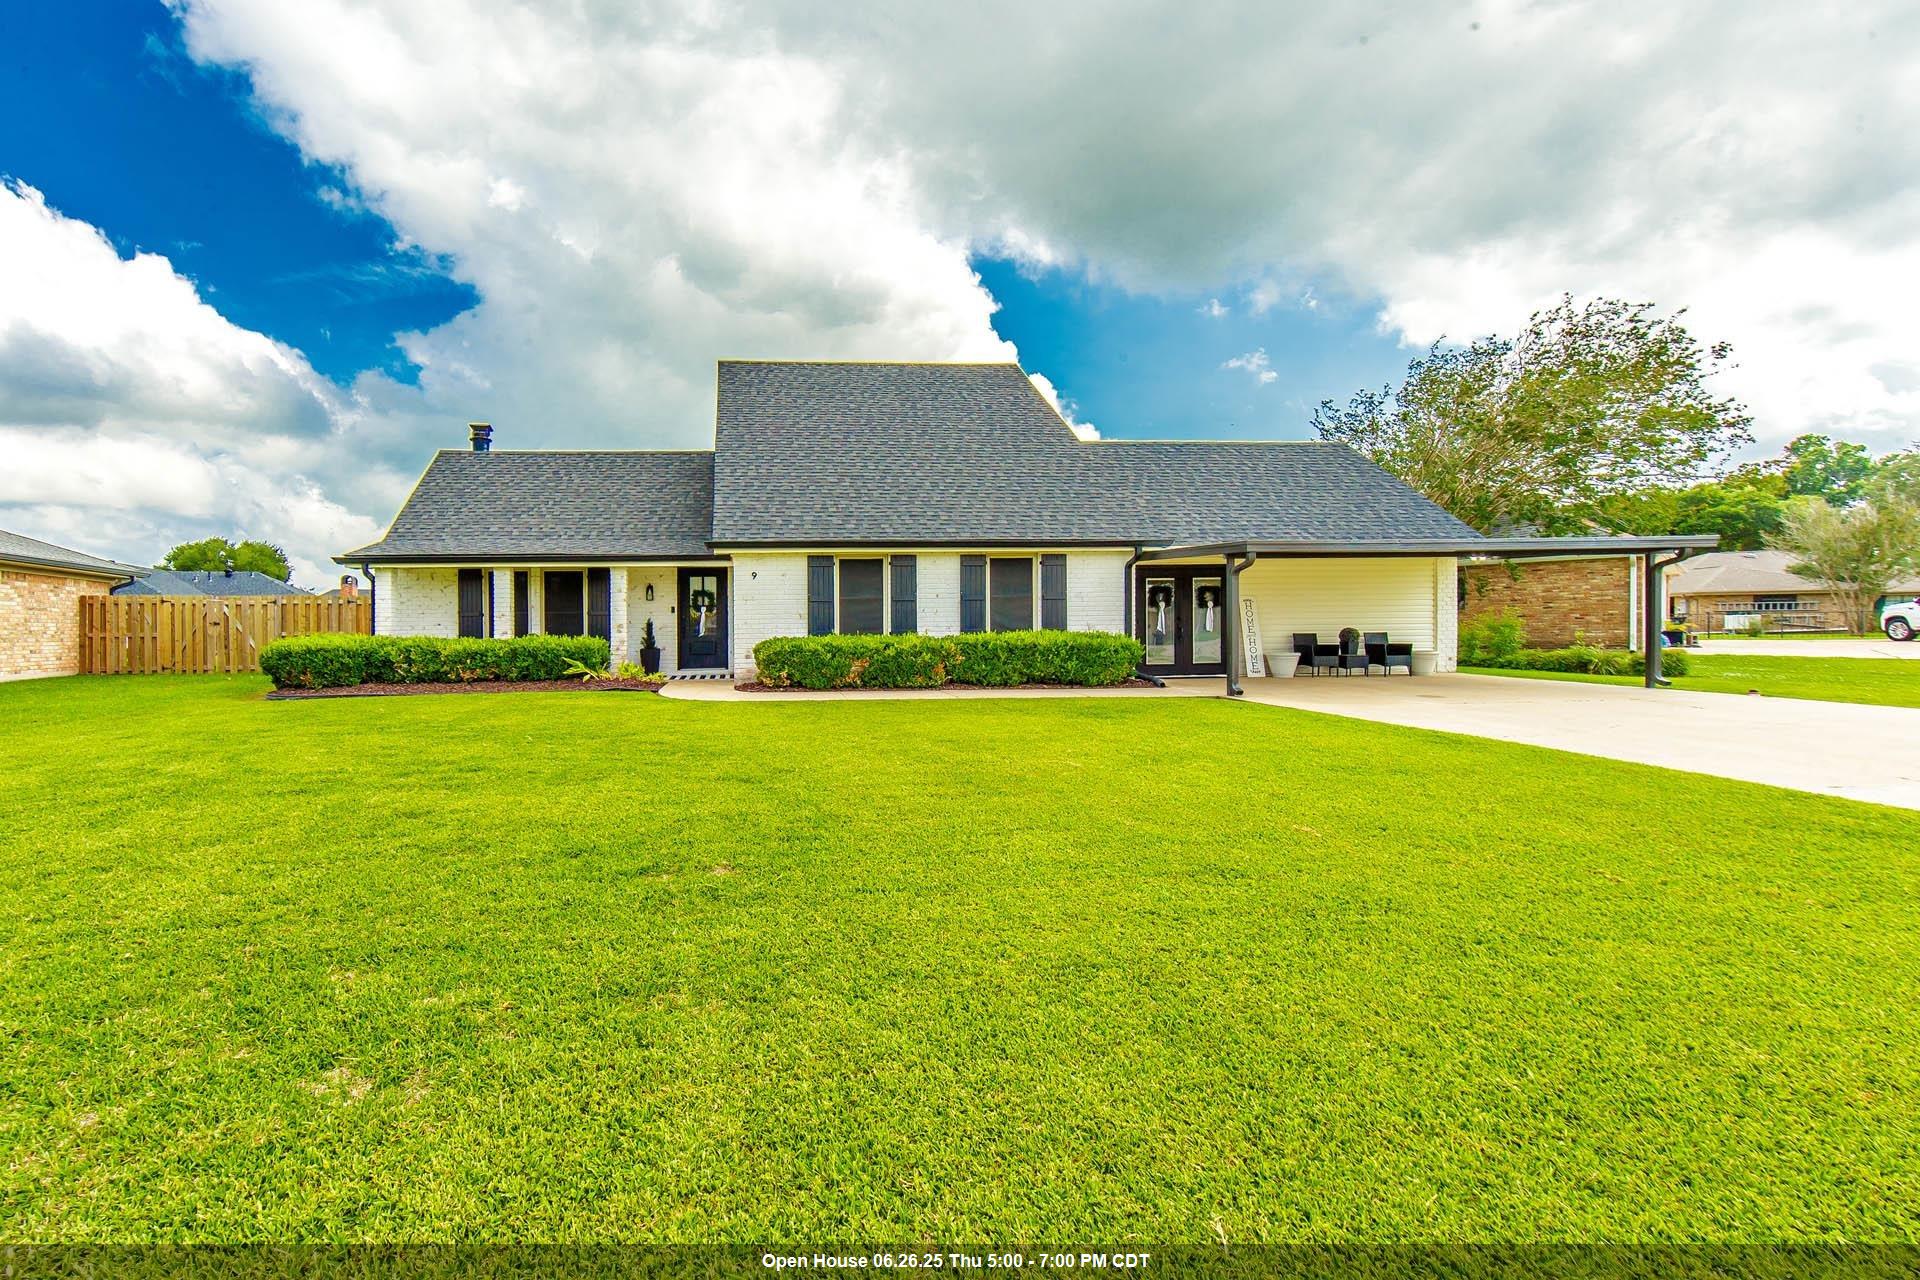
Active
$430,000
4
bds
|
3
ba
|
2,486
sqft
|
built
1984
9 Summerfield Dr, Houma, LA 70360
$-793
Cash flow
-9.6%
Cash-on-Cash Return
3.5%
Cap rate
0.4%
Rent to Value Ratio
Active
$190,000
3
bds
|
2
ba
|
1,533
sqft
|
built
1980
816 Chene Dr, Houma, LA 70364
$67
Cash flow
1.8%
Cash-on-Cash Return
6.1%
Cap rate
0.7%
Rent to Value Ratio
Active
$90,000
3
bds
|
1
ba
|
1,407
sqft
|
built
1954
1006 Franklin Ave, Houma, LA 70364
$471
Cash flow
27.3%
Cash-on-Cash Return
12.0%
Cap rate
1.4%
Rent to Value Ratio
Active
$1,150,000
4
bds
|
5
ba
|
5,700
sqft
|
built
2006
1120 Museum Dr, Houma, LA 70360
$-4,062
Cash flow
-18.4%
Cash-on-Cash Return
1.4%
Cap rate
0.2%
Rent to Value Ratio