Houma, LA Investment Properties for Sale
Browse homes for sale and investment properties in Houma, LA. Refine your search by price, property type, or more.
Best cash flowing properties in Houma, LA

Active
$45,000
2
bds
|
2
ba
|
936
sqft
|
built
1965
209 Saint Paul St, Houma, LA 70364
$897
Cash flow
23.2%
Cash-on-Cash Return
23.9%
Cap rate
2.9%
Rent to Value Ratio
Active
$75,000
1
bds
|
2
ba
|
720
sqft
|
built
2022
3644 Grand Caillou Rd, Houma, LA 70363
$542
Cash flow
37.7%
Cash-on-Cash Return
14.4%
Cap rate
1.7%
Rent to Value Ratio
315 out of 342 properties for sale in Houma, LA
Limited Results Shown
Create a free account, or log in to reveal all property listings and enjoy the complete experience.

Active
$164,900
3
bds
|
2
ba
|
1,296
sqft
|
built
2022
353 Dixie Ave, Houma, LA 70363
$117
Cash flow
3.7%
Cash-on-Cash Return
6.5%
Cap rate
0.8%
Rent to Value Ratio
Active
$245,000
3
bds
|
2
ba
|
2,125
sqft
|
built
1968
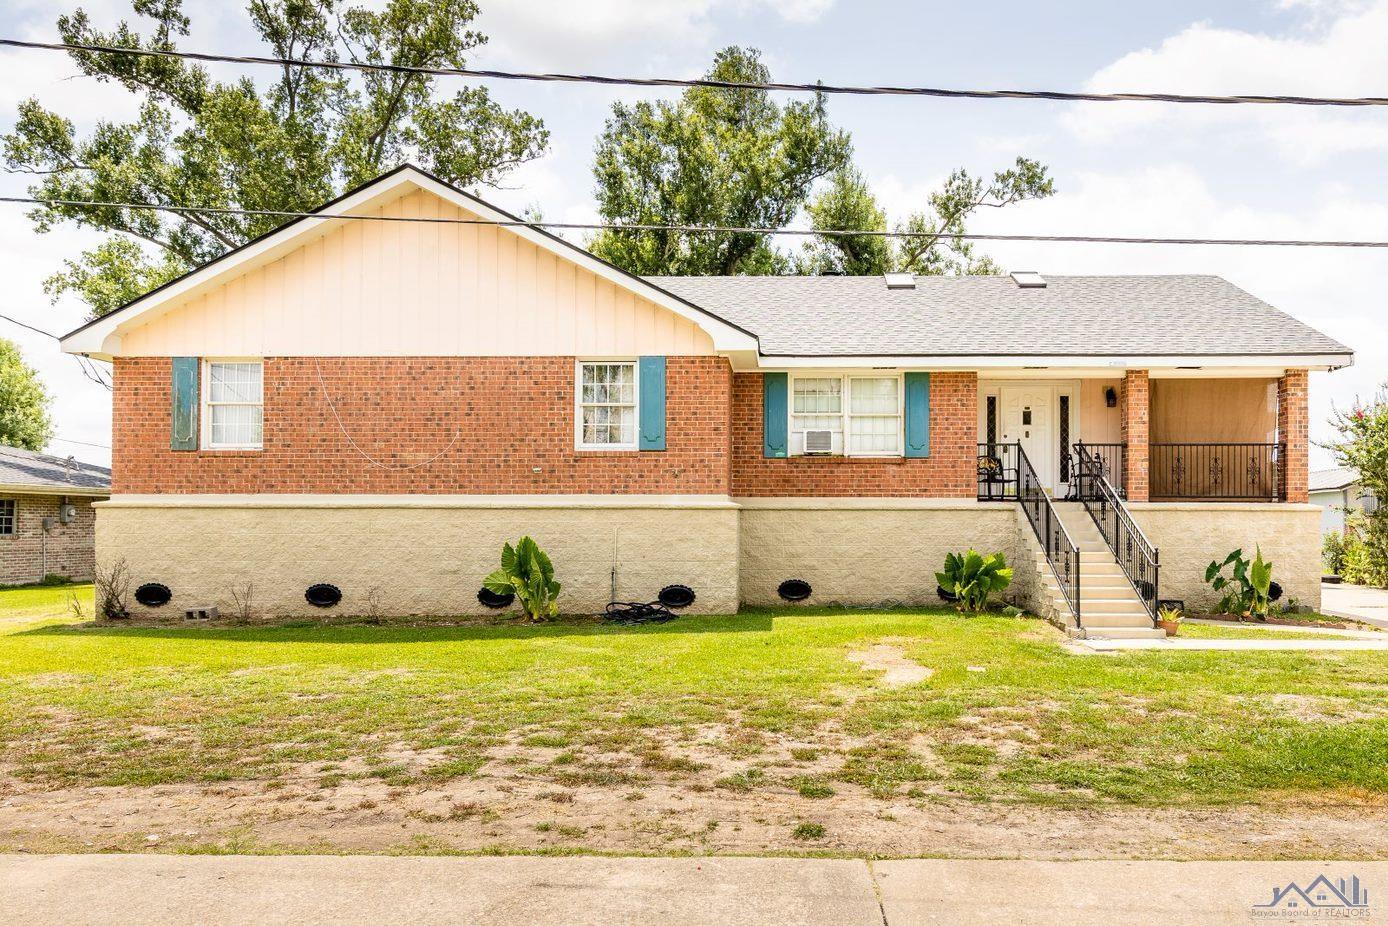
401 Maple Ave, Houma, LA 70364
$-193
Cash flow
-4.1%
Cash-on-Cash Return
4.7%
Cap rate
0.6%
Rent to Value Ratio
Active
$45,000
2
bds
|
2
ba
|
936
sqft
|
built
1965
209 Saint Paul St, Houma, LA 70364
$897
Cash flow
23.2%
Cash-on-Cash Return
23.9%
Cap rate
2.9%
Rent to Value Ratio
Active
$75,000
1
bds
|
2
ba
|
720
sqft
|
built
2022
3644 Grand Caillou Rd, Houma, LA 70363
$542
Cash flow
37.7%
Cash-on-Cash Return
14.4%
Cap rate
1.7%
Rent to Value Ratio

Active
$99,000
2
bds
|
1
ba
|
828
sqft
|
built
1958
172 New Orleans Blvd, Houma, LA 70364
$428
Cash flow
22.6%
Cash-on-Cash Return
10.9%
Cap rate
1.3%
Rent to Value Ratio
Active
$149,000
2
bds
|
1
ba
|
1,823
sqft
|
built
1992
3004 Sycamore Dr, Houma, LA 70363
$261
Cash flow
9.1%
Cash-on-Cash Return
7.8%
Cap rate
0.9%
Rent to Value Ratio
Active
$125,000
2
bds
|
1
ba
|
1,235
sqft
|
built
1981
1403 Honduras St, Houma, LA 70360
$374
Cash flow
15.6%
Cash-on-Cash Return
9.3%
Cap rate
1.1%
Rent to Value Ratio
Active
$325,000
4
bds
|
3
ba
|
3,057
sqft
|
built
1973
9798 E Park Ave, Houma, LA 70363
$-572
Cash flow
-9.2%
Cash-on-Cash Return
3.6%
Cap rate
0.4%
Rent to Value Ratio
Active
$200,000
4
bds
|
2
ba
|
1,937
sqft
|
built
1972
2103 Ruby Dr, Houma, LA 70363
$20
Cash flow
0.5%
Cash-on-Cash Return
5.8%
Cap rate
0.7%
Rent to Value Ratio
Active
$208,000
3
bds
|
2
ba
|
1,830
sqft
|
built
1973
118 Glynn Ave, Houma, LA 70363
$-18
Cash flow
-0.5%
Cash-on-Cash Return
5.6%
Cap rate
0.7%
Rent to Value Ratio
Active
$220,000
3
bds
|
2
ba
|
1,731
sqft
|
built
1963
311 Bellaire Dr, Houma, LA 70360
$-75
Cash flow
-1.8%
Cash-on-Cash Return
5.3%
Cap rate
0.6%
Rent to Value Ratio

Active
$799,000
4
bds
|
3
ba
|
3,883
sqft
|
built
1977
305 Oak Alley Dr, Houma, LA 70360
$-1,849
Cash flow
-12.1%
Cash-on-Cash Return
2.9%
Cap rate
0.4%
Rent to Value Ratio

Active
$214,500
3
bds
|
2
ba
|
2,076
sqft
|
built
1947
202 Maple Ave, Houma, LA 70364
$227
Cash flow
5.5%
Cash-on-Cash Return
6.9%
Cap rate
0.8%
Rent to Value Ratio

Active
$349,900
3
bds
|
2
ba
|
2,057
sqft
|
built
2007
263 Port Royal Way, Houma, LA 70360
$-276
Cash flow
-4.1%
Cash-on-Cash Return
4.7%
Cap rate
0.6%
Rent to Value Ratio
Active
$899,000
6
bds
|
4
ba
|
4,481
sqft
|
built
2006
3328 Southdown Mandalay Rd, Houma, LA 70360
$-2,322
Cash flow
-13.5%
Cash-on-Cash Return
2.6%
Cap rate
0.3%
Rent to Value Ratio

Active
$330,000
3
bds
|
2
ba
|
1,870
sqft
|
built
2005
220 Viola St, Houma, LA 70360
$-182
Cash flow
-2.9%
Cash-on-Cash Return
5.0%
Cap rate
0.6%
Rent to Value Ratio
Active
$300,000
4
bds
|
2
ba
|
2,042
sqft
|
built
1981
213 Aspen Dr, Houma, LA 70360
$-178
Cash flow
-3.1%
Cash-on-Cash Return
5.0%
Cap rate
0.6%
Rent to Value Ratio
Active
$268,900
3
bds
|
3
ba
|
1,902
sqft
|
built
1976
1761 Acadian Dr, Houma, LA 70363
$-238
Cash flow
-4.6%
Cash-on-Cash Return
4.6%
Cap rate
0.6%
Rent to Value Ratio
Active
$169,900
3
bds
|
2
ba
|
1,425
sqft
|
built
2005
117 Tina St, Houma, LA 70363
$162
Cash flow
5.0%
Cash-on-Cash Return
6.8%
Cap rate
0.8%
Rent to Value Ratio
Active
$349,000
4
bds
|
2
ba
|
2,094
sqft
|
built
1990
411 Valhi Blvd, Houma, LA 70360
$-410
Cash flow
-6.1%
Cash-on-Cash Return
4.3%
Cap rate
0.5%
Rent to Value Ratio
Active
$200,000
3
bds
|
2
ba
|
2,374
sqft
|
built
1985
13 Rocky Rd, Houma, LA 70363
$89
Cash flow
2.3%
Cash-on-Cash Return
6.2%
Cap rate
0.8%
Rent to Value Ratio
Active
$369,000
4
bds
|
2
ba
|
2,238
sqft
|
built
2010
391 Port Royal Way, Houma, LA 70360
$-366
Cash flow
-5.2%
Cash-on-Cash Return
4.5%
Cap rate
0.5%
Rent to Value Ratio

Active
$425,000
3
bds
|
3
ba
|
1,807
sqft
|
built
1999
103 Thetford Dr, Houma, LA 70360
$-631
Cash flow
-7.7%
Cash-on-Cash Return
3.9%
Cap rate
0.5%
Rent to Value Ratio
Active
$220,000
3
bds
|
3
ba
|
1,454
sqft
|
built
1960
303 Hialeah Ave, Houma, LA 70363
$-144
Cash flow
-3.4%
Cash-on-Cash Return
4.9%
Cap rate
0.6%
Rent to Value Ratio
Active
$749,028
3
bds
|
4
ba
|
2,892
sqft
|
built
2015
309 Rue St Rachel, Houma, LA 70360
$-1,061
Cash flow
-7.4%
Cash-on-Cash Return
4.0%
Cap rate
0.5%
Rent to Value Ratio
Active
$349,900
3
bds
|
3
ba
|
1,953
sqft
|
built
2013
219 Mandalay East Dr, Houma, LA 70360
$-345
Cash flow
-5.1%
Cash-on-Cash Return
4.5%
Cap rate
0.5%
Rent to Value Ratio
Active
$987,000
4
bds
|
4
ba
|
3,222
sqft
|
built
2014
187 Regal Row, Houma, LA 70360
$-1,290
Cash flow
-6.8%
Cash-on-Cash Return
4.1%
Cap rate
0.5%
Rent to Value Ratio
Active
$750,000
6
bds
|
7
ba
|
7,212
sqft
|
built
1987
317 Bayou Blue Rd, Houma, LA 70364
$-2,031
Cash flow
-14.1%
Cash-on-Cash Return
2.4%
Cap rate
0.3%
Rent to Value Ratio
Active
$250,000
3
bds
|
2
ba
|
1,410
sqft
|
built
1971
110 Crestwood Dr, Houma, LA 70364
$-217
Cash flow
-4.5%
Cash-on-Cash Return
4.6%
Cap rate
0.6%
Rent to Value Ratio
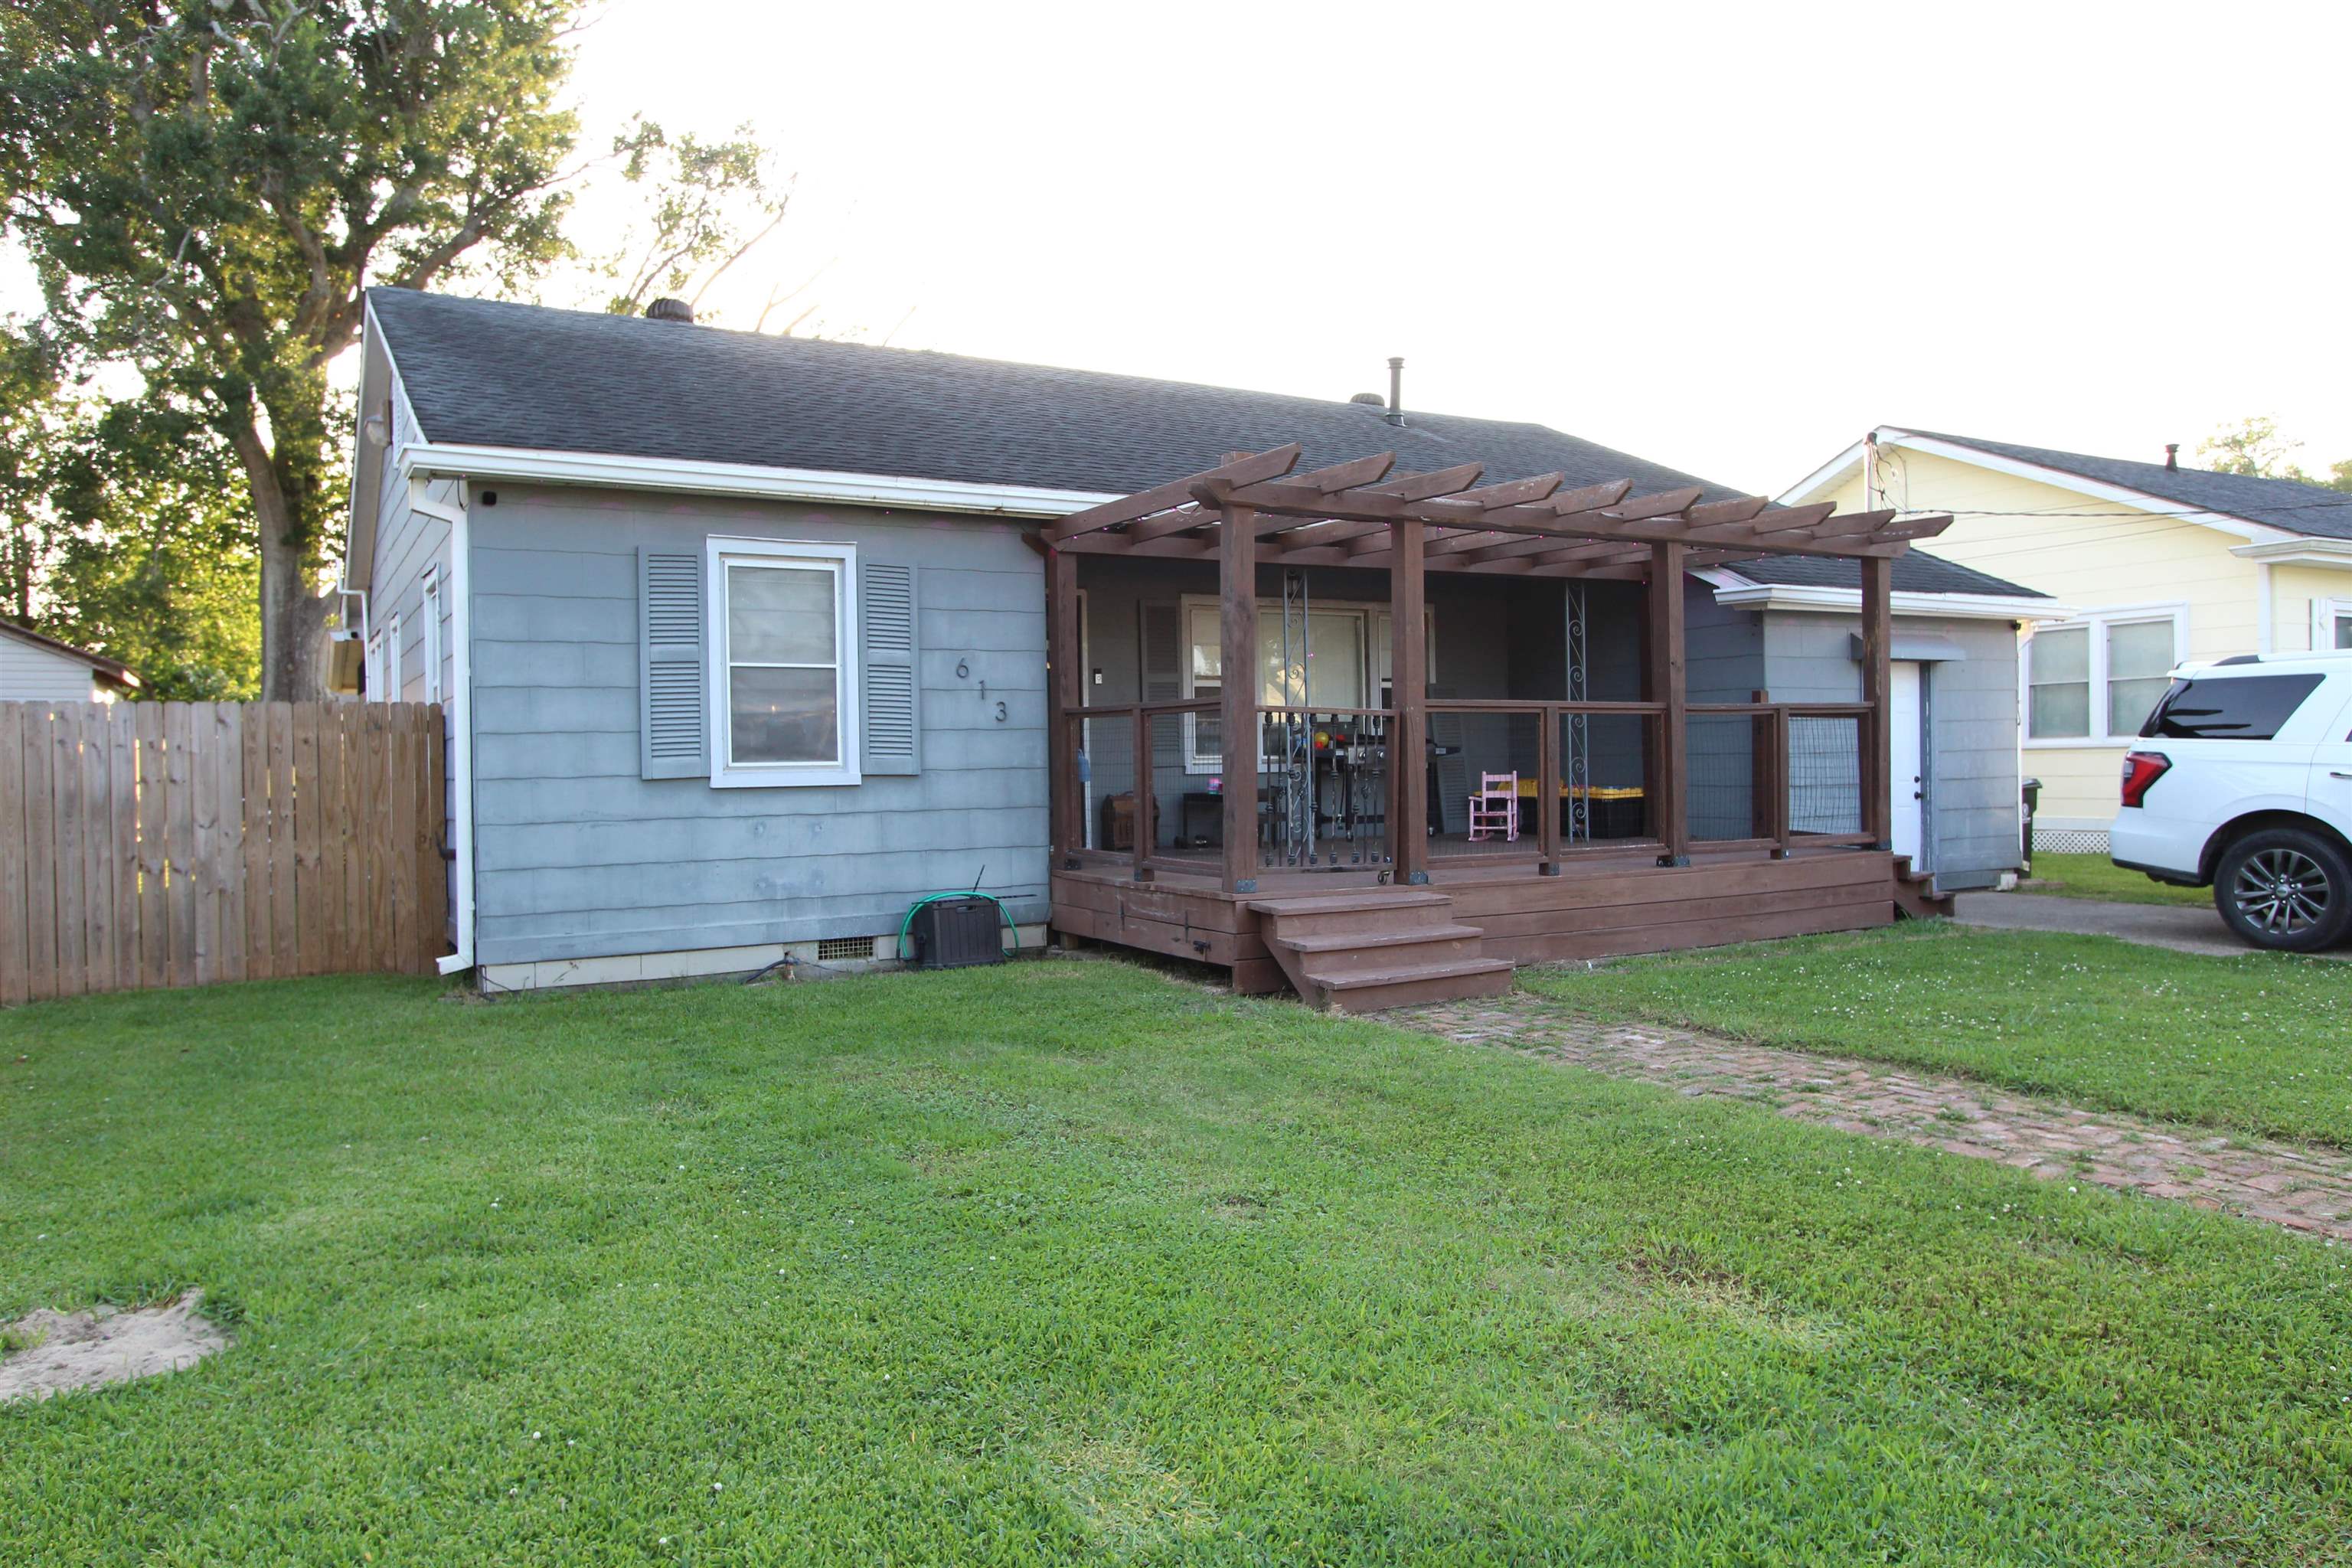
Active
$180,000
4
bds
|
2
ba
|
1,690
sqft
|
built
1965
613 Duval Ave, Houma, LA 70364
$114
Cash flow
3.3%
Cash-on-Cash Return
6.4%
Cap rate
0.8%
Rent to Value Ratio
Active
$239,900
4
bds
|
2
ba
|
1,888
sqft
|
built
1975
107 Piping Rock Dr, Houma, LA 70363
$-169
Cash flow
-3.7%
Cash-on-Cash Return
4.8%
Cap rate
0.6%
Rent to Value Ratio
Pending
$185,000
3
bds
|
2
ba
|
1,296
sqft
|
built
2005
369 Daralyn Dr, Houma, LA 70363
$91
Cash flow
2.6%
Cash-on-Cash Return
6.3%
Cap rate
0.8%
Rent to Value Ratio

Active
$152,900
3
bds
|
1
ba
|
1,070
sqft
|
built
1972
69 Kirkglen Loop, Houma, LA 70363
$242
Cash flow
8.3%
Cash-on-Cash Return
7.6%
Cap rate
0.9%
Rent to Value Ratio
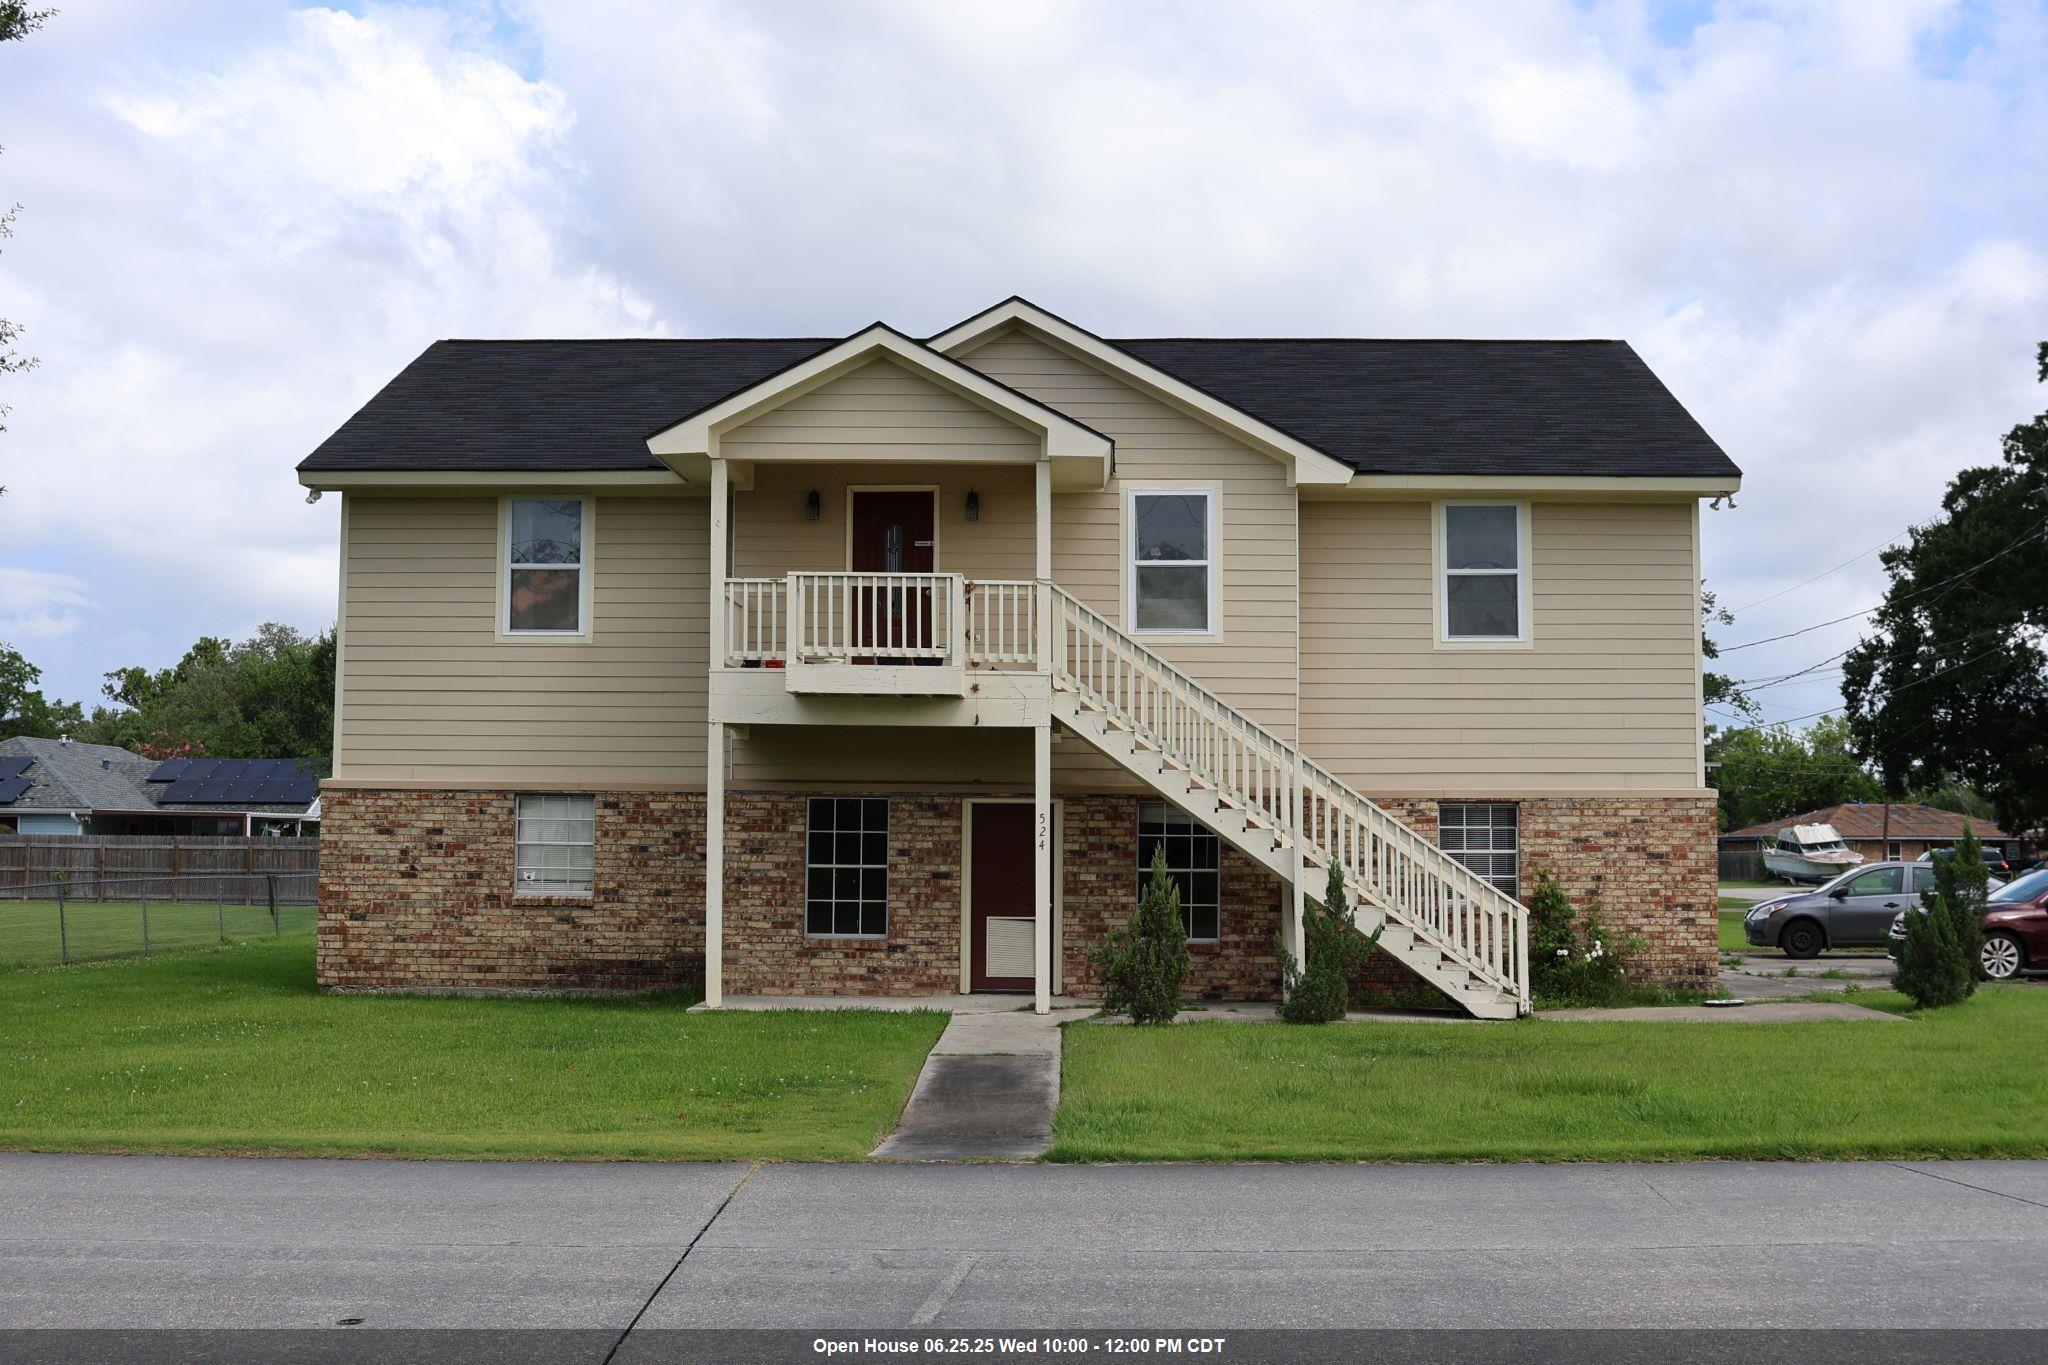
Active
$200,000
3
bds
|
2
ba
|
1,596
sqft
|
built
1970
524 Oakwood Dr, Houma, LA 70363
$20
Cash flow
0.5%
Cash-on-Cash Return
5.8%
Cap rate
0.7%
Rent to Value Ratio
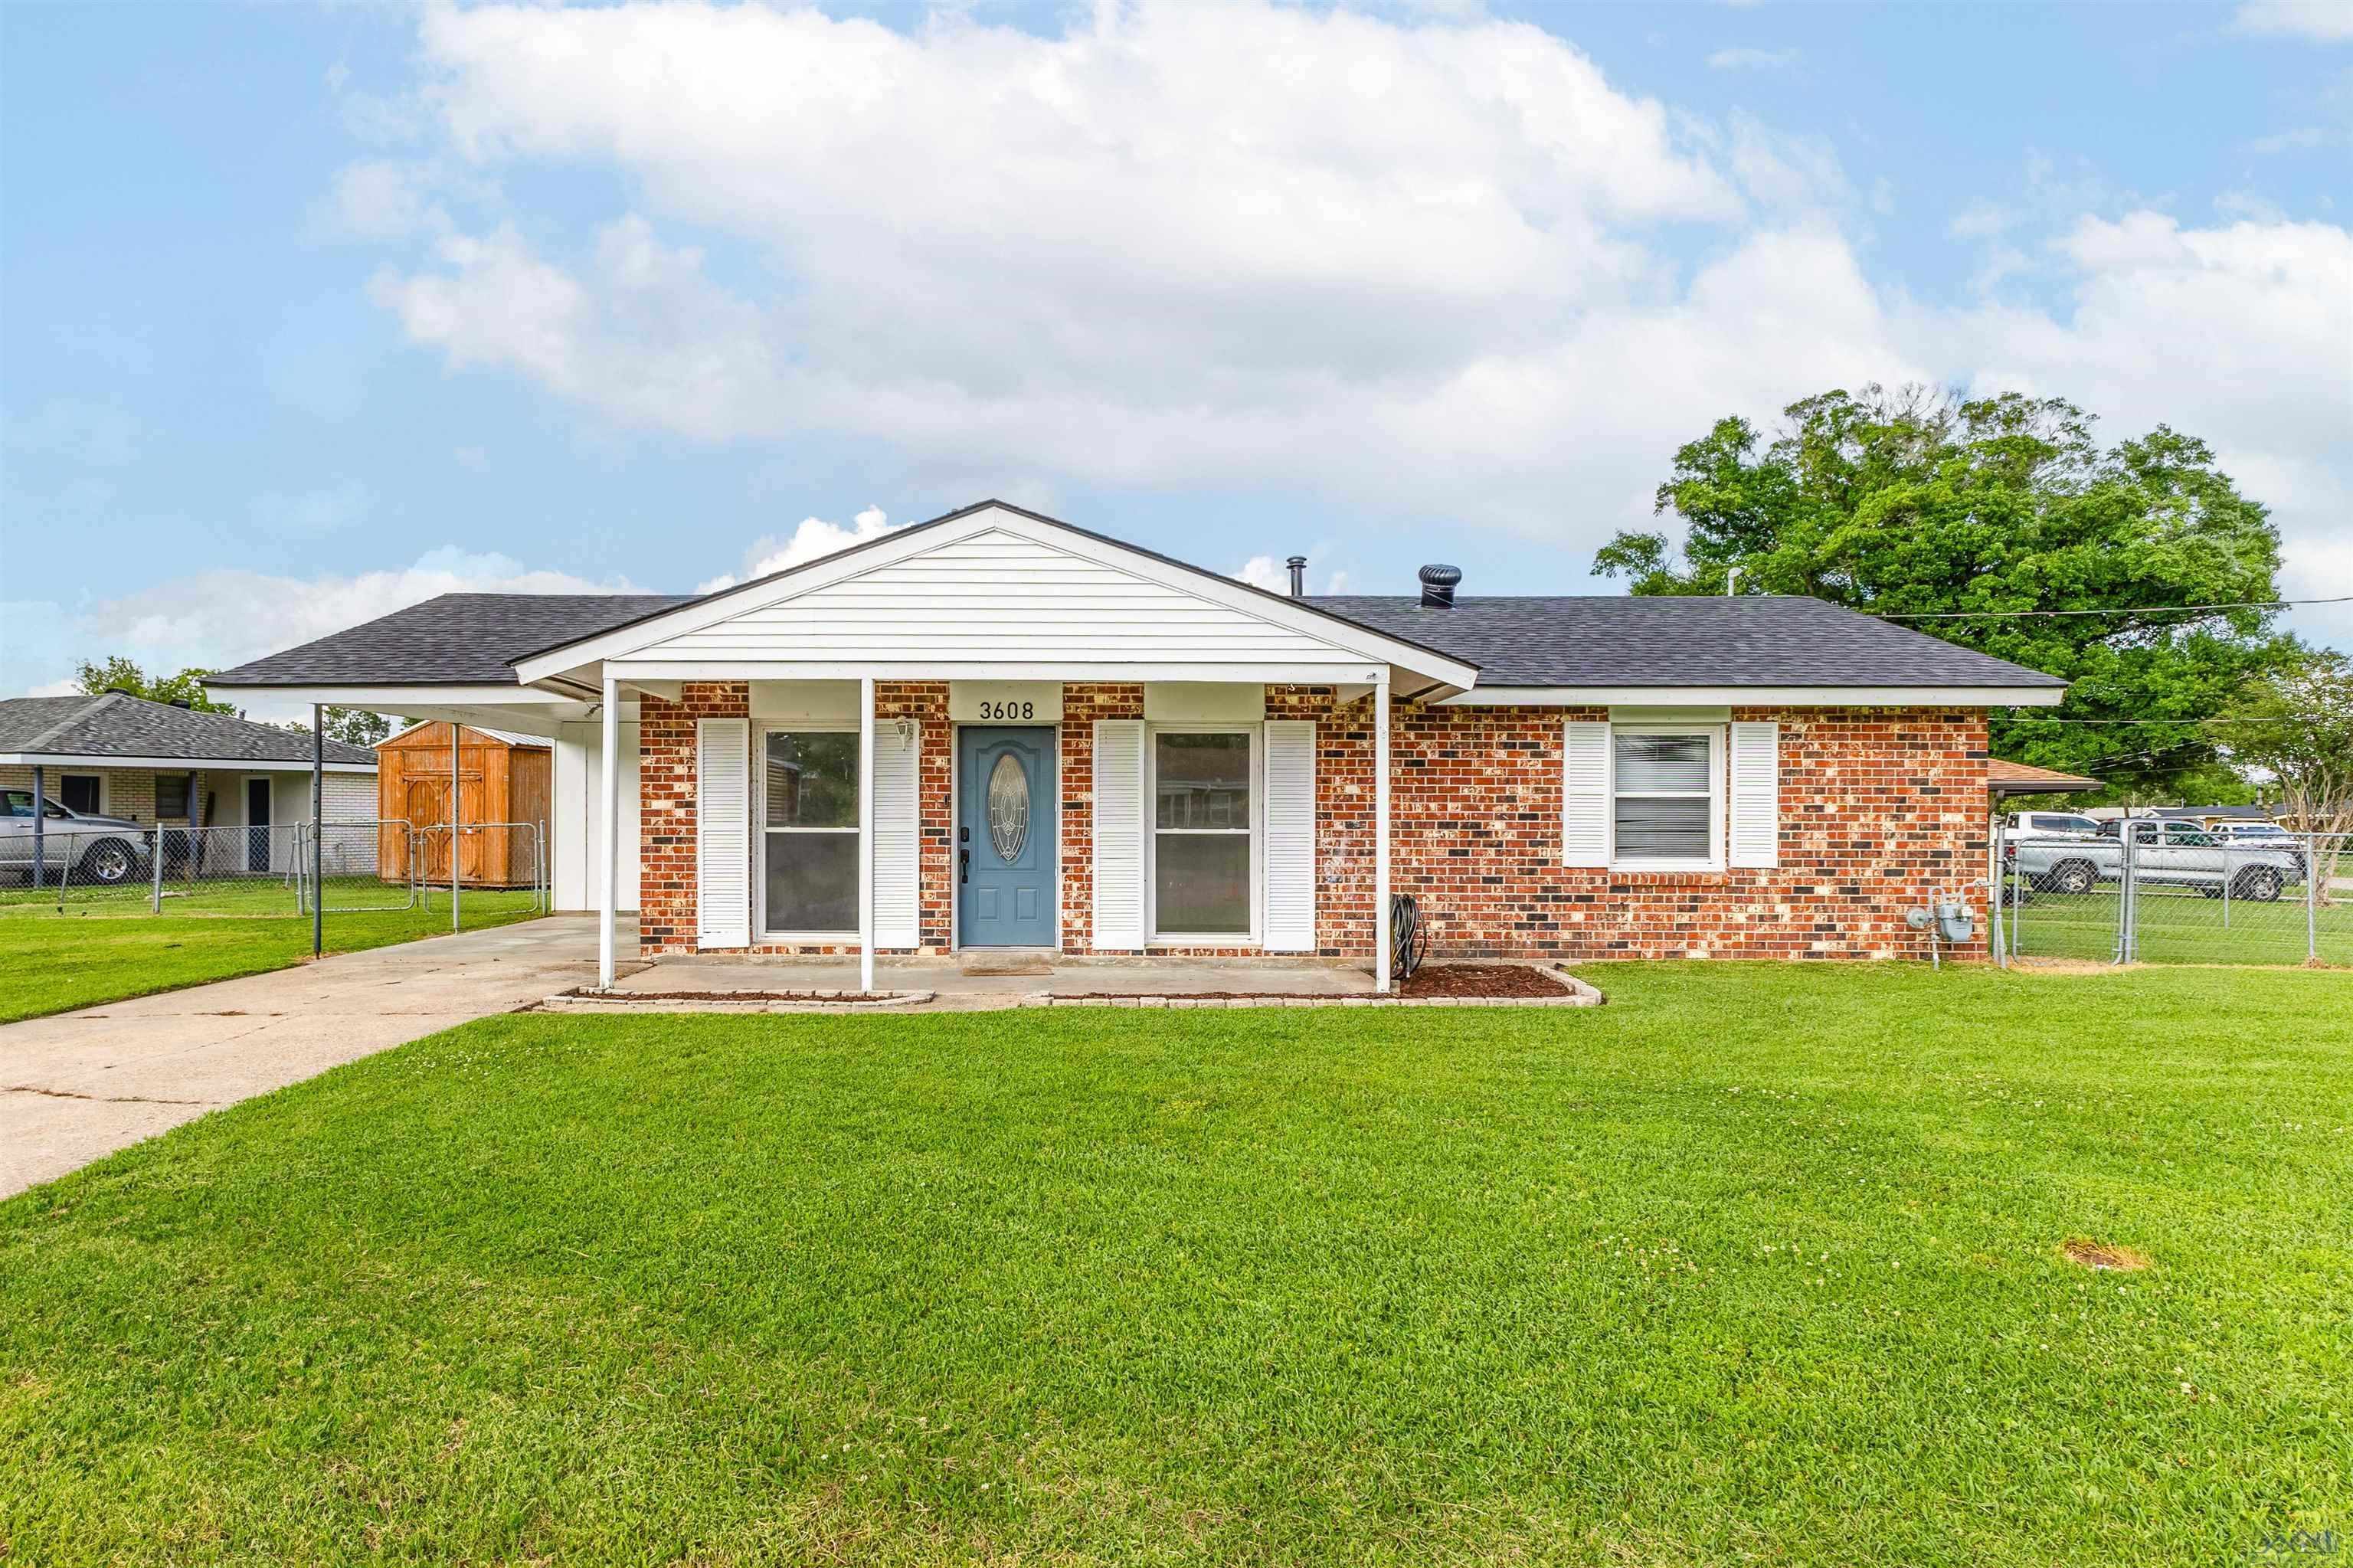
Active
$168,000
3
bds
|
2
ba
|
975
sqft
|
built
1982
3608 Euclid St, Houma, LA 70364
$171
Cash flow
5.3%
Cash-on-Cash Return
6.9%
Cap rate
0.8%
Rent to Value Ratio
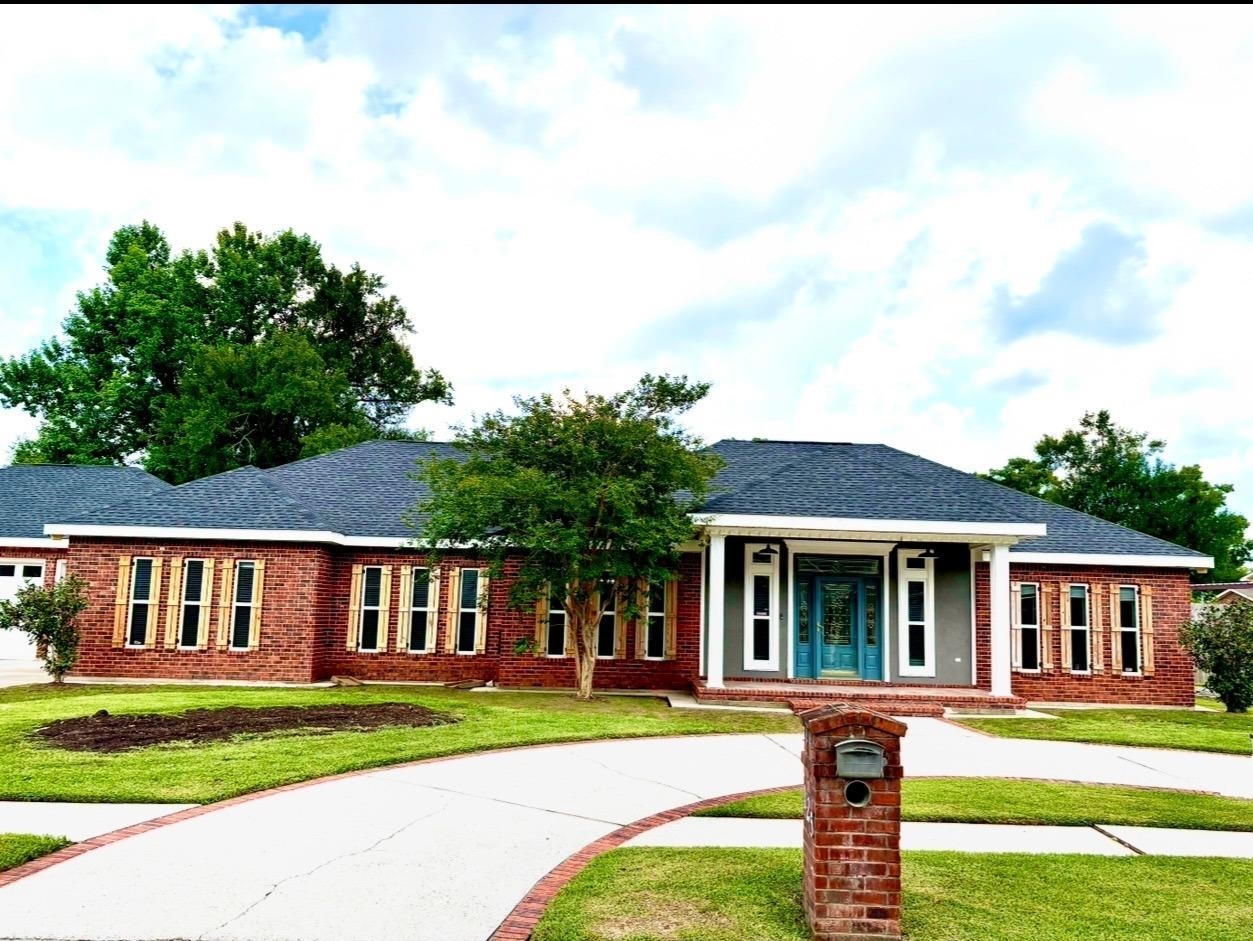
Active
$365,000
3
bds
|
3
ba
|
2,876
sqft
|
built
1997
125 Tutty Loop, Houma, LA 70363
$-488
Cash flow
-7.0%
Cash-on-Cash Return
4.1%
Cap rate
0.5%
Rent to Value Ratio
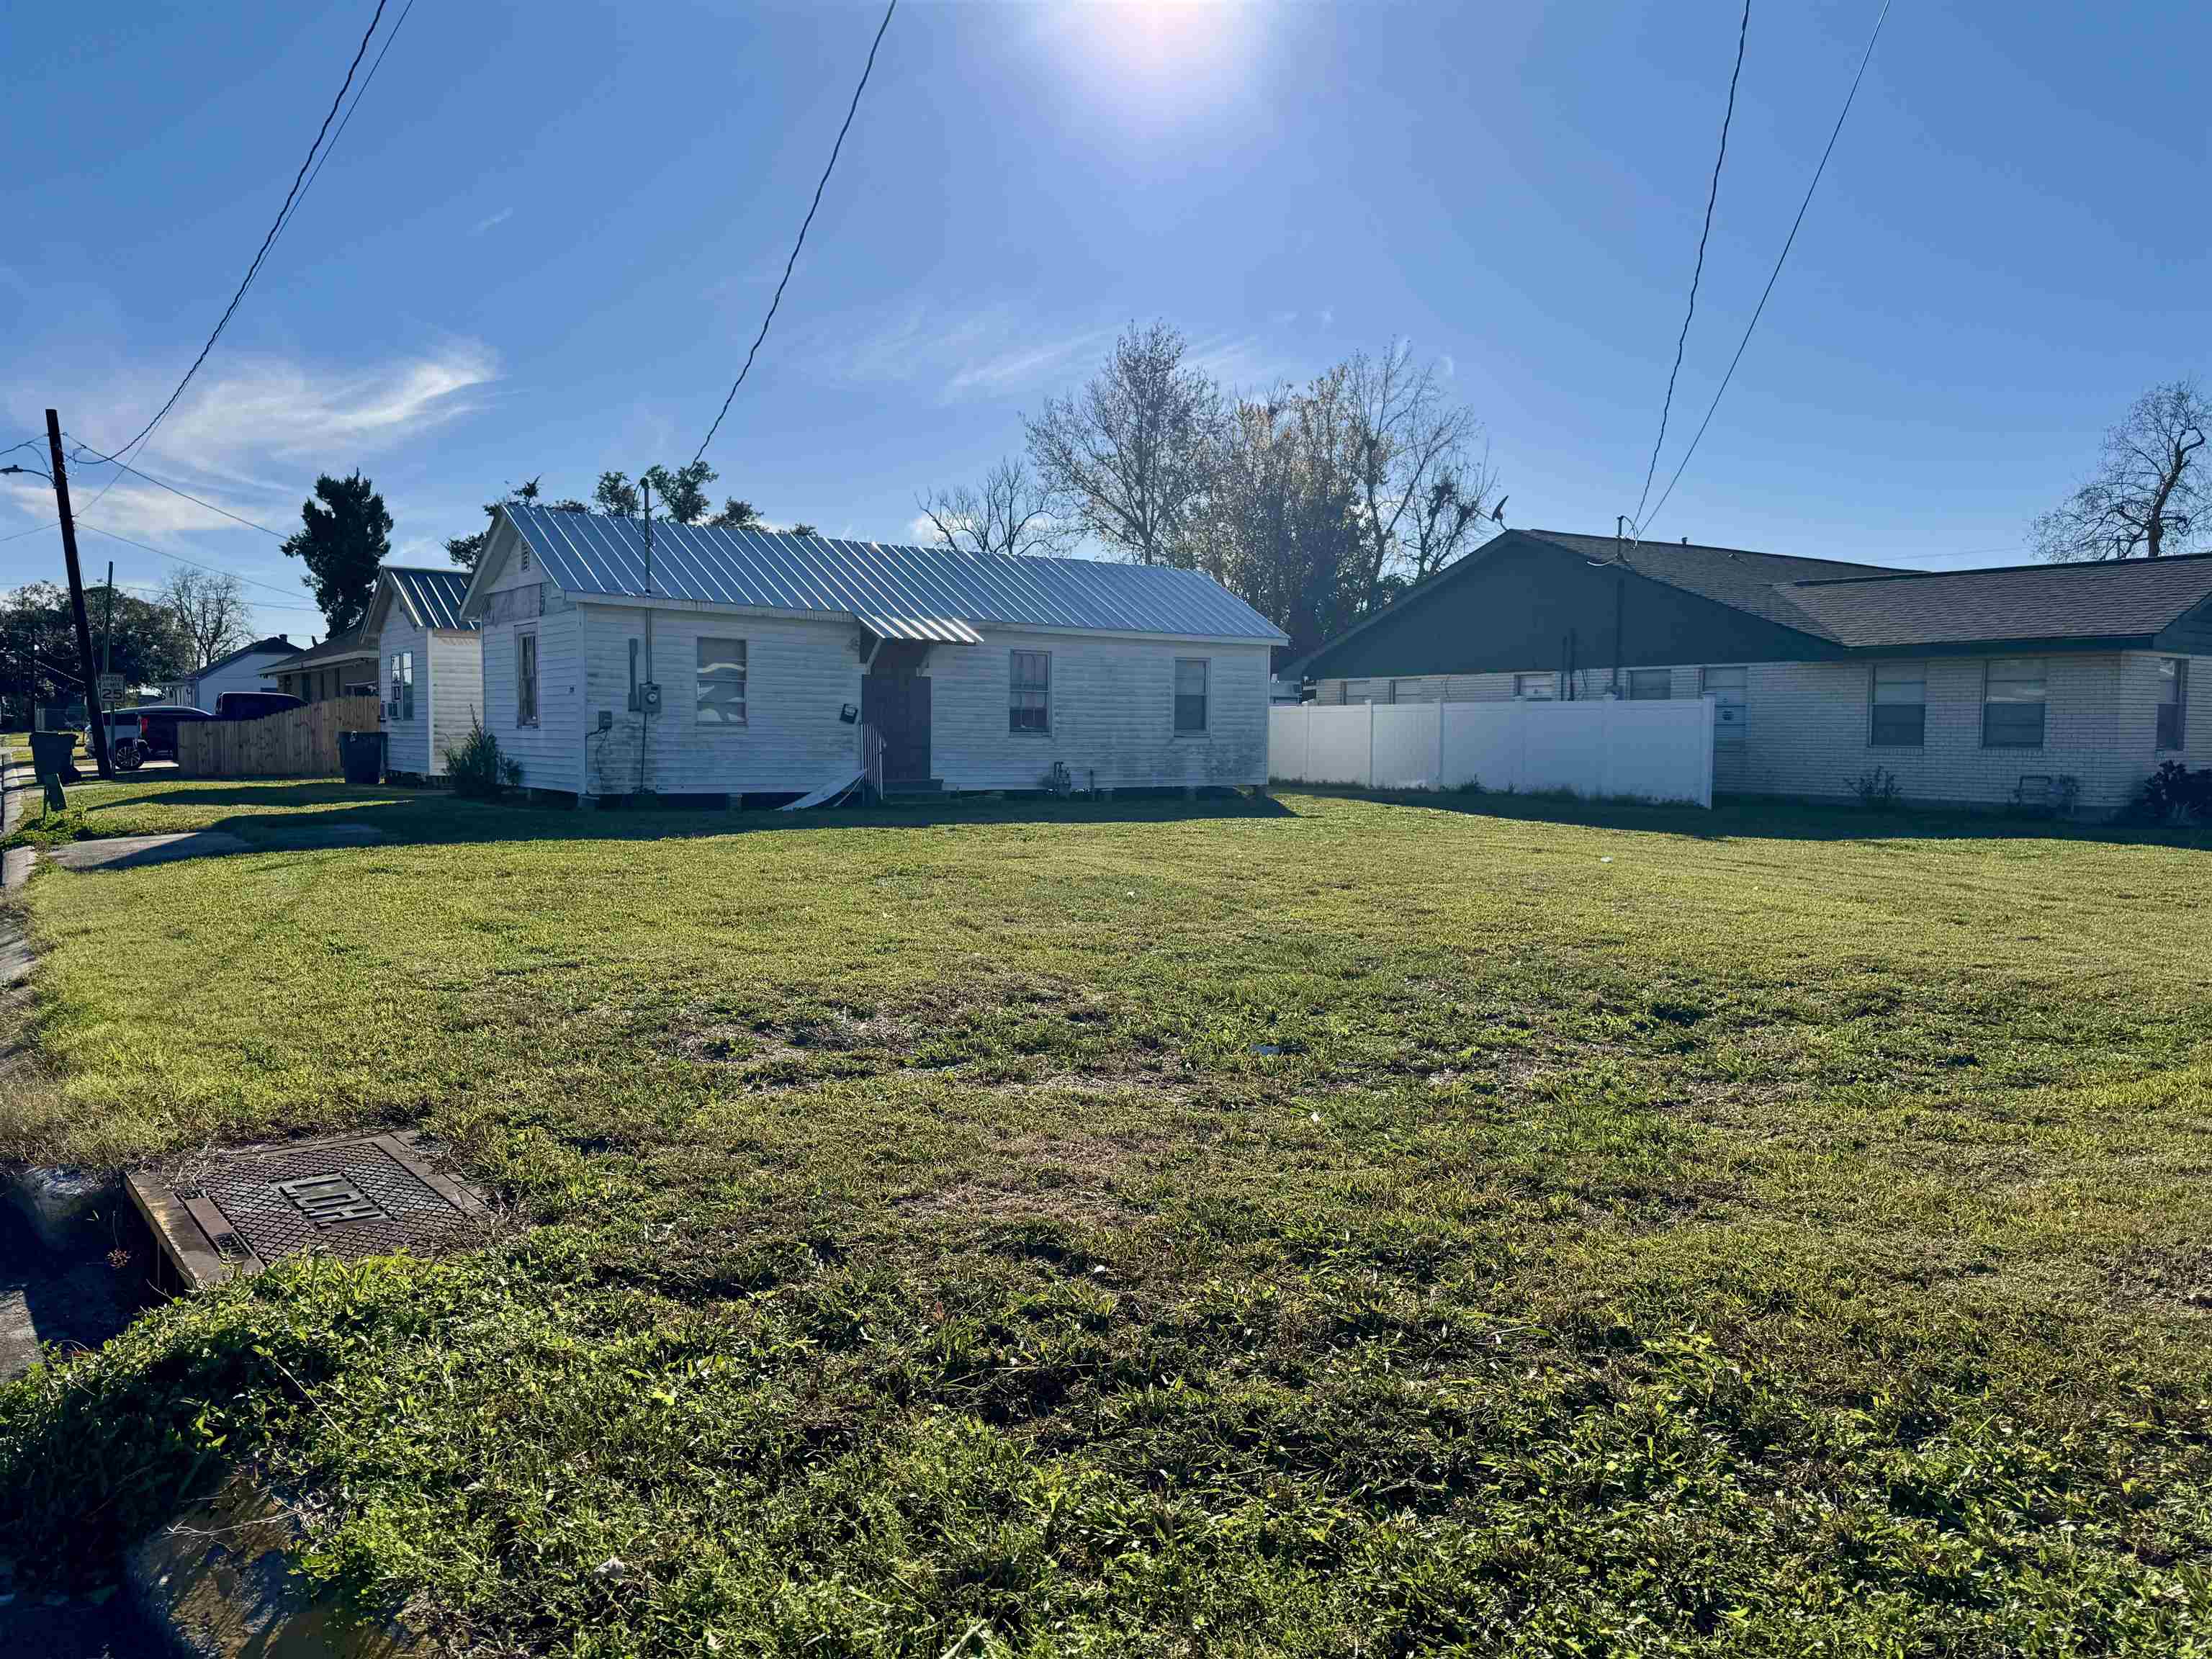
Active
$90,000
bds
|
0
ba
|
1,368
sqft
|
built
1210 Bourg St, Houma, LA 70360
$471
Cash flow
27.3%
Cash-on-Cash Return
12.0%
Cap rate
1.4%
Rent to Value Ratio
Active
$145,000
4
bds
|
2
ba
|
2,403
sqft
|
built
1978
519 Woodside Dr, Houma, LA 70363
$280
Cash flow
10.1%
Cash-on-Cash Return
8.0%
Cap rate
1.0%
Rent to Value Ratio
Active
$155,000
4
bds
|
2
ba
|
1,241
sqft
|
built
1960
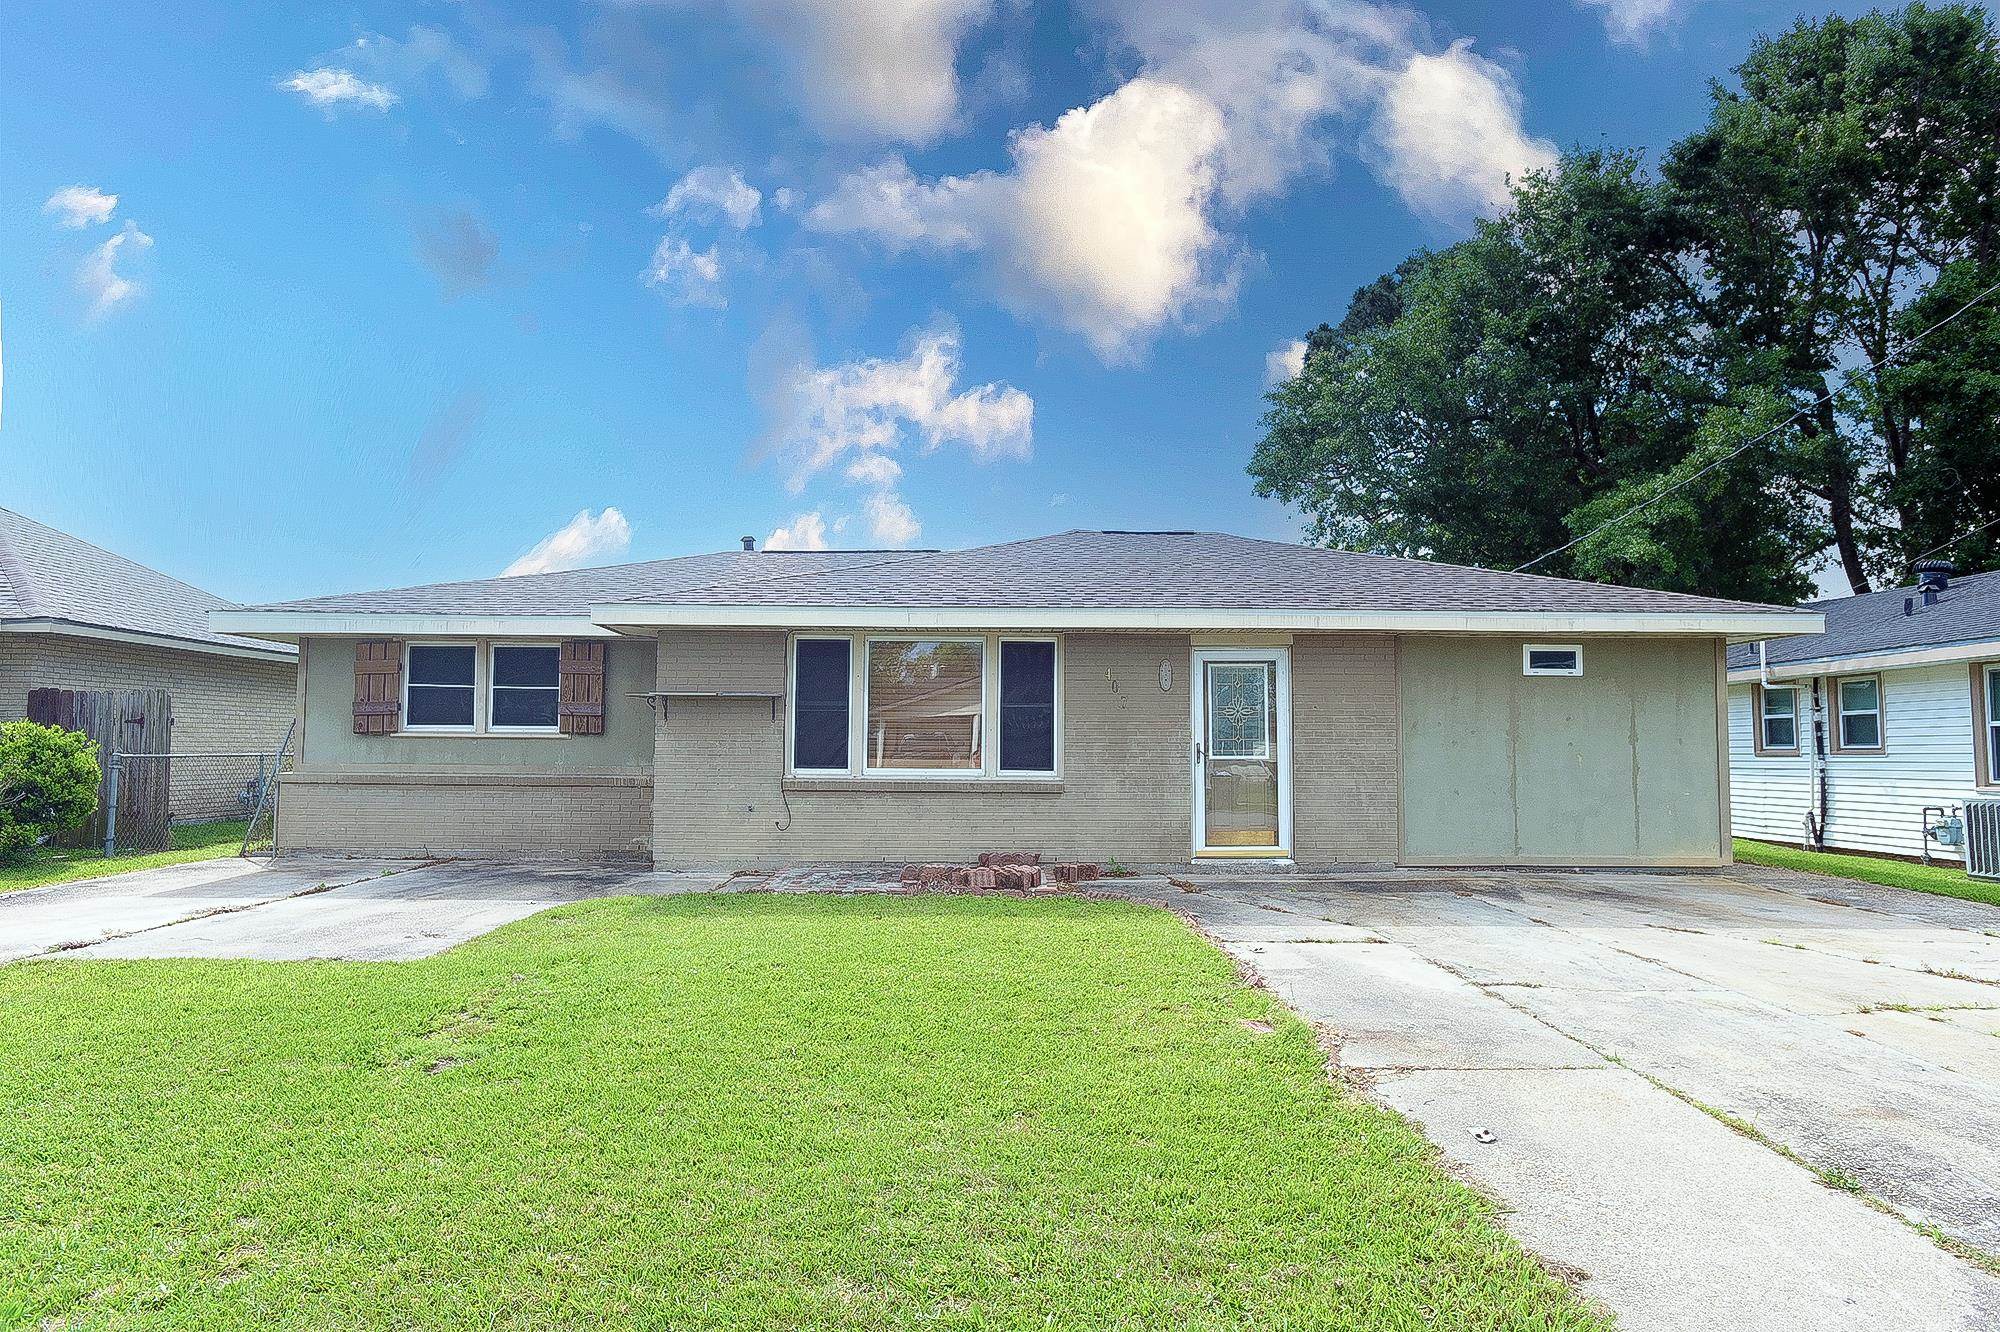
407 Dauphine Ave, Houma, LA 70363
$232
Cash flow
7.8%
Cash-on-Cash Return
7.5%
Cap rate
0.9%
Rent to Value Ratio
Active
$155,000
3
bds
|
2
ba
|
1,424
sqft
|
built
1986
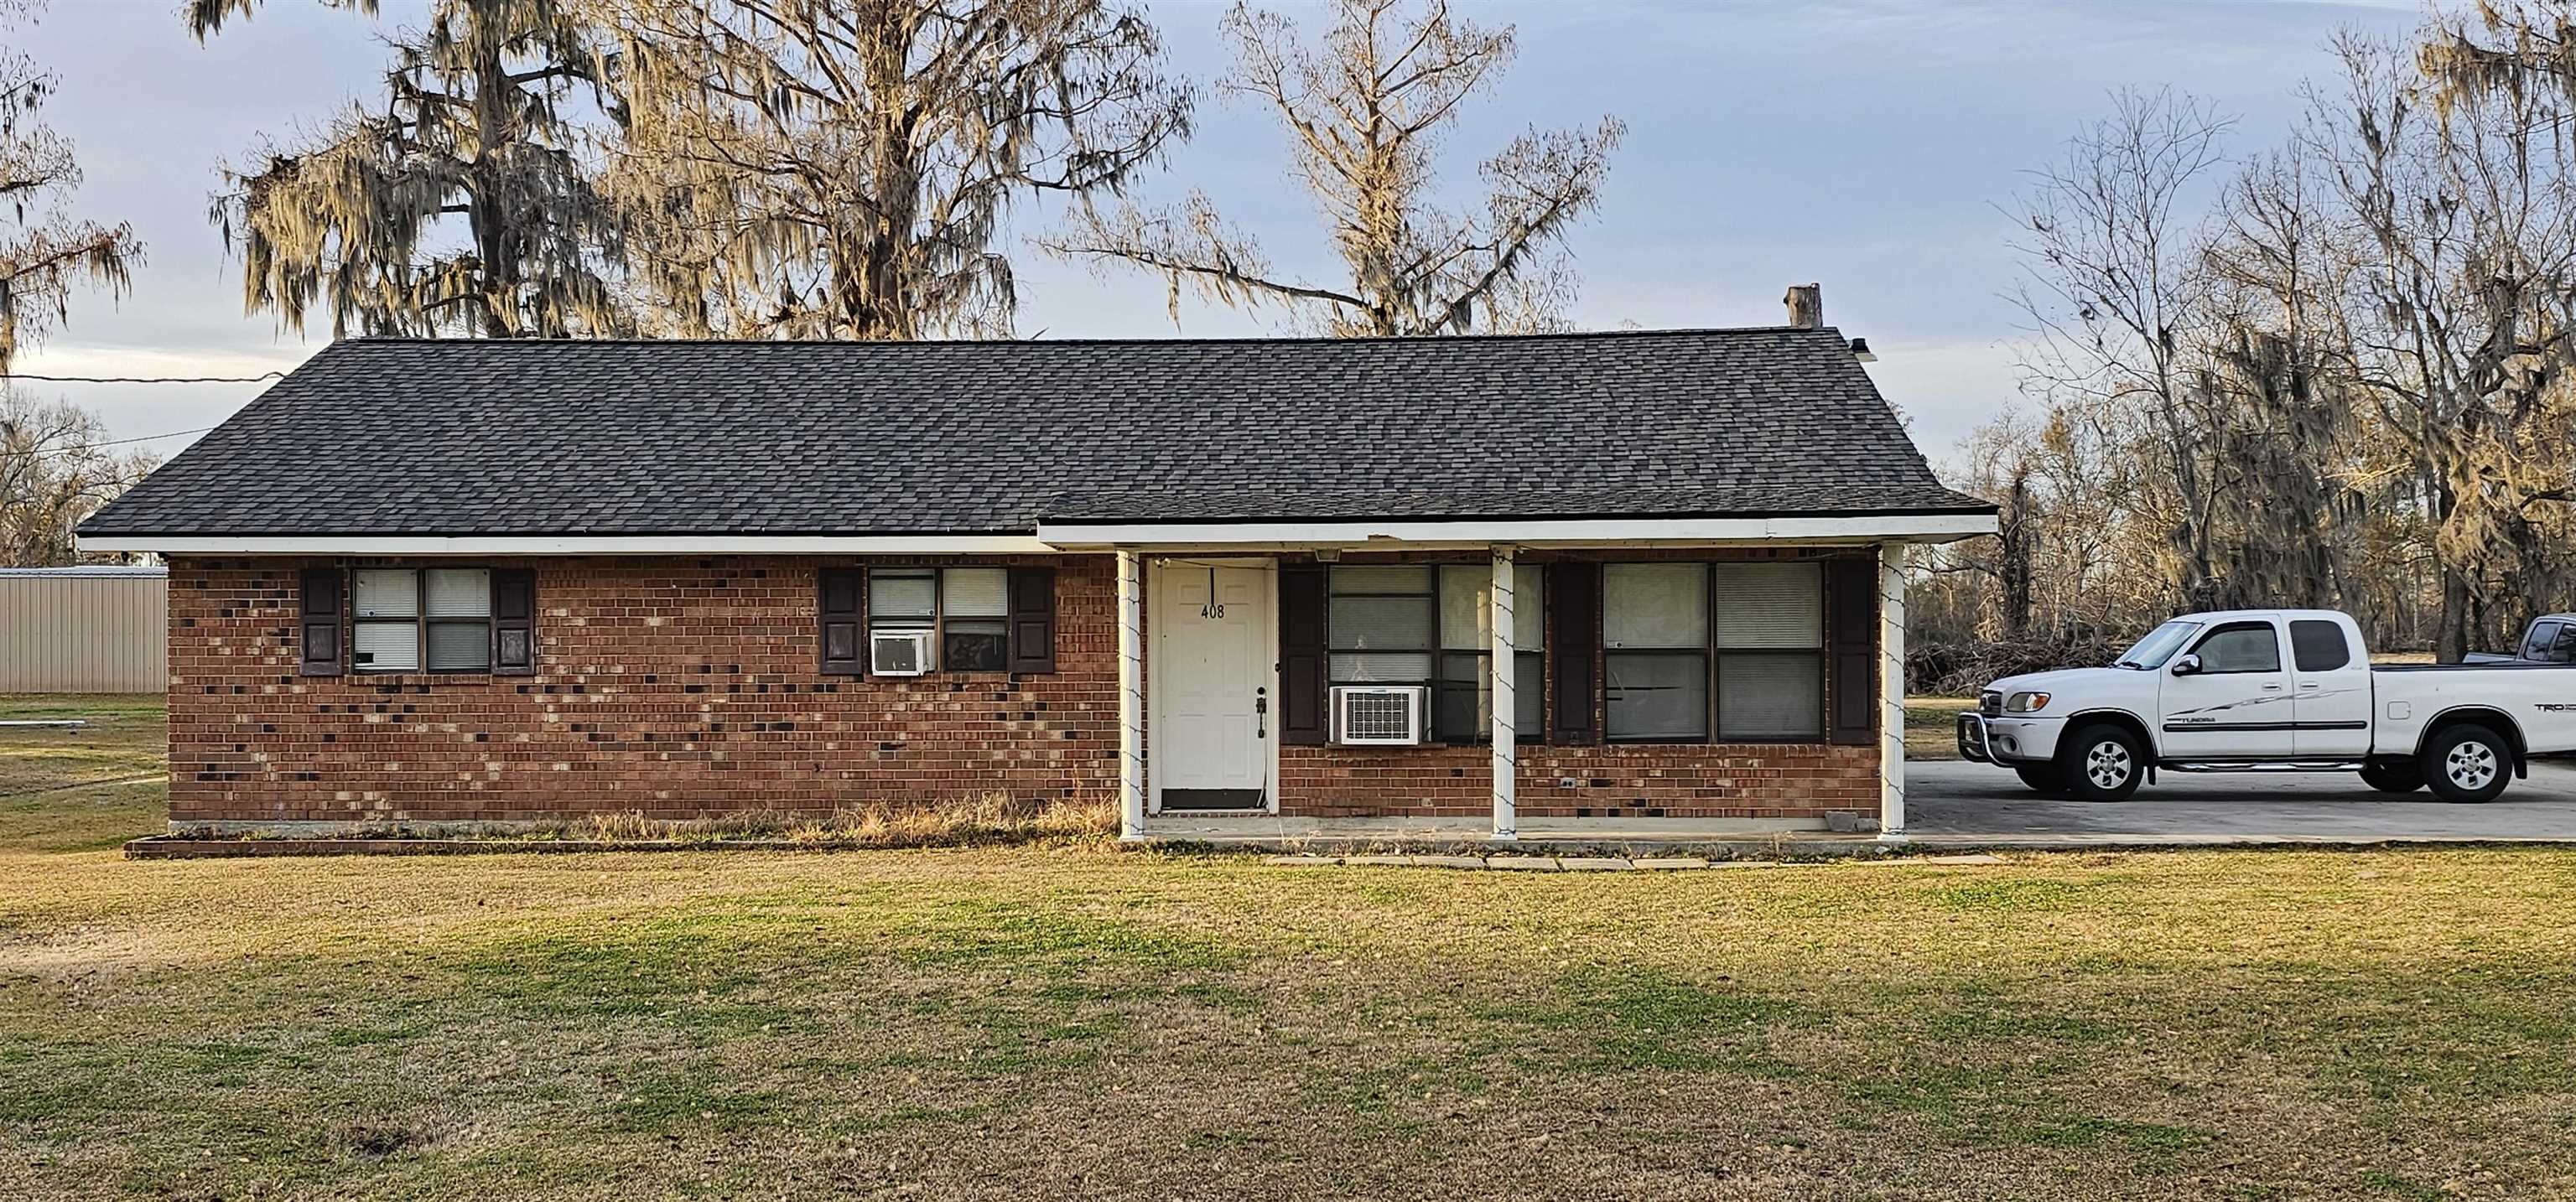
408 Bayou Gardens Dr, Houma, LA 70364
$232
Cash flow
7.8%
Cash-on-Cash Return
7.5%
Cap rate
0.9%
Rent to Value Ratio