Houma, LA Investment Properties for Sale
Browse homes for sale and investment properties in Houma, LA. Refine your search by price, property type, or more.
Best cash flowing properties in Houma, LA
Active
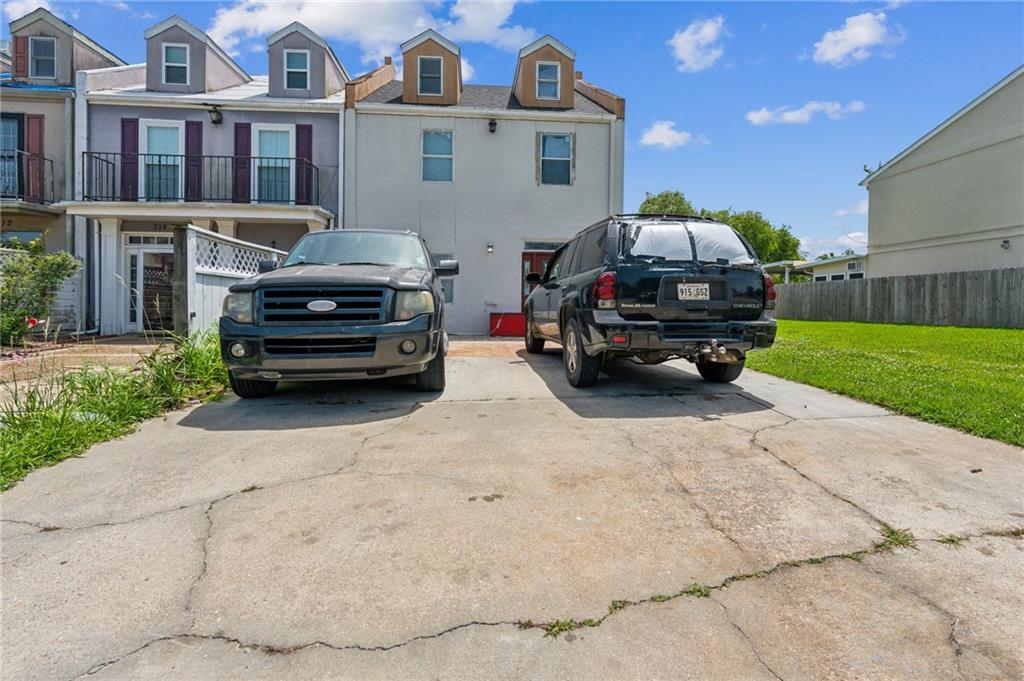
$10,000
3
bds
|
3
ba
|
1,512
sqft
|
built
1990
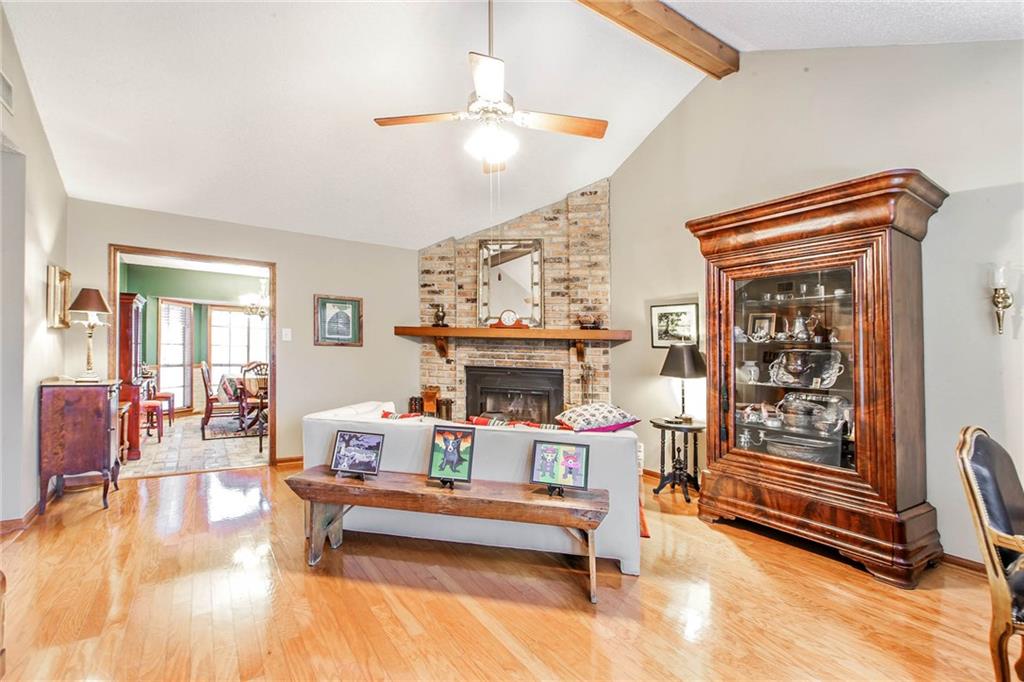
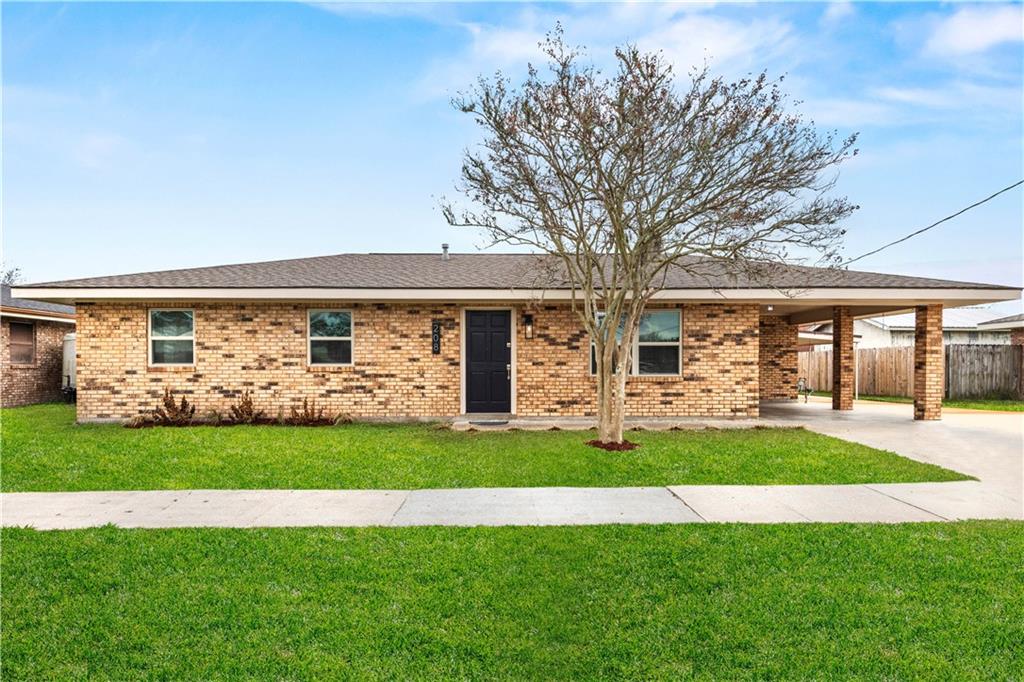
216 Rue D Iberville, Houma, LA 70360
$966
Cash flow
112.5%
Cash-on-Cash Return
115.9%
Cap rate
14.0%
Rent to Value Ratio
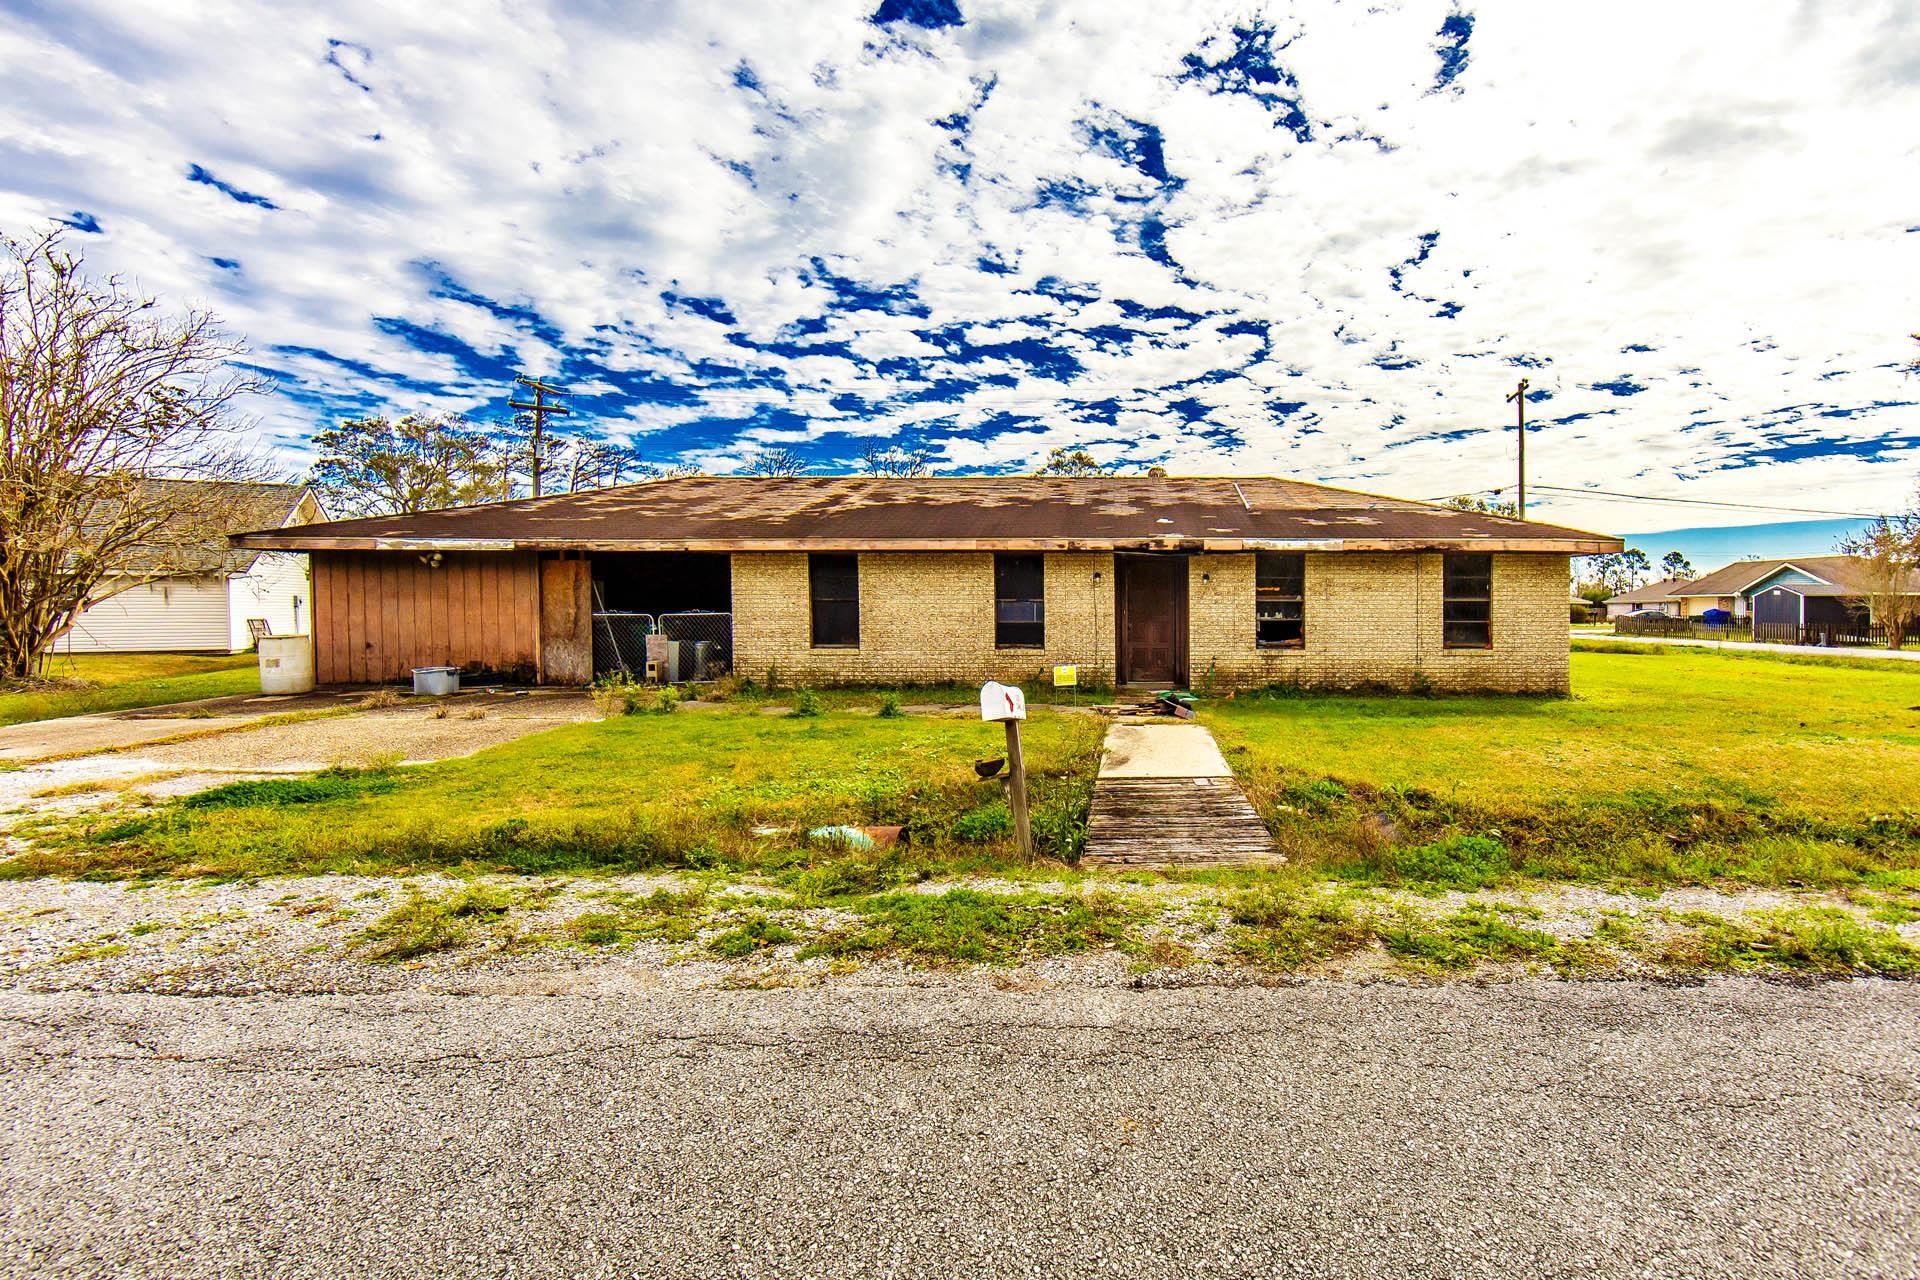
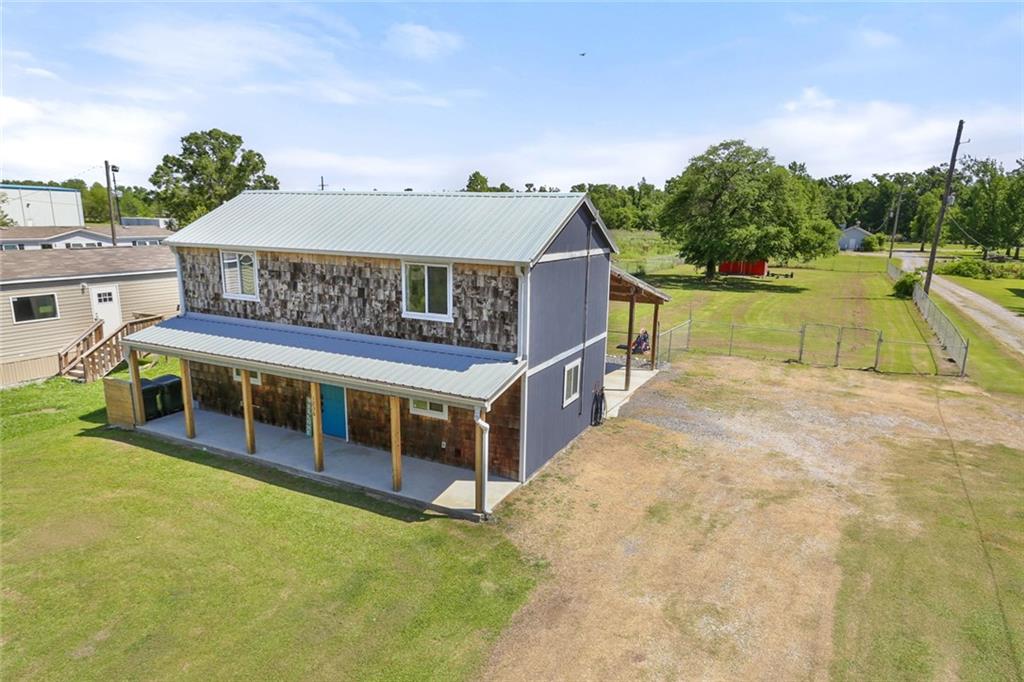
Active
$84,000
3
bds
|
1
ba
|
1,932
sqft
|
built
1979
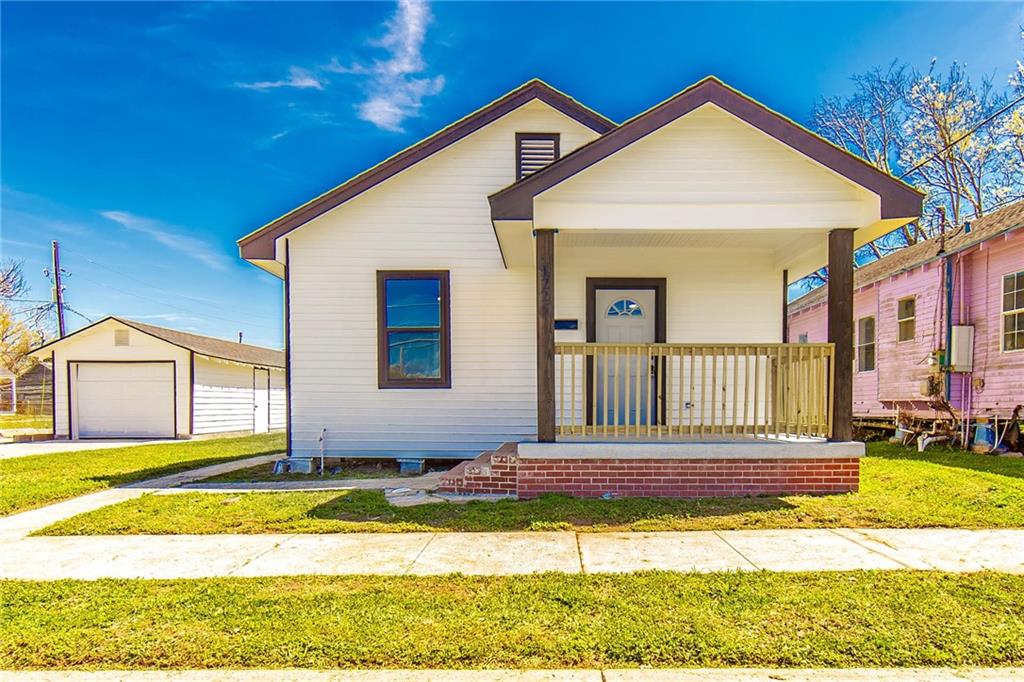
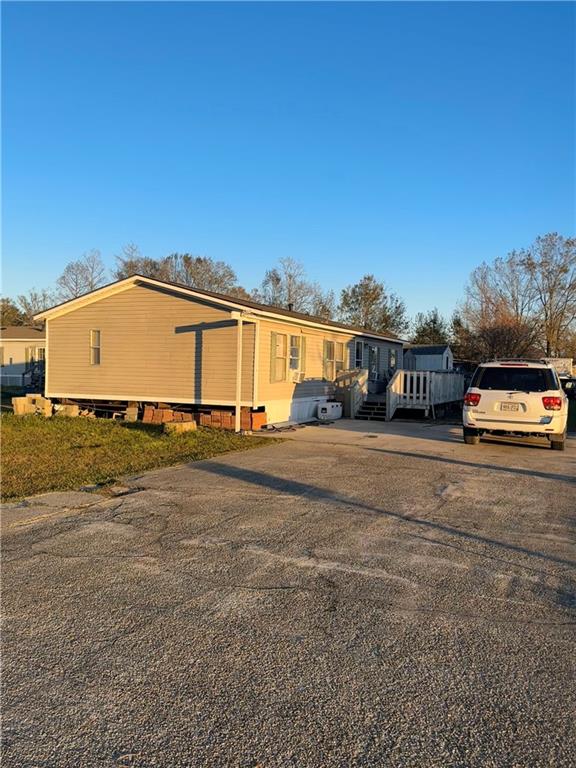
300 Canal Ln, Houma, LA 70364
$706
Cash flow
43.9%
Cash-on-Cash Return
15.8%
Cap rate
1.9%
Rent to Value Ratio
316 out of 343 properties for sale in Houma, LA
Limited Results Shown
Create a free account, or log in to reveal all property listings and enjoy the complete experience.
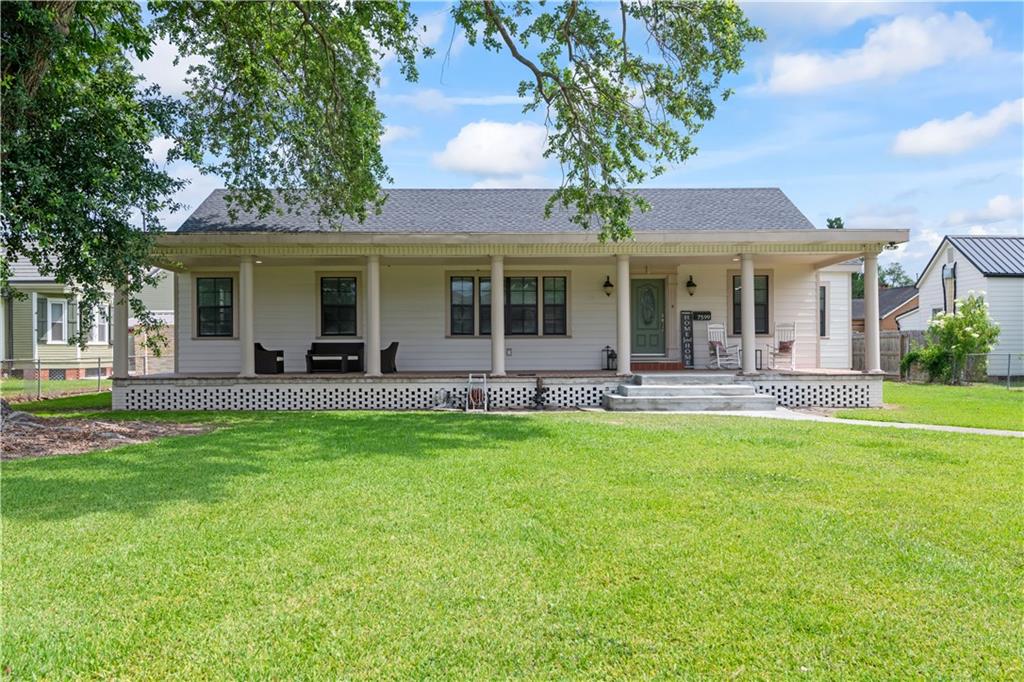
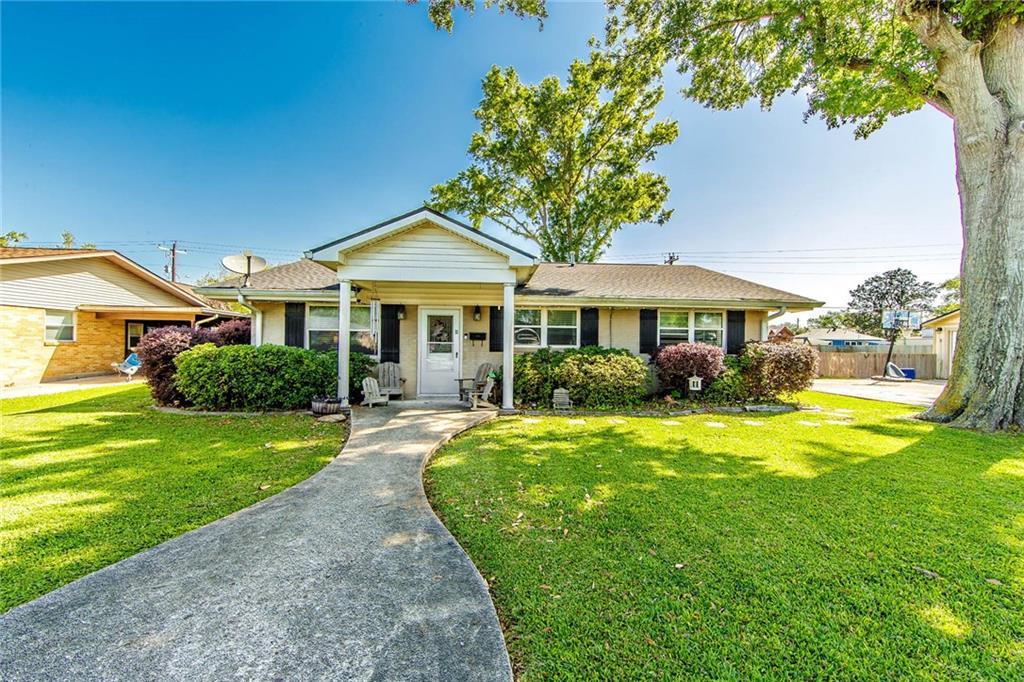
Active
$439,900
4
bds
|
3
ba
|
3,321
sqft
|
built
1952
7599 Park Ave, Houma, LA 70364
$-1,116
Cash flow
-13.2%
Cash-on-Cash Return
2.6%
Cap rate
0.3%
Rent to Value Ratio
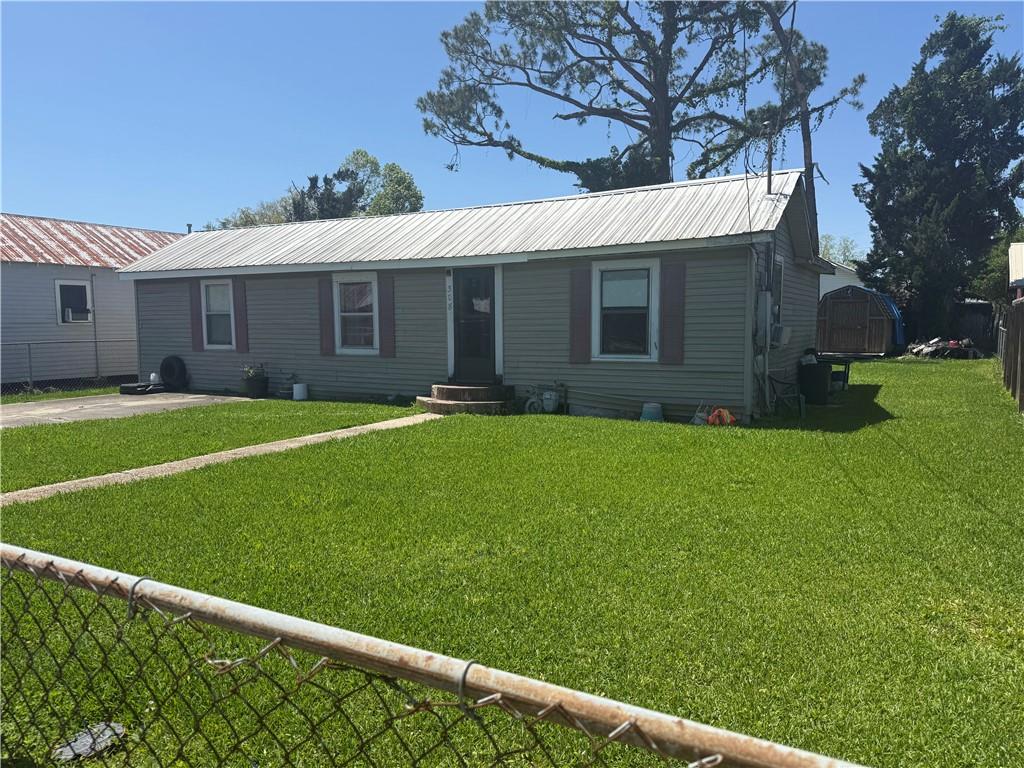
Active
$10,000
3
bds
|
3
ba
|
1,512
sqft
|
built
1990
216 Rue D Iberville, Houma, LA 70360
$966
Cash flow
112.5%
Cash-on-Cash Return
115.9%
Cap rate
14.0%
Rent to Value Ratio
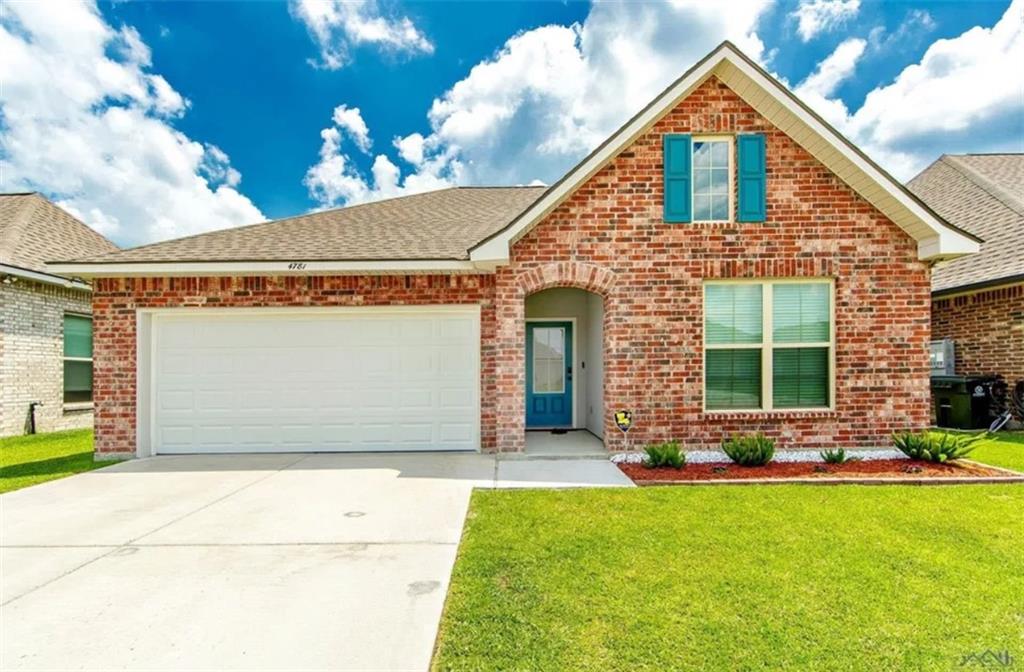
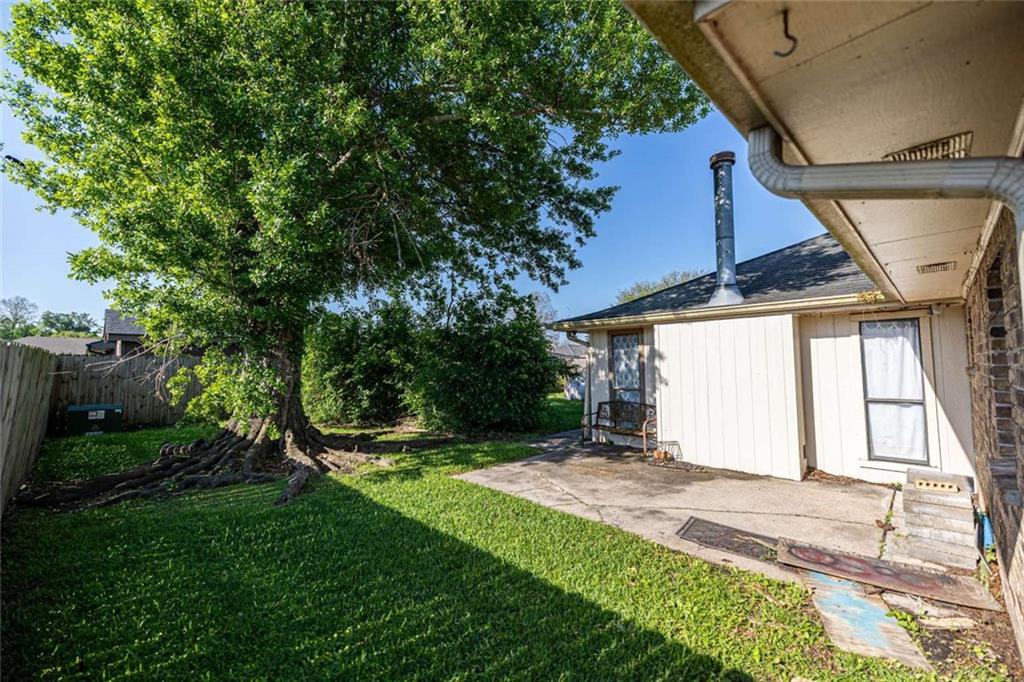
Active
$265,000
4
bds
|
3
ba
|
1,799
sqft
|
built
2020
4781 Henri Dr, Houma, LA 70364
$-81
Cash flow
-1.6%
Cash-on-Cash Return
5.3%
Cap rate
0.6%
Rent to Value Ratio
Active
$190,000
3
bds
|
2
ba
|
1,246
sqft
|
built
2017
1236 Coteau Rd, Houma, LA 70364
$205
Cash flow
5.6%
Cash-on-Cash Return
7.0%
Cap rate
0.8%
Rent to Value Ratio
Active
$299,000
5
bds
|
3
ba
|
2,710
sqft
|
built
1957
11 Austin Dr, Houma, LA 70360
$34
Cash flow
0.6%
Cash-on-Cash Return
5.8%
Cap rate
0.7%
Rent to Value Ratio
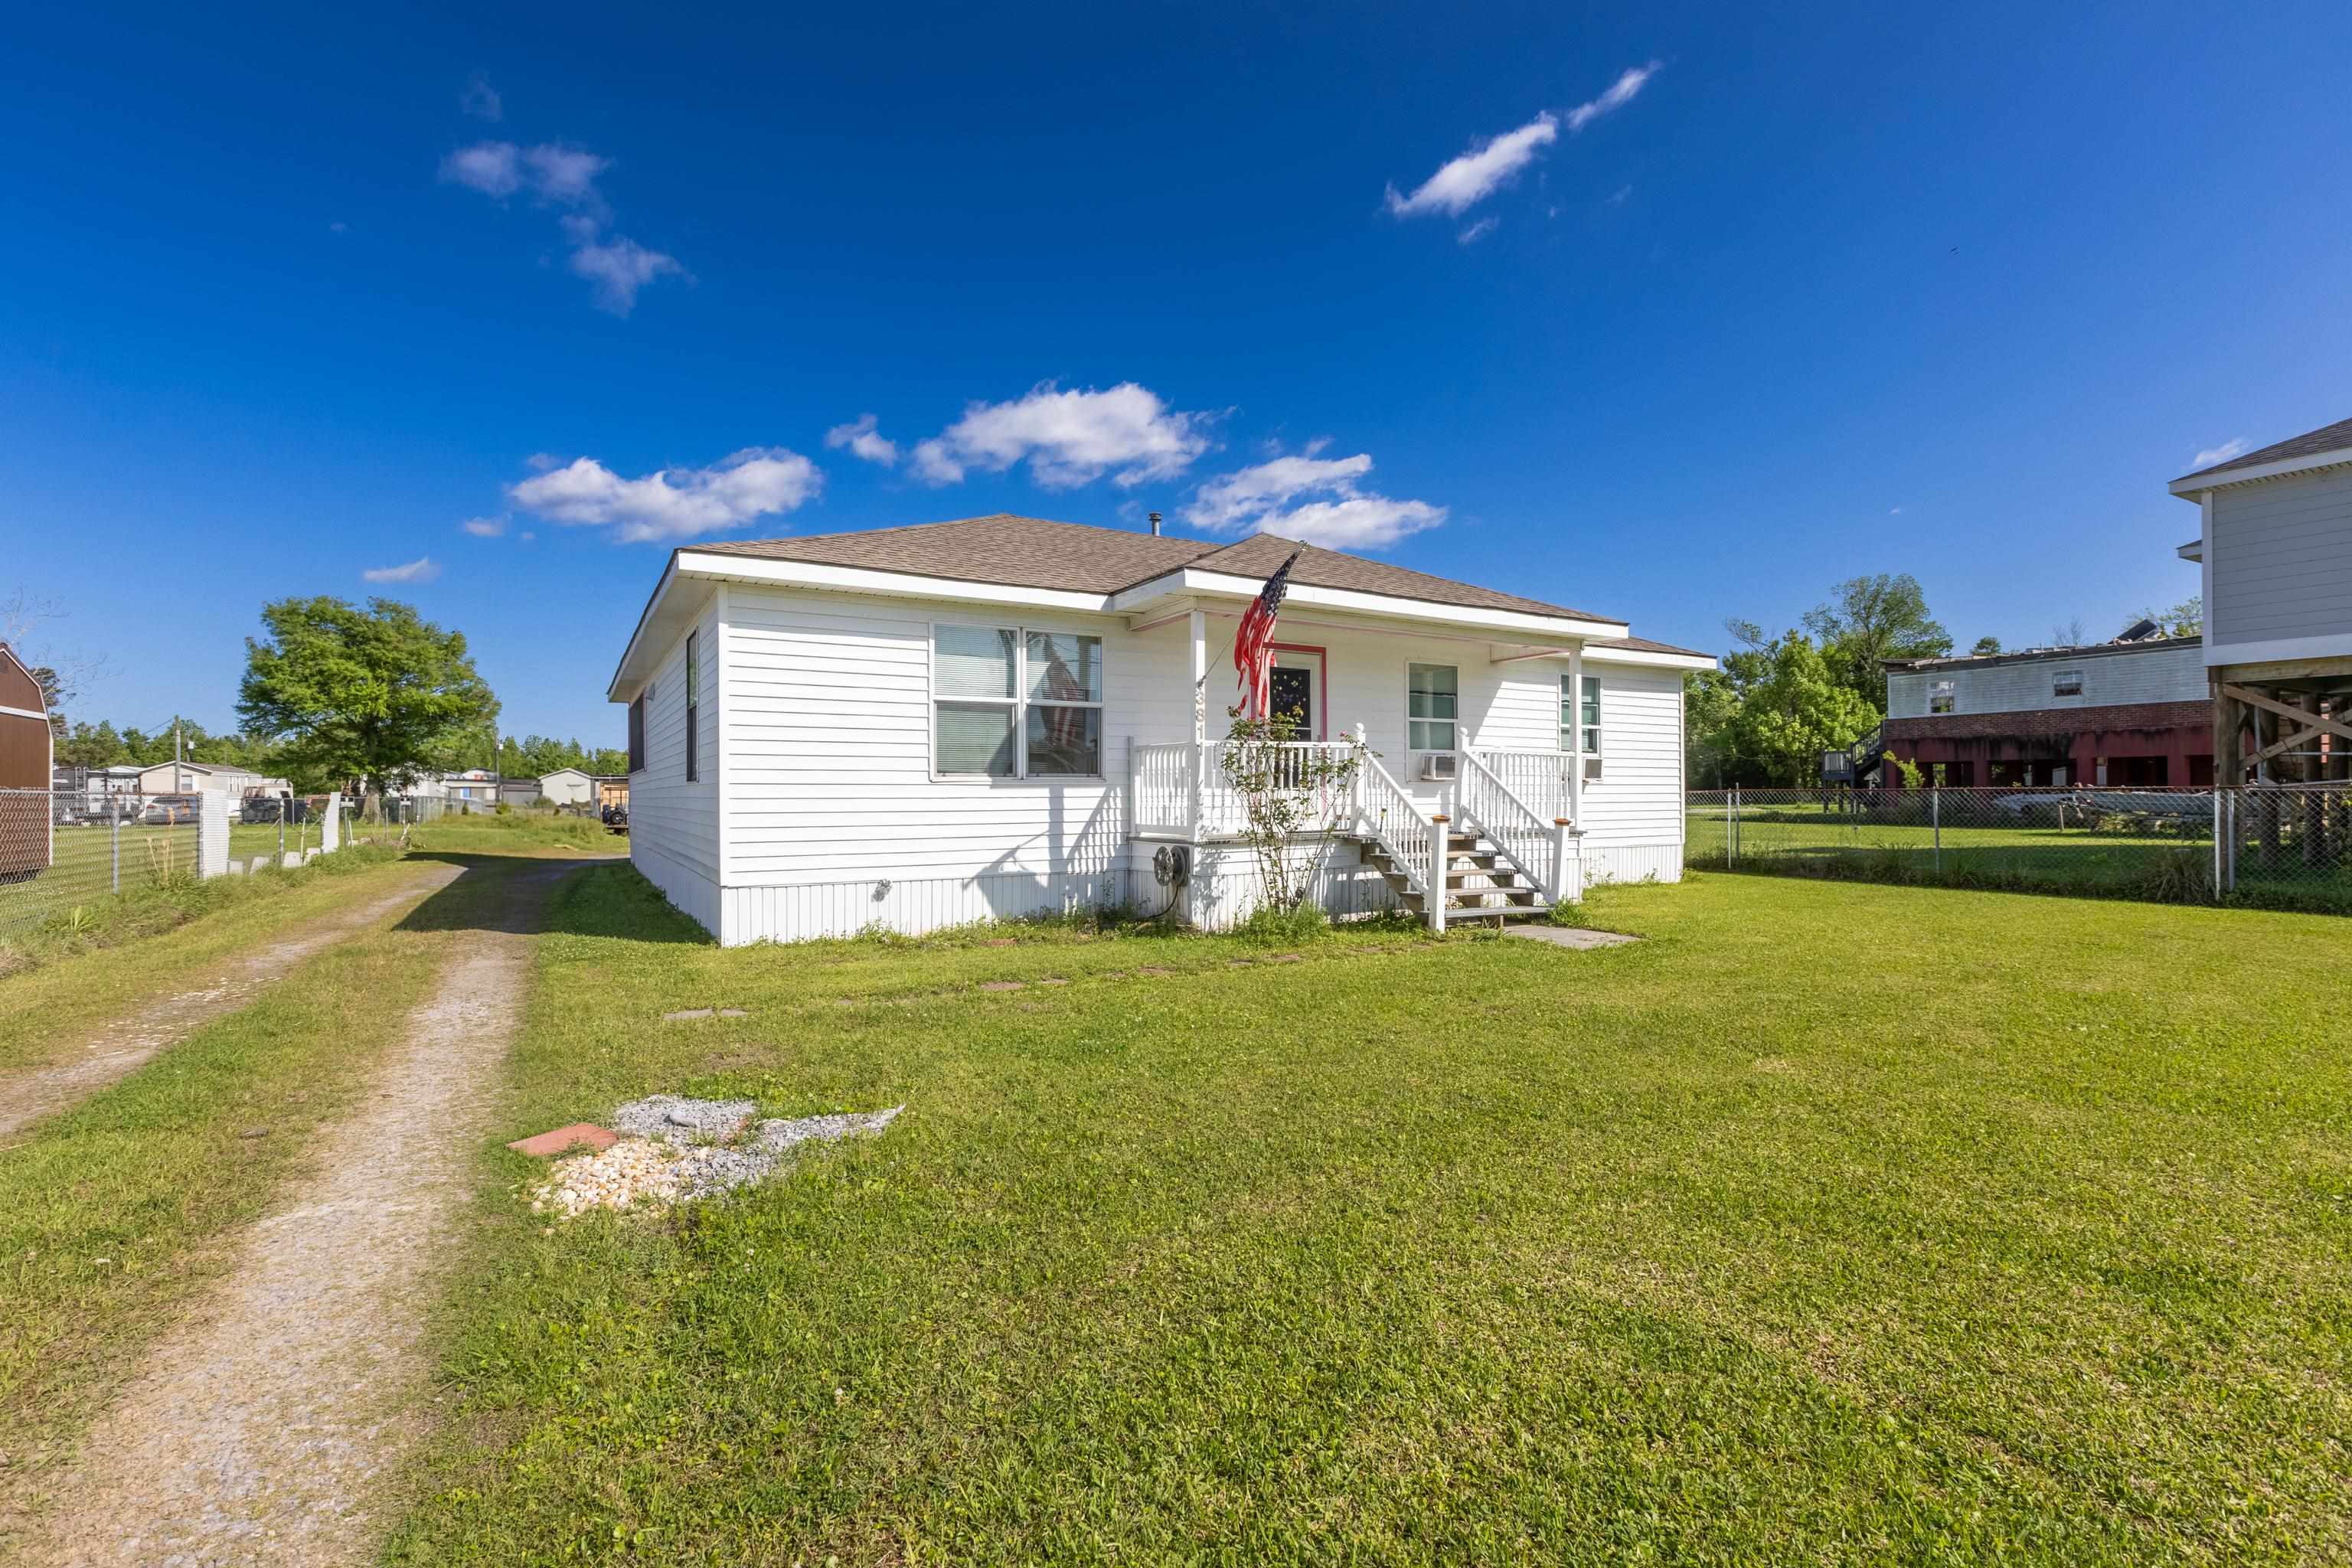
Active
$80,000
3
bds
|
2
ba
|
1,299
sqft
|
built
1950
308 Leona St, Houma, LA 70363
$587
Cash flow
38.3%
Cash-on-Cash Return
14.5%
Cap rate
1.8%
Rent to Value Ratio
Active
$144,500
3
bds
|
2
ba
|
2,100
sqft
|
built
1975
610 Gaynell Dr, Houma, LA 70364
$420
Cash flow
15.2%
Cash-on-Cash Return
9.2%
Cap rate
1.1%
Rent to Value Ratio
Active
$199,999
3
bds
|
2
ba
|
1,663
sqft
|
built
1983
706 Natalie Dr, Houma, LA 70364
$89
Cash flow
2.3%
Cash-on-Cash Return
6.2%
Cap rate
0.8%
Rent to Value Ratio
Active
$169,900
3
bds
|
2
ba
|
1,344
sqft
|
built
1938
1225 Lee Ave, Houma, LA 70360
$162
Cash flow
5.0%
Cash-on-Cash Return
6.8%
Cap rate
0.8%
Rent to Value Ratio
Active
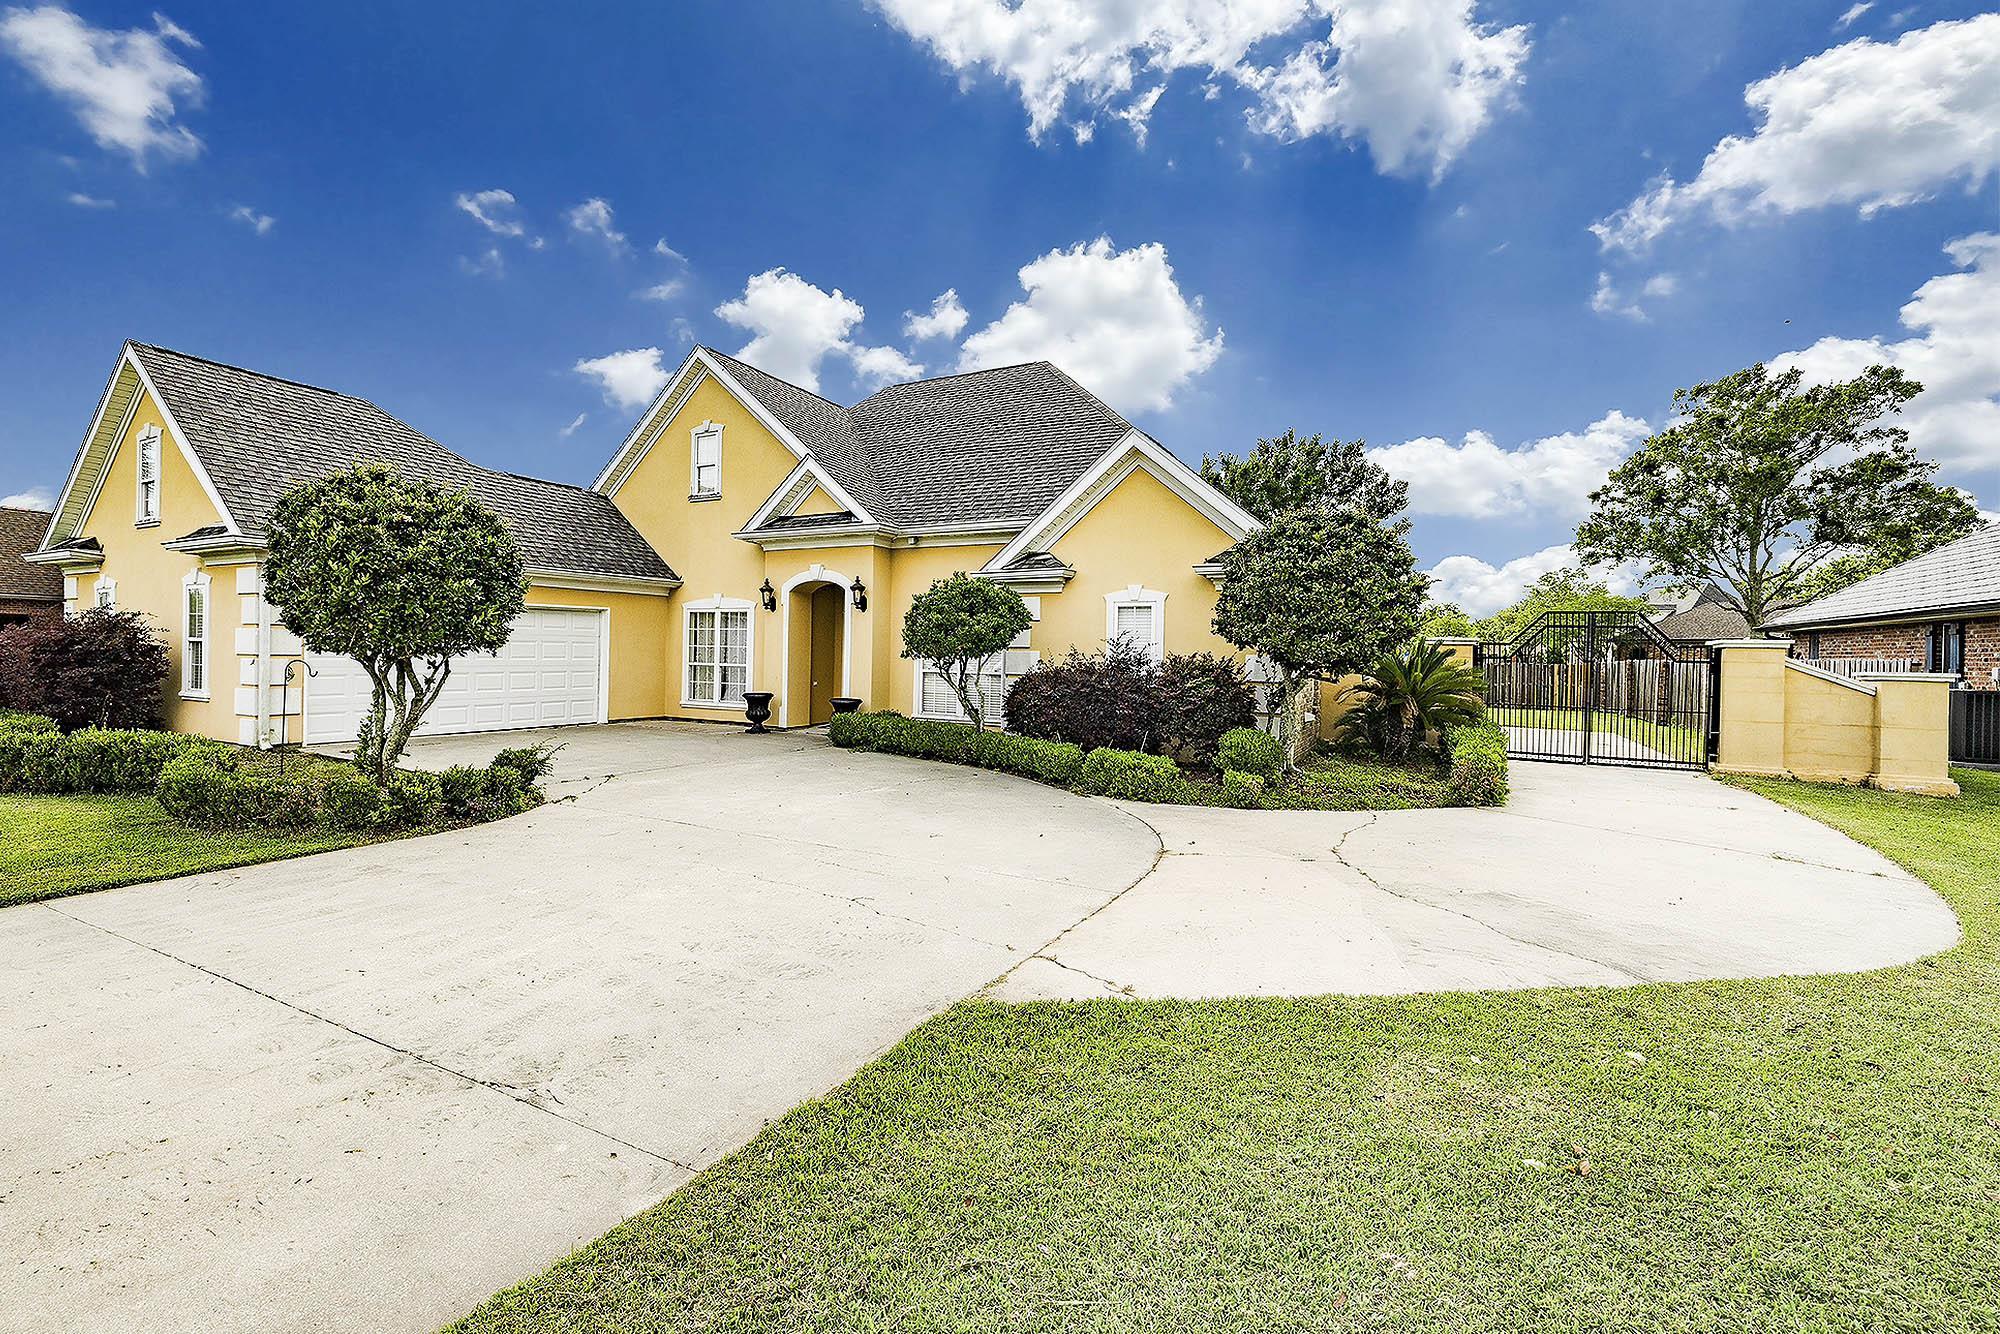
$325,000
5
bds
|
4
ba
|
2,511
sqft
|
built
1984
208 Chantilly Dr, Houma, LA 70360
$-434
Cash flow
-7.0%
Cash-on-Cash Return
4.1%
Cap rate
0.5%
Rent to Value Ratio
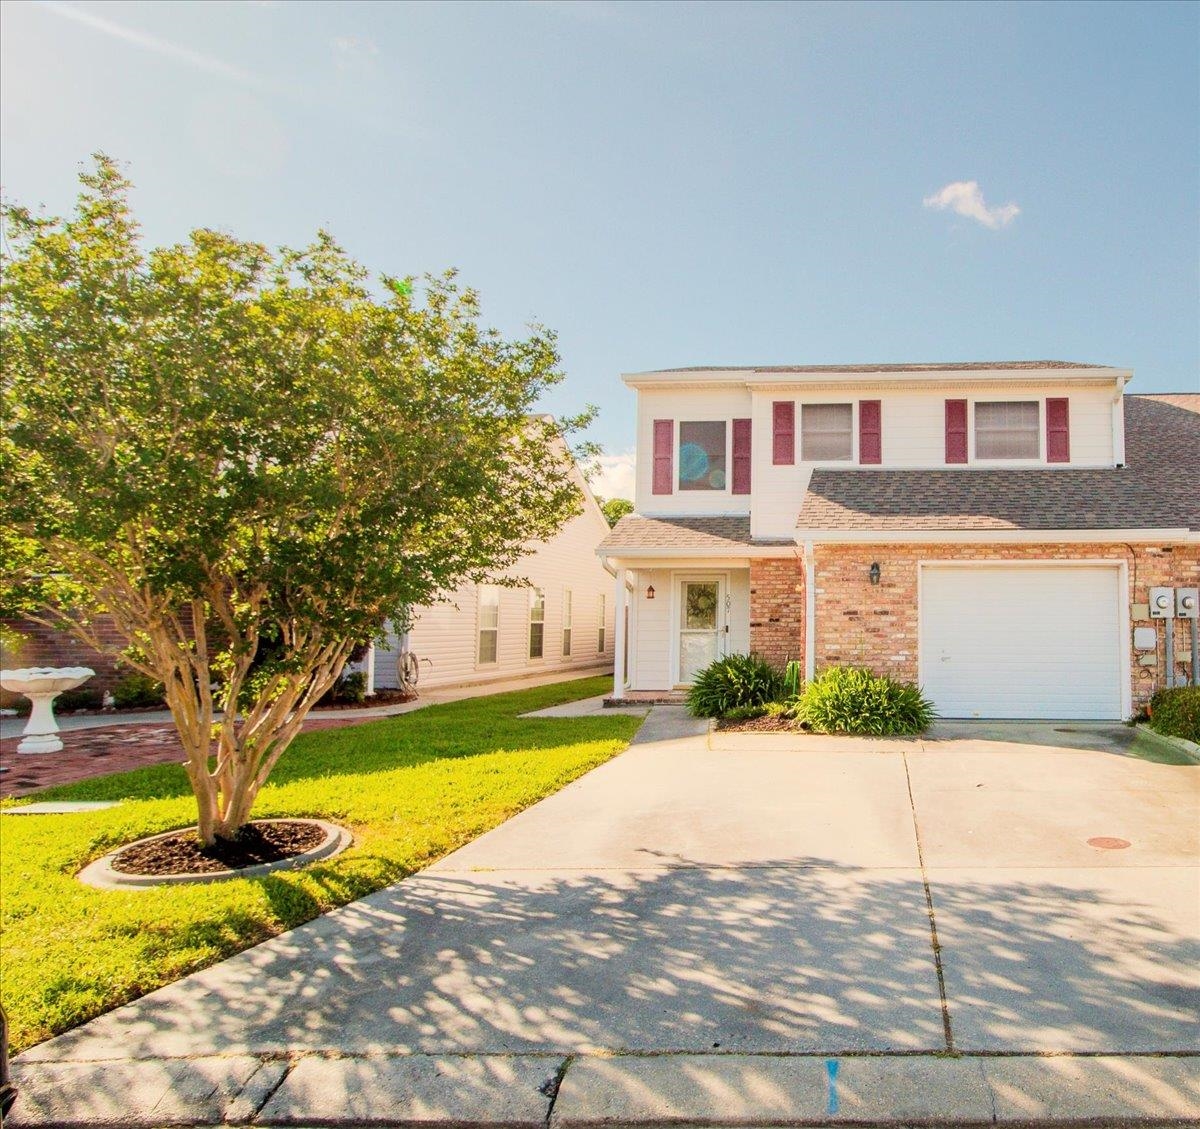
Active
$299,999
4
bds
|
4
ba
|
3,138
sqft
|
built
1978
306 E Woodlawn Ranch Rd, Houma, LA 70363
$-454
Cash flow
-7.9%
Cash-on-Cash Return
3.9%
Cap rate
0.5%
Rent to Value Ratio
Active
$161,900
3
bds
|
2
ba
|
1,976
sqft
|
built
1971
208 Lyles St, Houma, LA 70363
$338
Cash flow
10.9%
Cash-on-Cash Return
8.2%
Cap rate
1.0%
Rent to Value Ratio
Active
$115,000
4
bds
|
2
ba
|
1,152
sqft
|
built
2001
282 Hummingbird Dr, Houma, LA 70364
$353
Cash flow
16.0%
Cash-on-Cash Return
9.4%
Cap rate
1.1%
Rent to Value Ratio
Active
$175,000
4
bds
|
3
ba
|
6,000
sqft
|
built
1982
6461 Grand Caillou Rd, Houma, LA 70363
$690
Cash flow
20.6%
Cash-on-Cash Return
10.4%
Cap rate
1.3%
Rent to Value Ratio
Active
$162,950
2
bds
|
2
ba
|
1,323
sqft
|
built
2000
339 Monarch Dr, Houma, LA 70364
$195
Cash flow
6.2%
Cash-on-Cash Return
7.1%
Cap rate
0.9%
Rent to Value Ratio
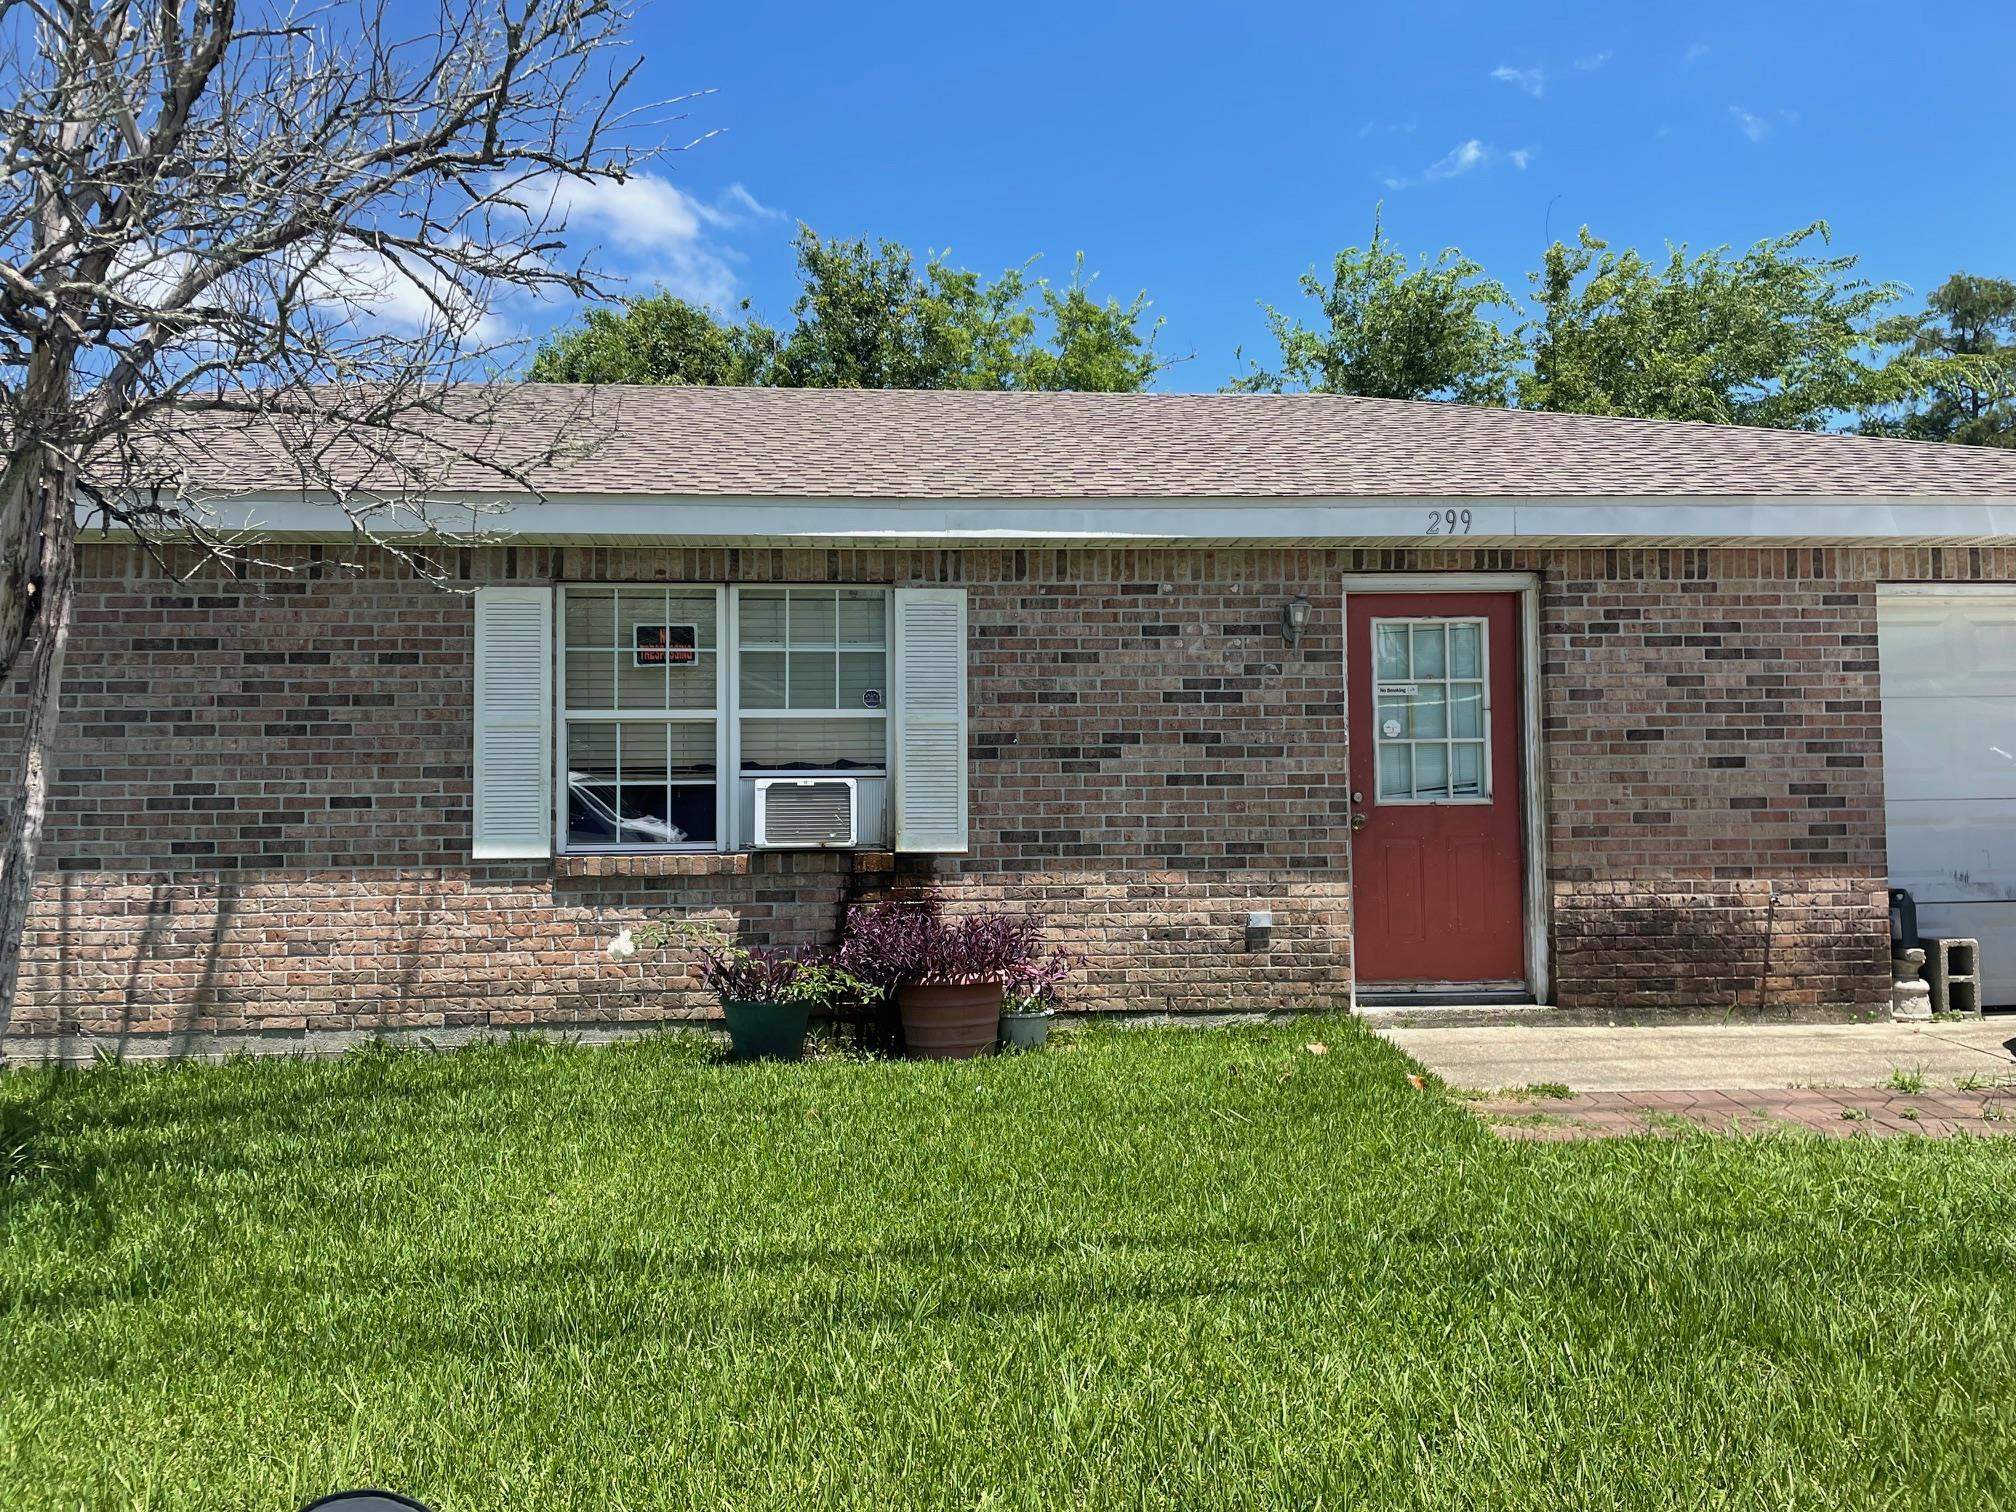
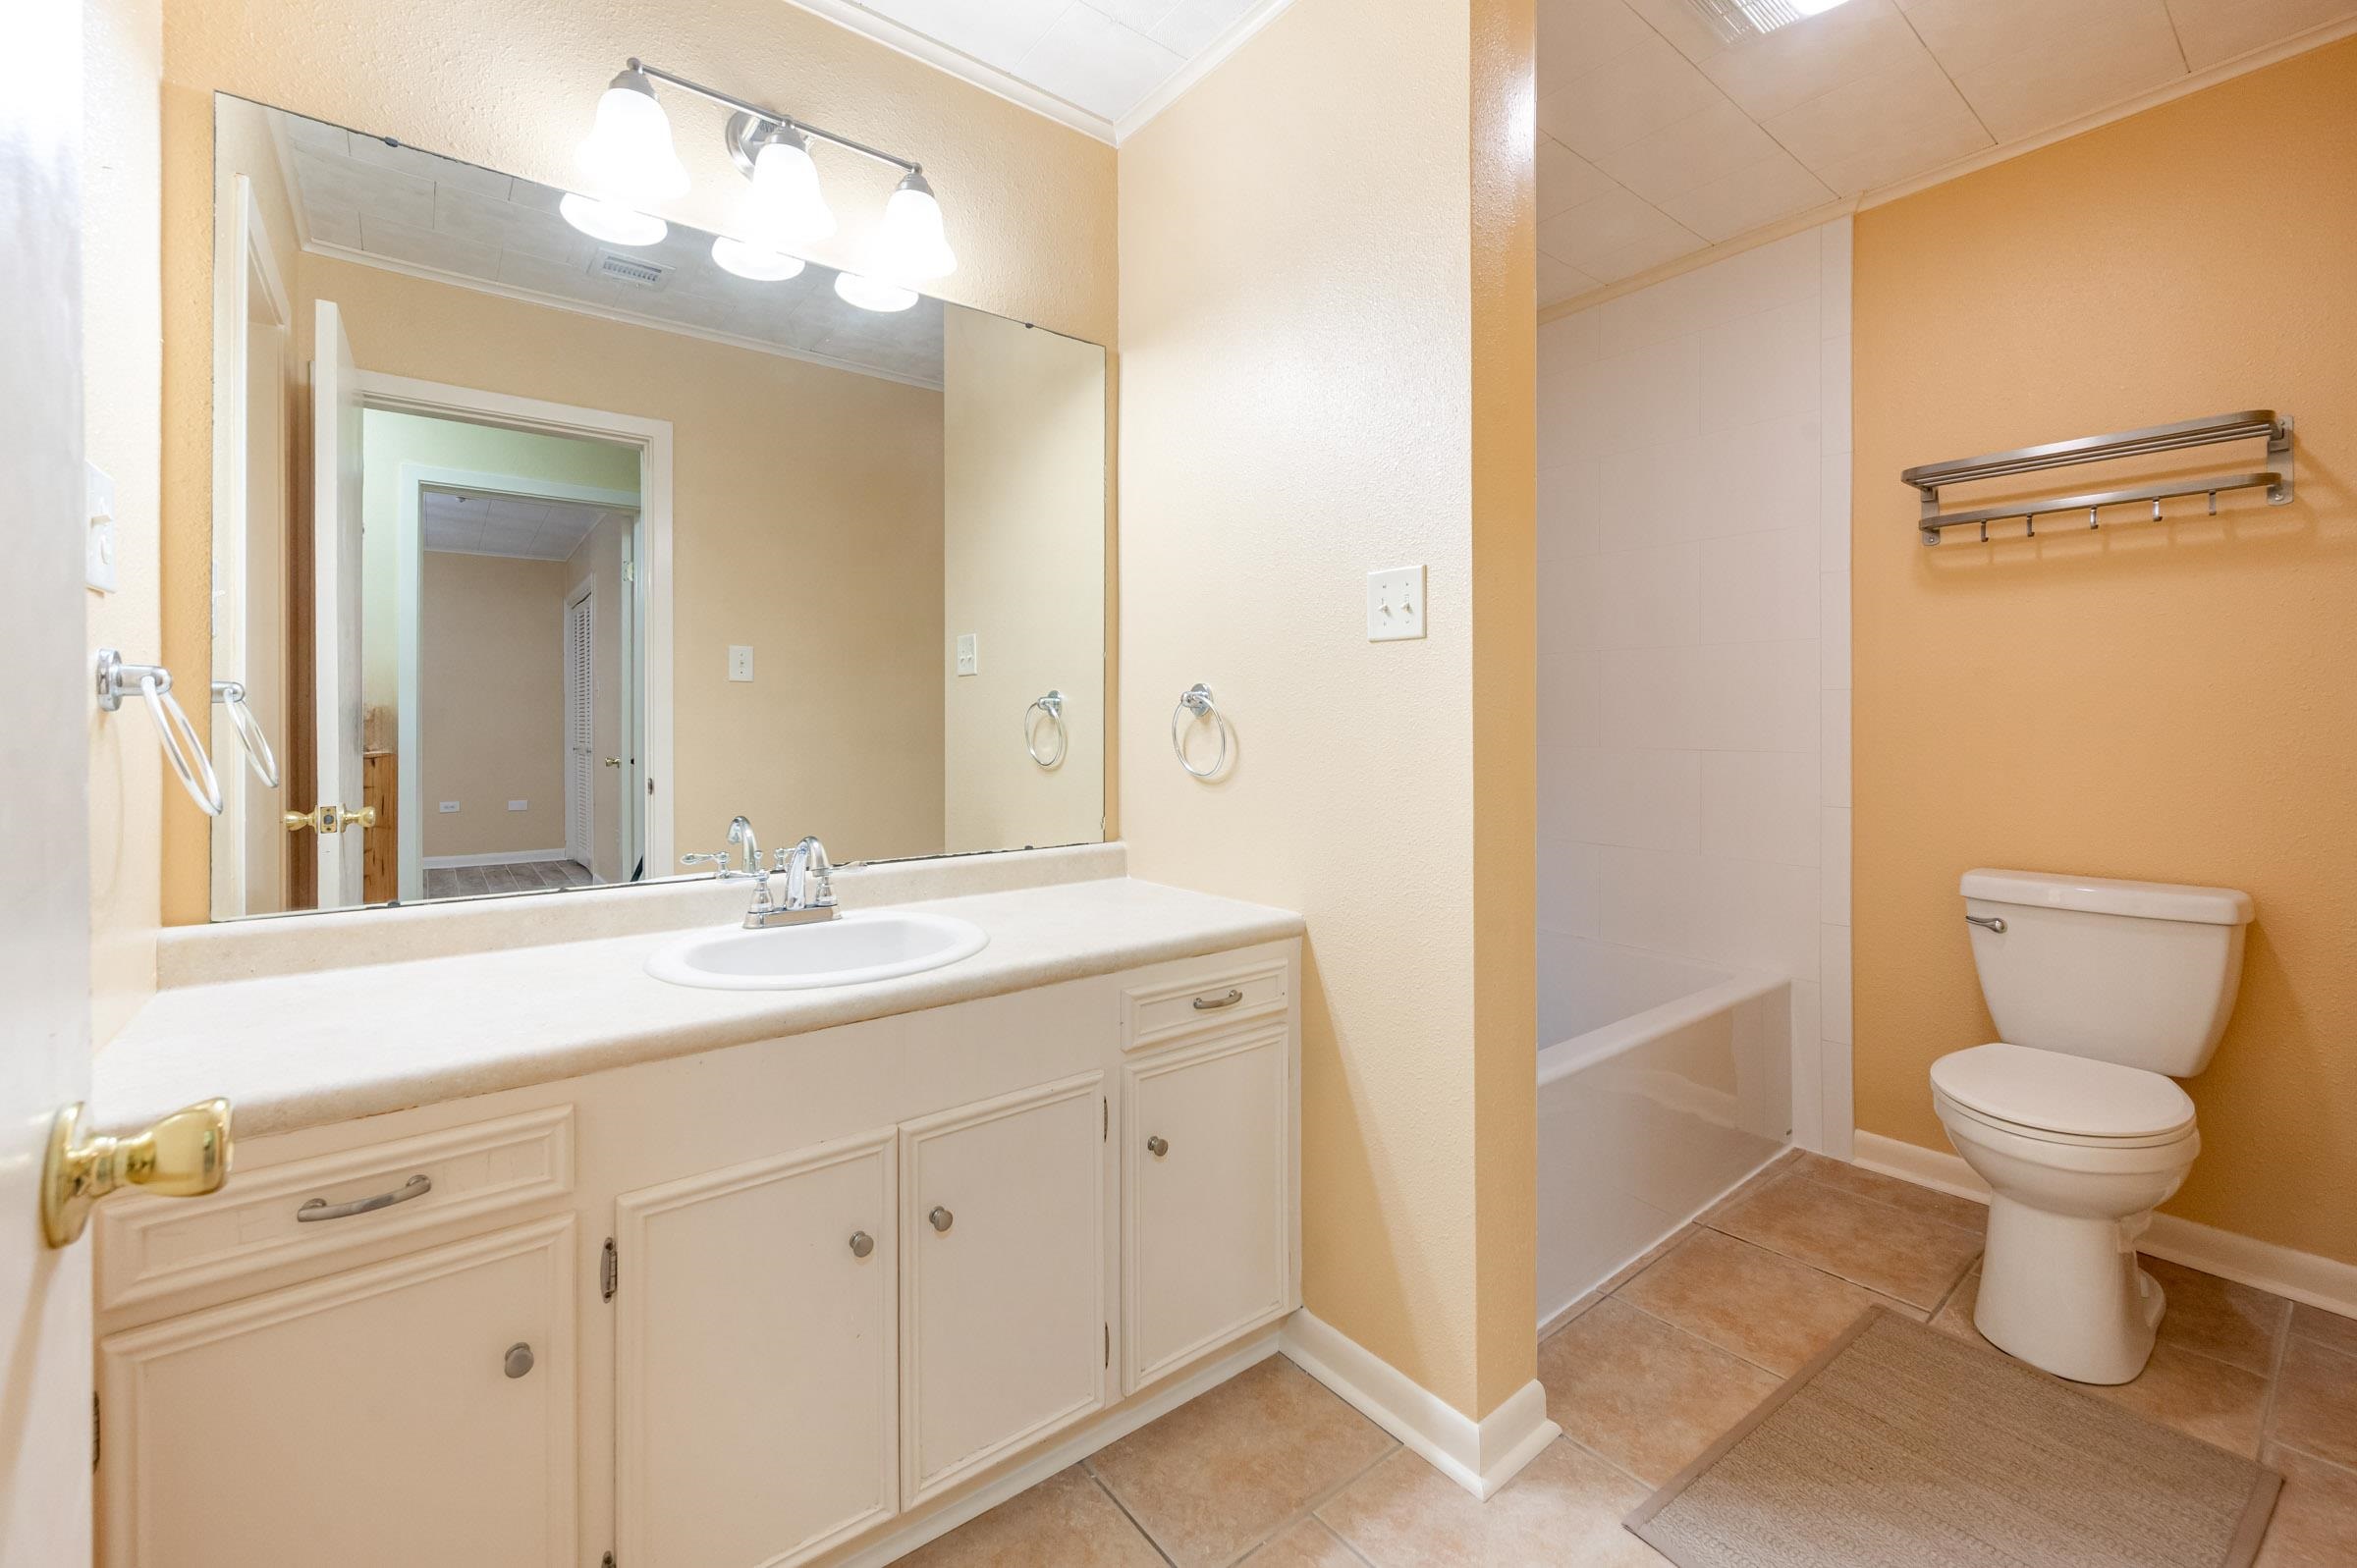
Active
$97,500
3
bds
|
2
ba
|
1,319
sqft
|
built
2002
299 Authement St, Houma, LA 70363
$436
Cash flow
23.3%
Cash-on-Cash Return
11.0%
Cap rate
1.3%
Rent to Value Ratio
Active
$425,000
4
bds
|
3
ba
|
4,765
sqft
|
built
1972
209 Country Estates Dr, Houma, LA 70364
$-769
Cash flow
-9.4%
Cash-on-Cash Return
3.5%
Cap rate
0.4%
Rent to Value Ratio
Active
$115,000
3
bds
|
3
ba
|
1,672
sqft
|
built
1996
3811 Grand Caillou Rd, Houma, LA 70363
$422
Cash flow
19.1%
Cash-on-Cash Return
10.1%
Cap rate
1.2%
Rent to Value Ratio
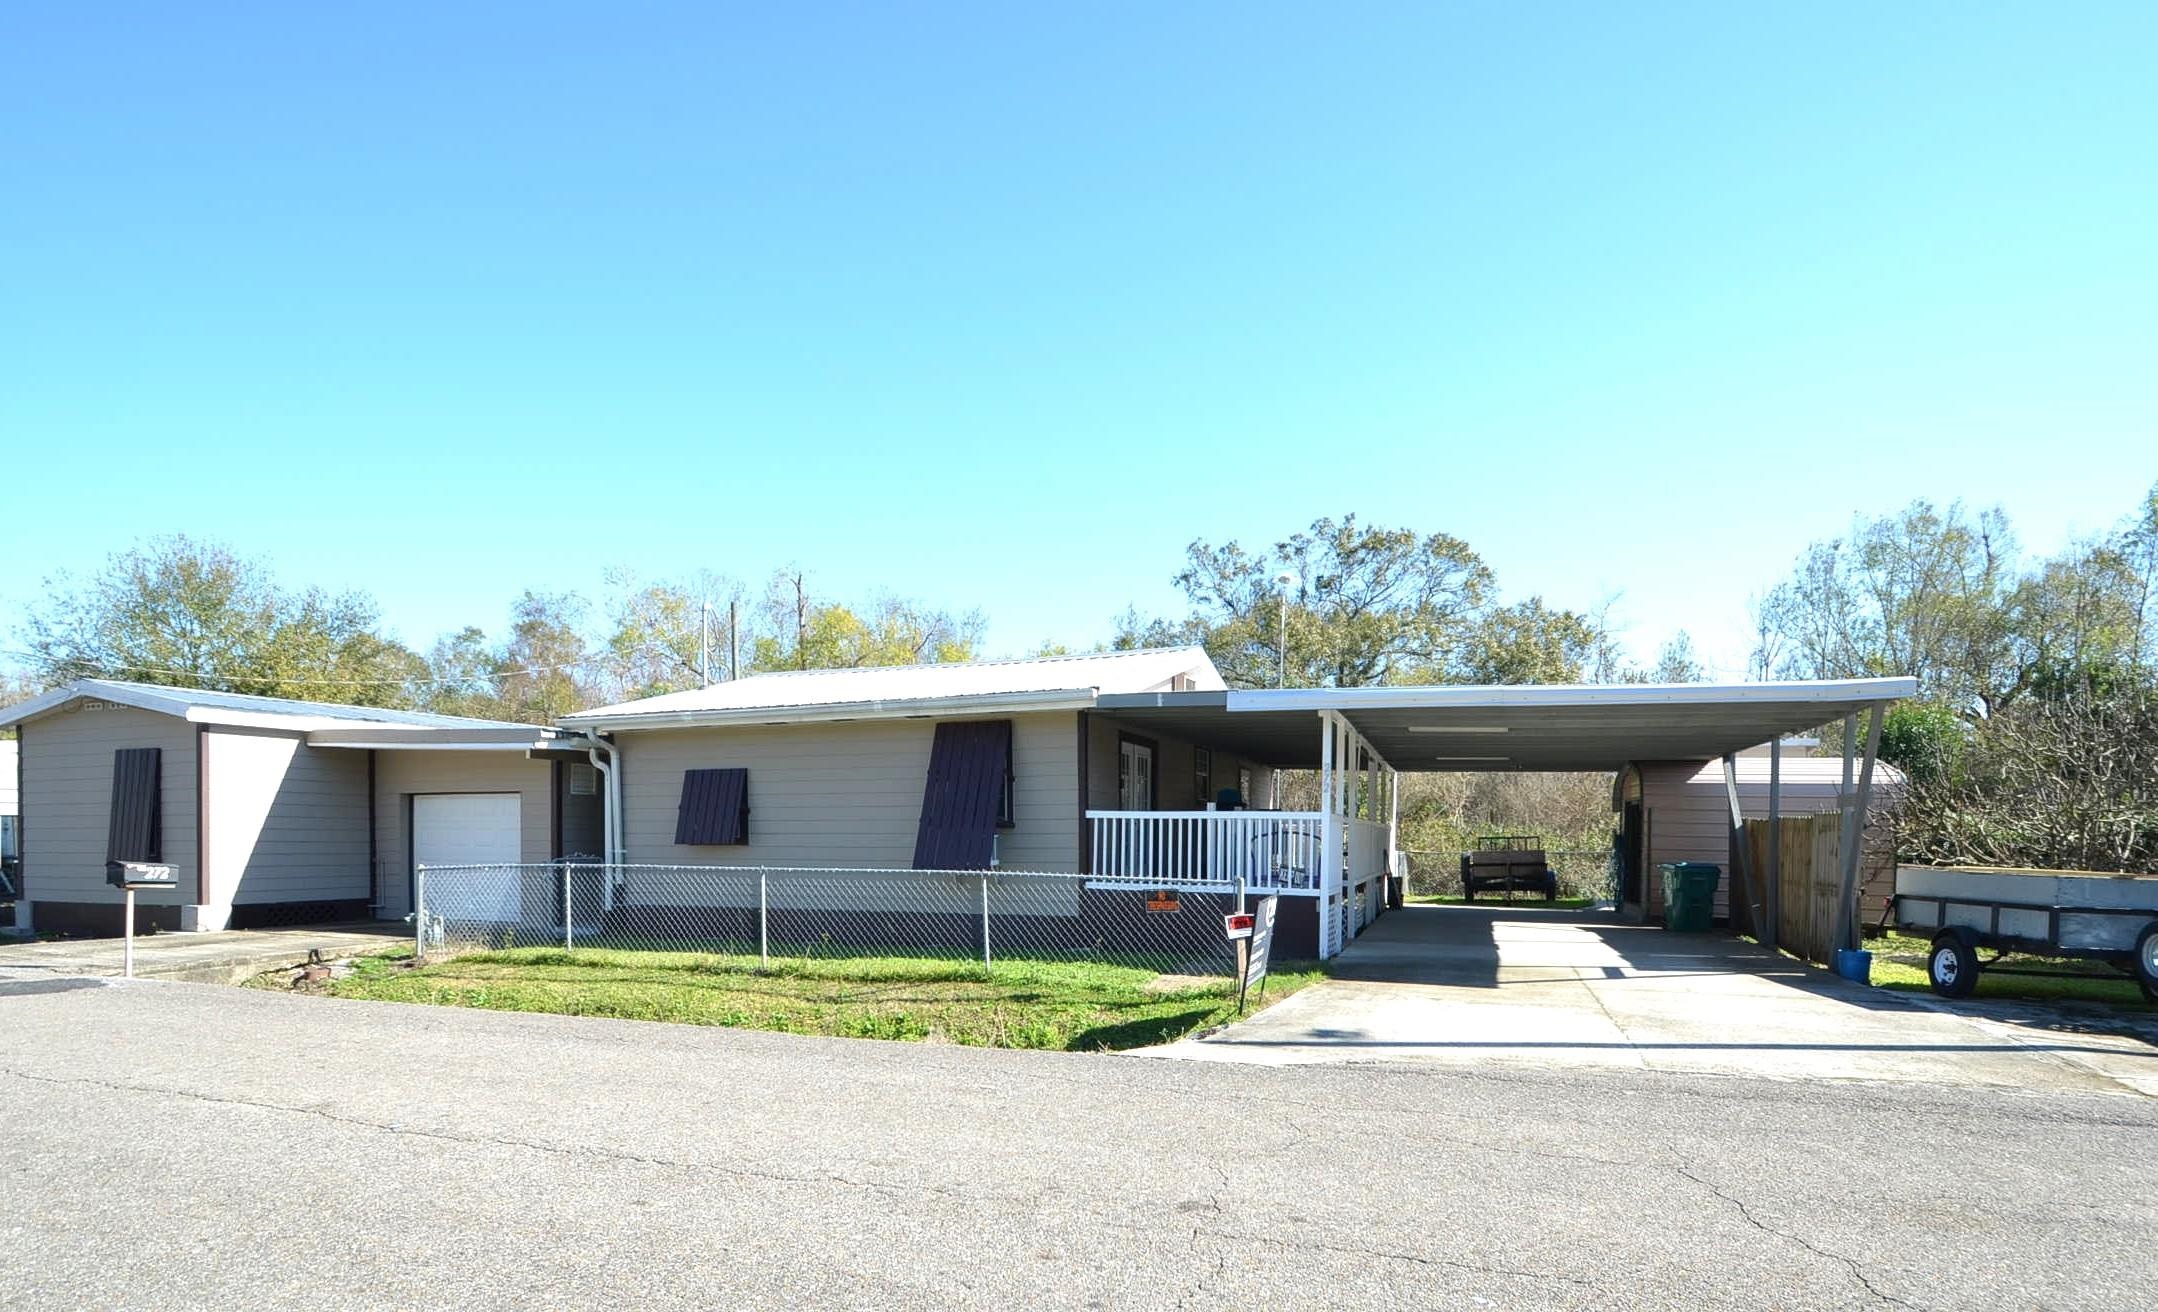
Active
$165,000
3
bds
|
3
ba
|
2,117
sqft
|
built
2002
272 Louise Ln, Houma, LA 70364
$185
Cash flow
5.8%
Cash-on-Cash Return
7.0%
Cap rate
0.8%
Rent to Value Ratio
Active
$600,000
5
bds
|
4
ba
|
3,305
sqft
|
built
2014
256 Riverwood Dr, Houma, LA 70360
$-1,252
Cash flow
-10.9%
Cash-on-Cash Return
3.2%
Cap rate
0.4%
Rent to Value Ratio
Active
$199,900
3
bds
|
2
ba
|
1,750
sqft
|
built
1955
527 Maple Ave, Houma, LA 70364
$434
Cash flow
11.3%
Cash-on-Cash Return
8.3%
Cap rate
1.0%
Rent to Value Ratio
Active
$282,000
3
bds
|
2
ba
|
2,021
sqft
|
built
1979
214 Lake Crescent Cir, Houma, LA 70360
$-231
Cash flow
-4.3%
Cash-on-Cash Return
4.7%
Cap rate
0.6%
Rent to Value Ratio
Active
$638,000
4
bds
|
4
ba
|
3,306
sqft
|
built
1997
21 Richland Row, Houma, LA 70360
$-1,501
Cash flow
-12.3%
Cash-on-Cash Return
2.9%
Cap rate
0.3%
Rent to Value Ratio
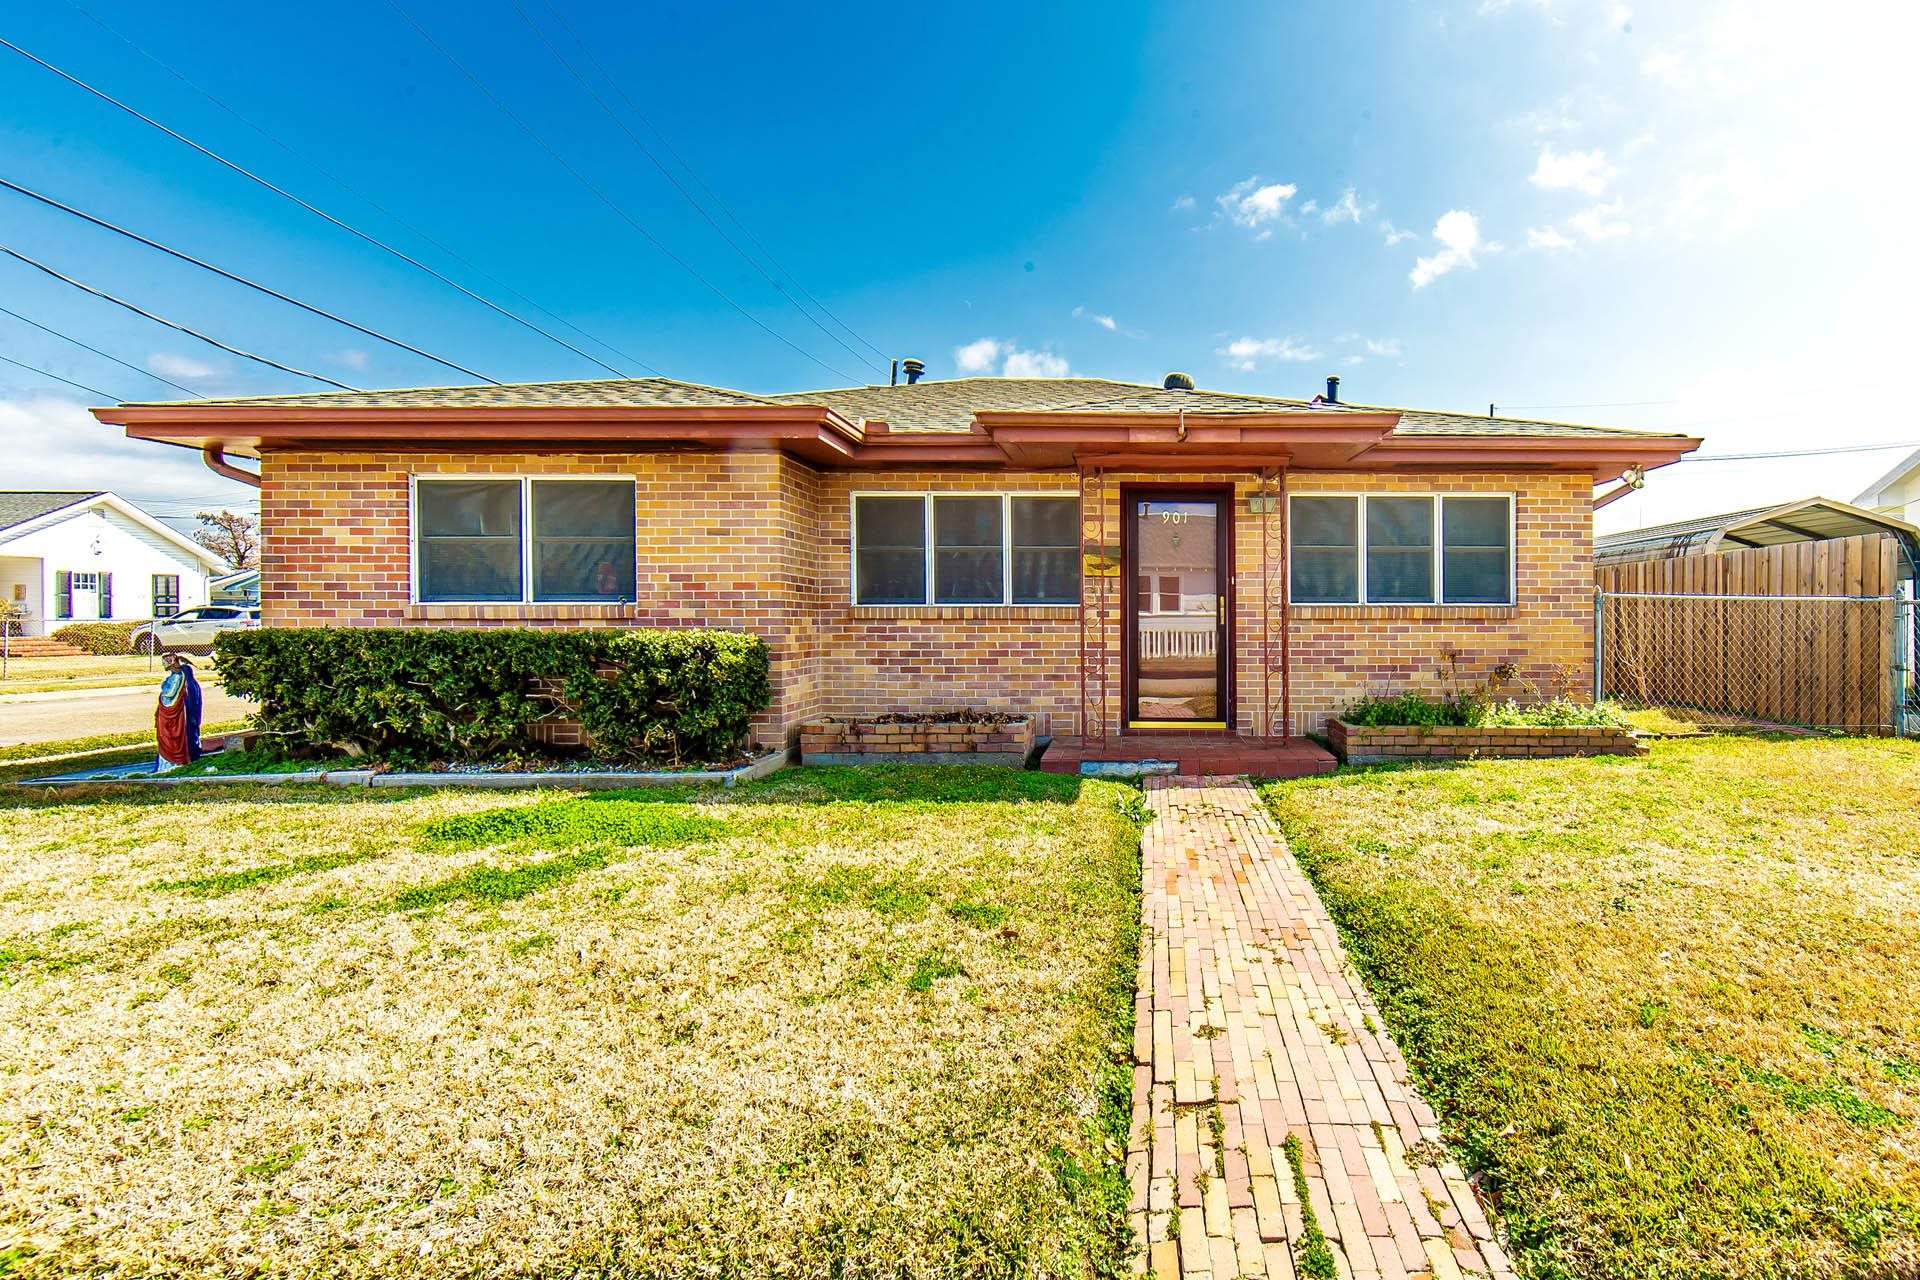
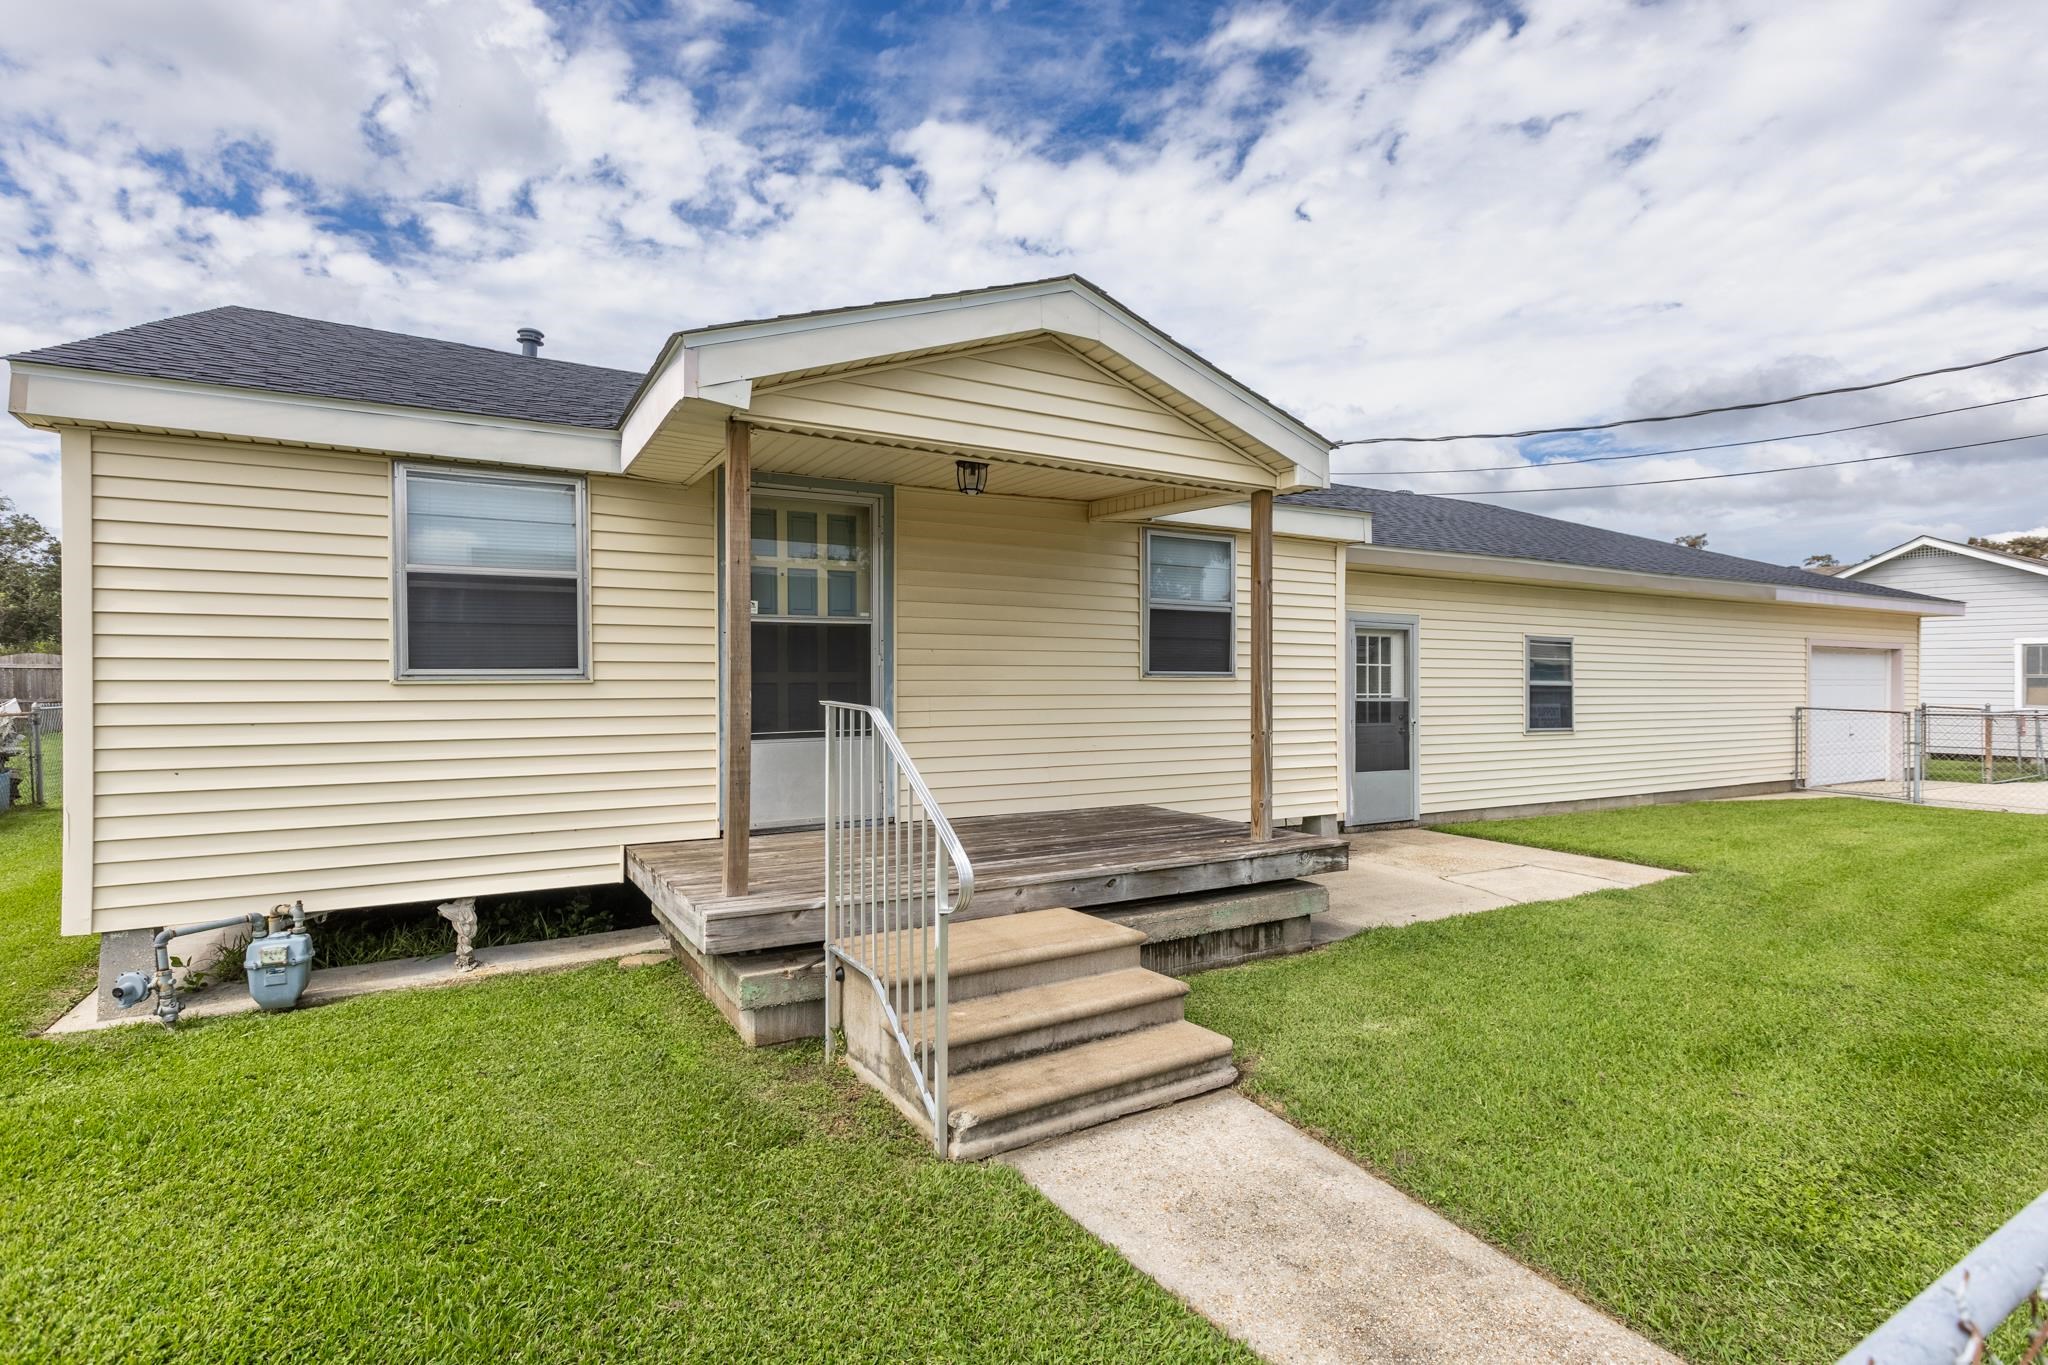
Active
$179,500
4
bds
|
2
ba
|
1,601
sqft
|
built
1958
901 Liberty St, Houma, LA 70360
$117
Cash flow
3.4%
Cash-on-Cash Return
6.5%
Cap rate
0.8%
Rent to Value Ratio

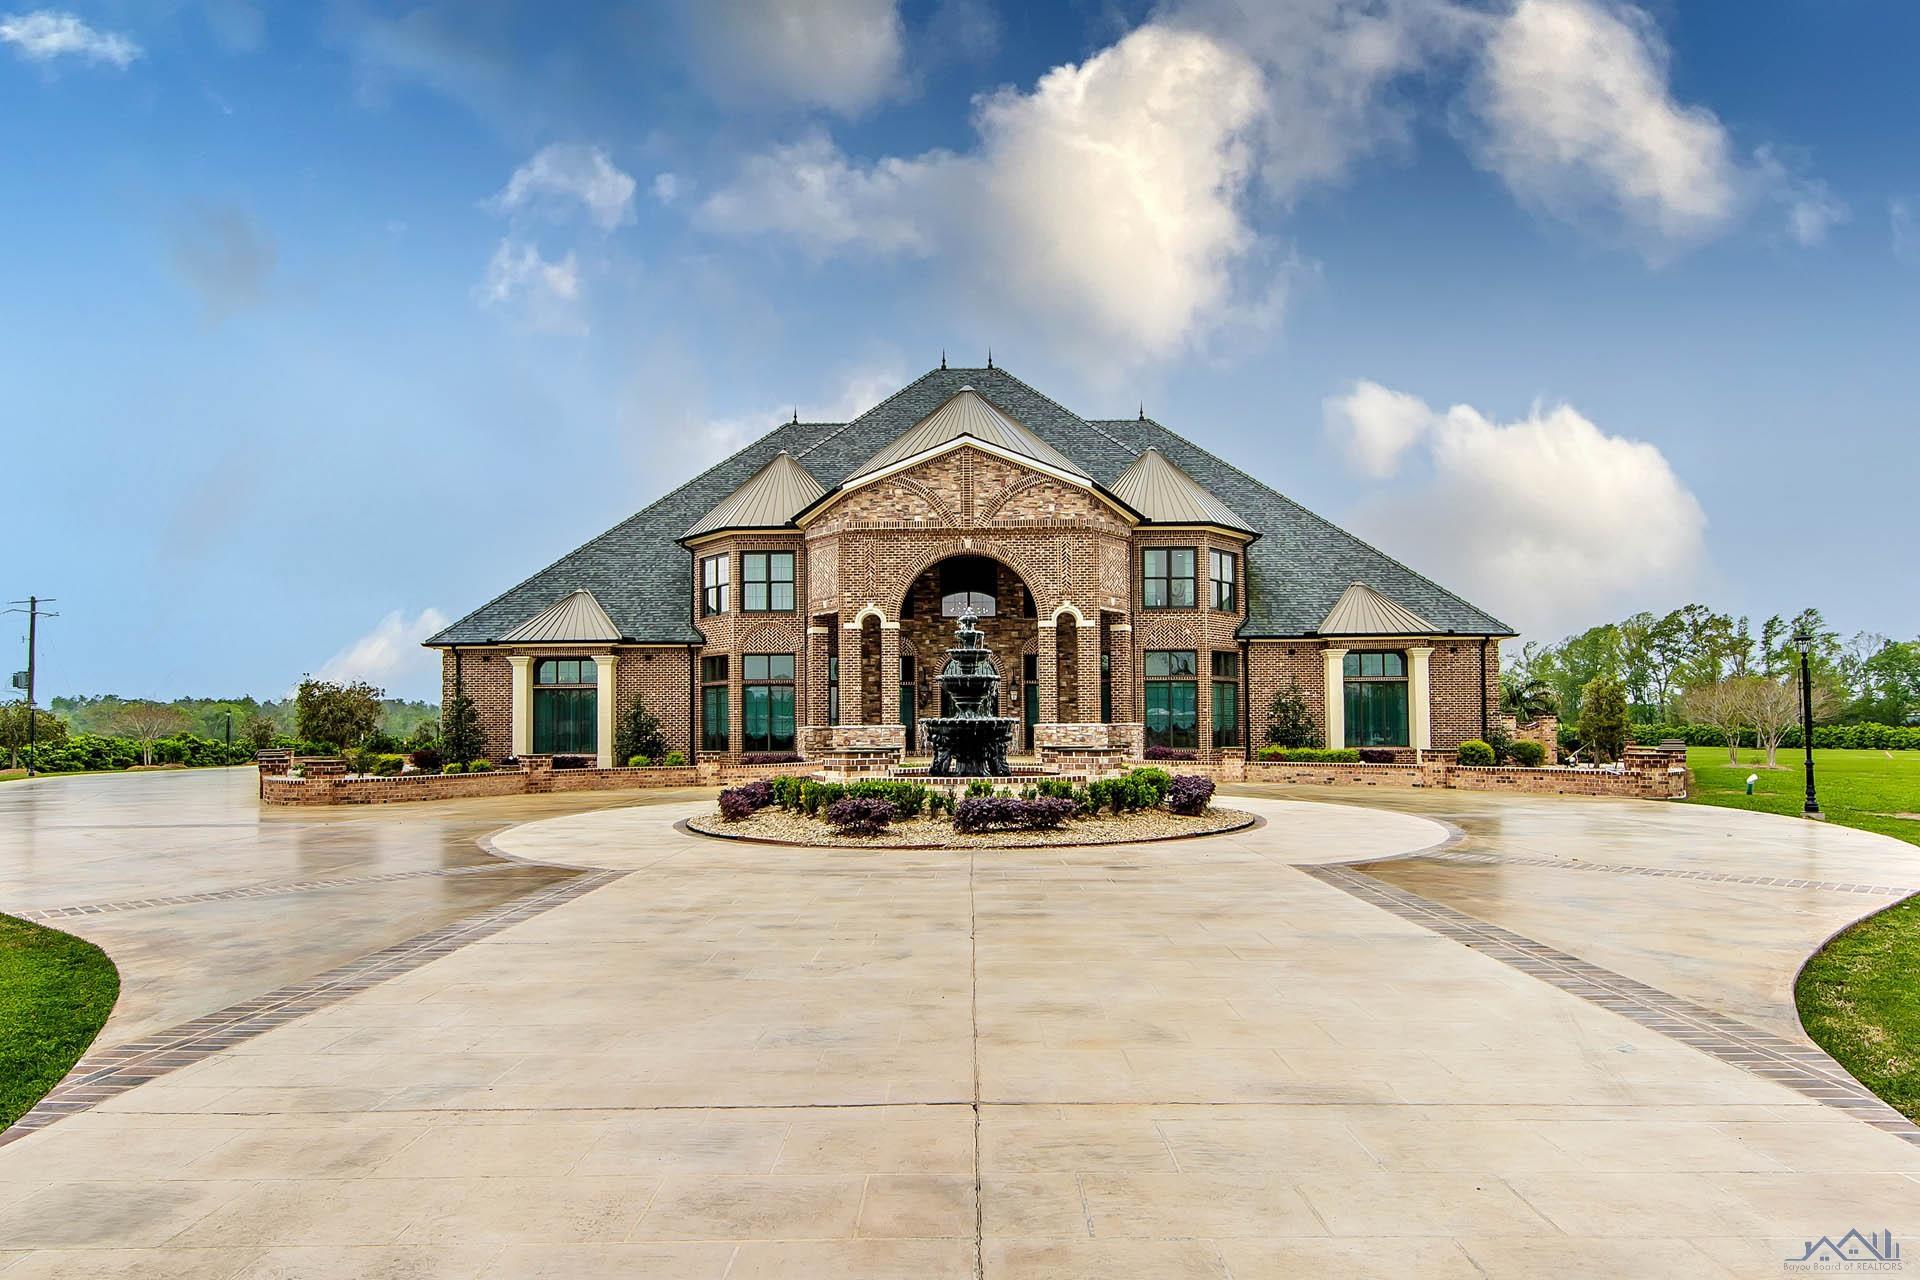
Active
$3,400,000
4
bds
|
7
ba
|
8,841
sqft
|
built
2014
1 Glen Oaks Dr, Houma, LA 70360
$-14,448
Cash flow
-22.2%
Cash-on-Cash Return
0.6%
Cap rate
0.1%
Rent to Value Ratio

Active
$445,000
4
bds
|
2
ba
|
2,347
sqft
|
built
2008
316 Brentwood Dr, Houma, LA 70360
$-726
Cash flow
-8.5%
Cash-on-Cash Return
3.7%
Cap rate
0.4%
Rent to Value Ratio
Active
$100,000
2
bds
|
1
ba
|
871
sqft
|
built
1957
217 Pitre St, Houma, LA 70363
$493
Cash flow
25.7%
Cash-on-Cash Return
11.6%
Cap rate
1.4%
Rent to Value Ratio
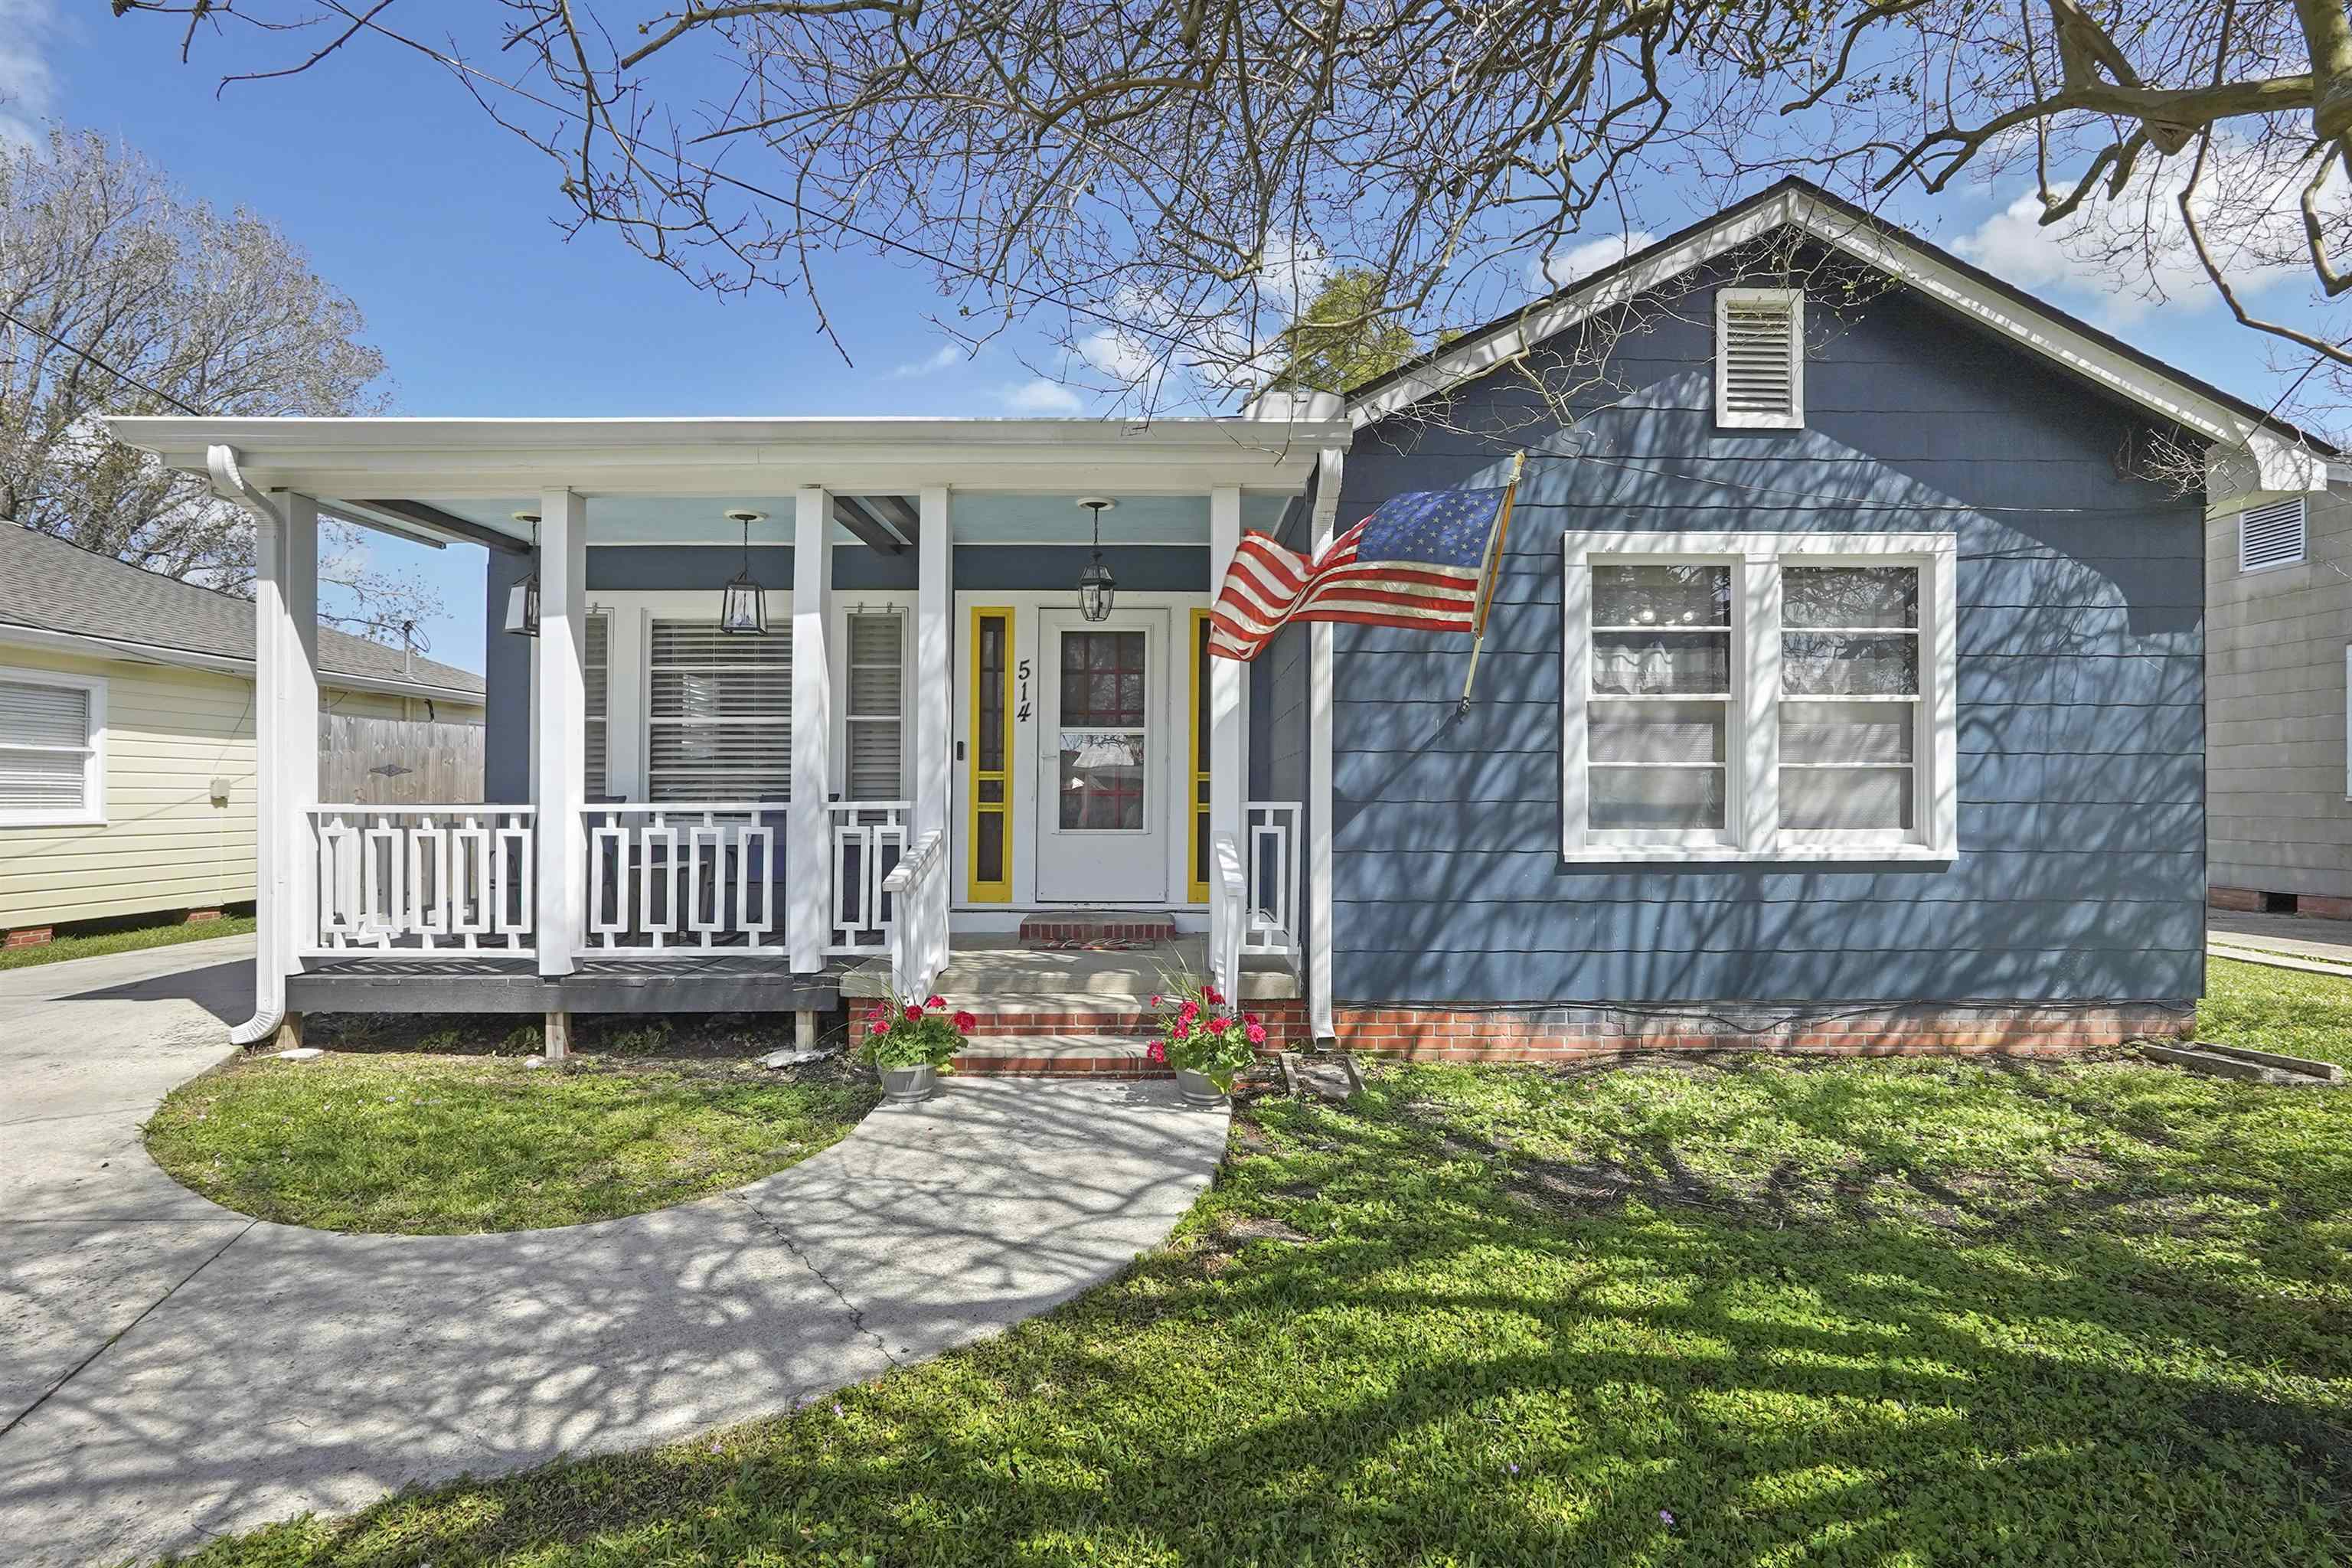
Active
$190,000
3
bds
|
1
ba
|
1,522
sqft
|
built
1960
514 Maple Ave, Houma, LA 70364
$67
Cash flow
1.8%
Cash-on-Cash Return
6.1%
Cap rate
0.7%
Rent to Value Ratio

Active
$99,000
1
bds
|
1
ba
|
838
sqft
|
built
1950
180 New Orleans Blvd, Houma, LA 70364
$428
Cash flow
22.6%
Cash-on-Cash Return
10.9%
Cap rate
1.3%
Rent to Value Ratio
Active
$225,000
3
bds
|
2
ba
|
1,436
sqft
|
built
1980
108 Kenney St, Houma, LA 70364
$-99
Cash flow
-2.3%
Cash-on-Cash Return
5.2%
Cap rate
0.6%
Rent to Value Ratio
Active
$375,000
3
bds
|
2
ba
|
1,907
sqft
|
built
2002
134 Lake Mechant Ct, Houma, LA 70360
$-307
Cash flow
-4.3%
Cash-on-Cash Return
4.7%
Cap rate
0.6%
Rent to Value Ratio
Active
$84,000
3
bds
|
1
ba
|
1,932
sqft
|
built
1979
300 Canal Ln, Houma, LA 70364
$706
Cash flow
43.9%
Cash-on-Cash Return
15.8%
Cap rate
1.9%
Rent to Value Ratio

Active
$170,000
3
bds
|
2
ba
|
1,516
sqft
|
built
1969
101 Windham Dr, Houma, LA 70360
$300
Cash flow
9.2%
Cash-on-Cash Return
7.8%
Cap rate
0.9%
Rent to Value Ratio
Active
$4,200,000
6
bds
|
8
ba
|
10,648
sqft
|
built
2018
4114 Highway 56, Houma, LA 70363
$-18,151
Cash flow
-22.5%
Cash-on-Cash Return
0.5%
Cap rate
0.1%
Rent to Value Ratio
Active
$219,000
3
bds
|
2
ba
|
1,730
sqft
|
built
1997
507 N French Quarter Dr, Houma, LA 70364
$68
Cash flow
1.6%
Cash-on-Cash Return
6.0%
Cap rate
0.7%
Rent to Value Ratio
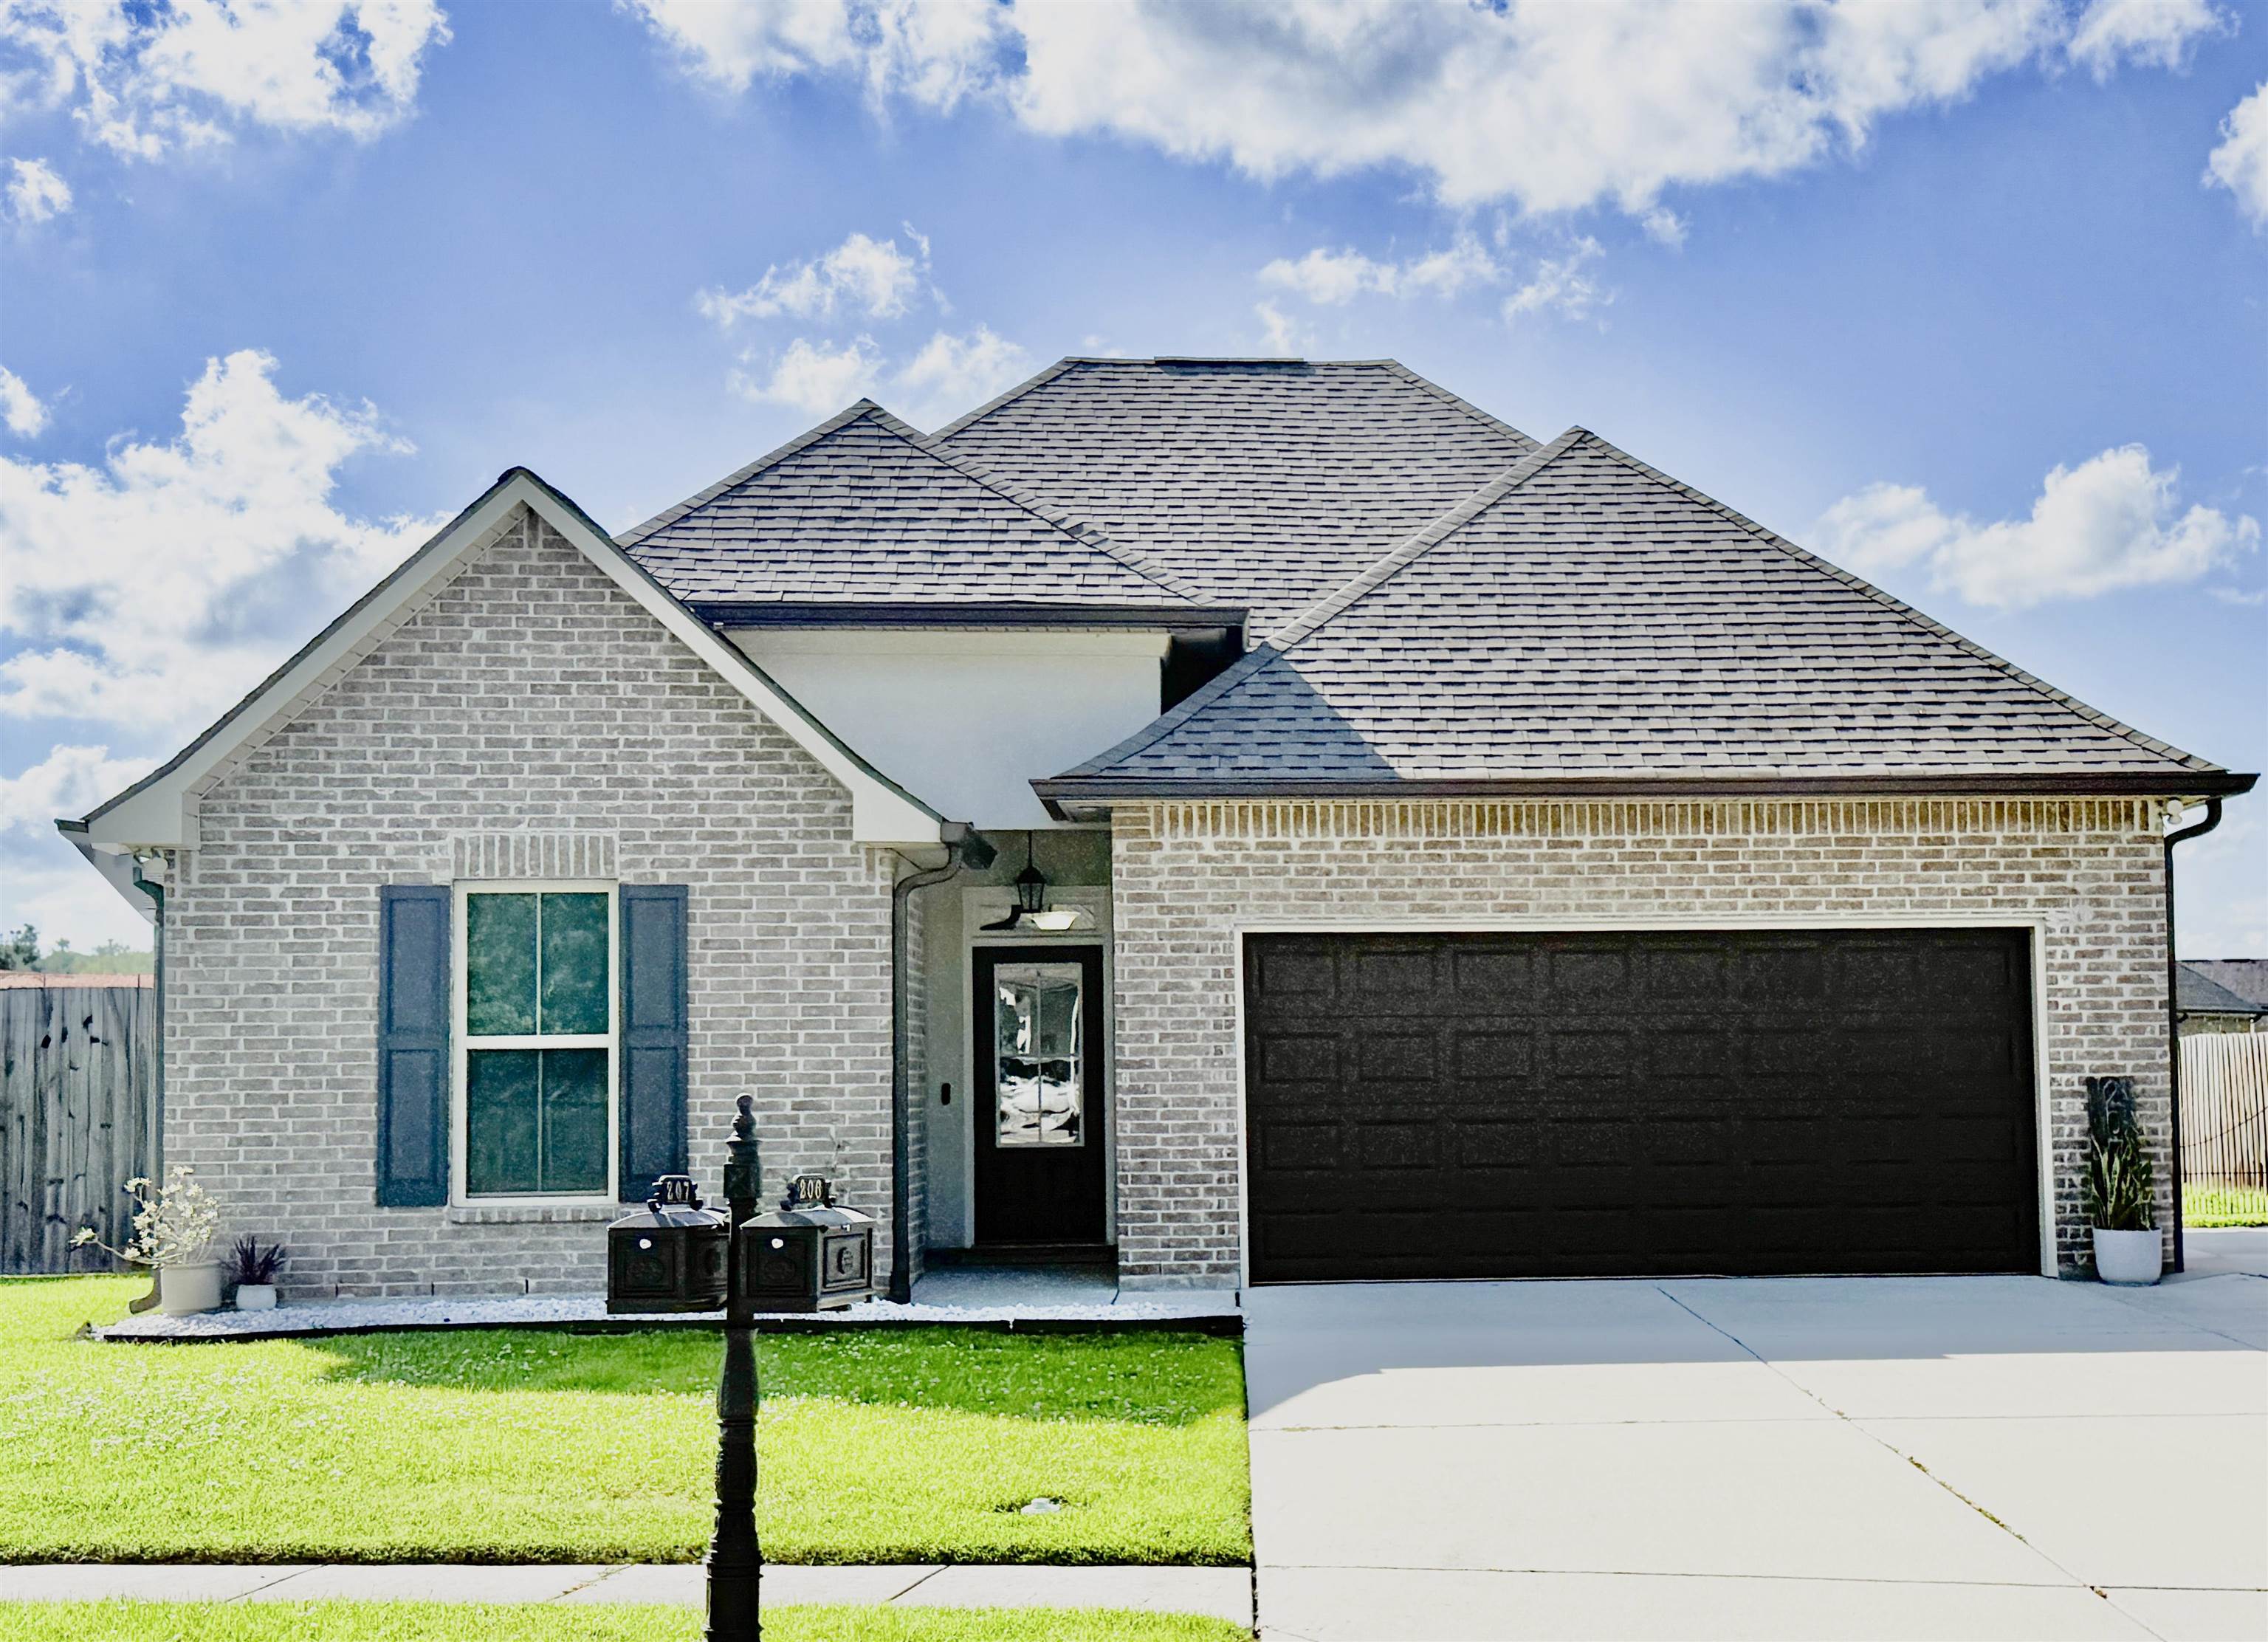
Active
$440,000
4
bds
|
3
ba
|
2,451
sqft
|
built
2020
207 Madio Dr, Houma, LA 70364
$-564
Cash flow
-6.7%
Cash-on-Cash Return
4.1%
Cap rate
0.5%
Rent to Value Ratio

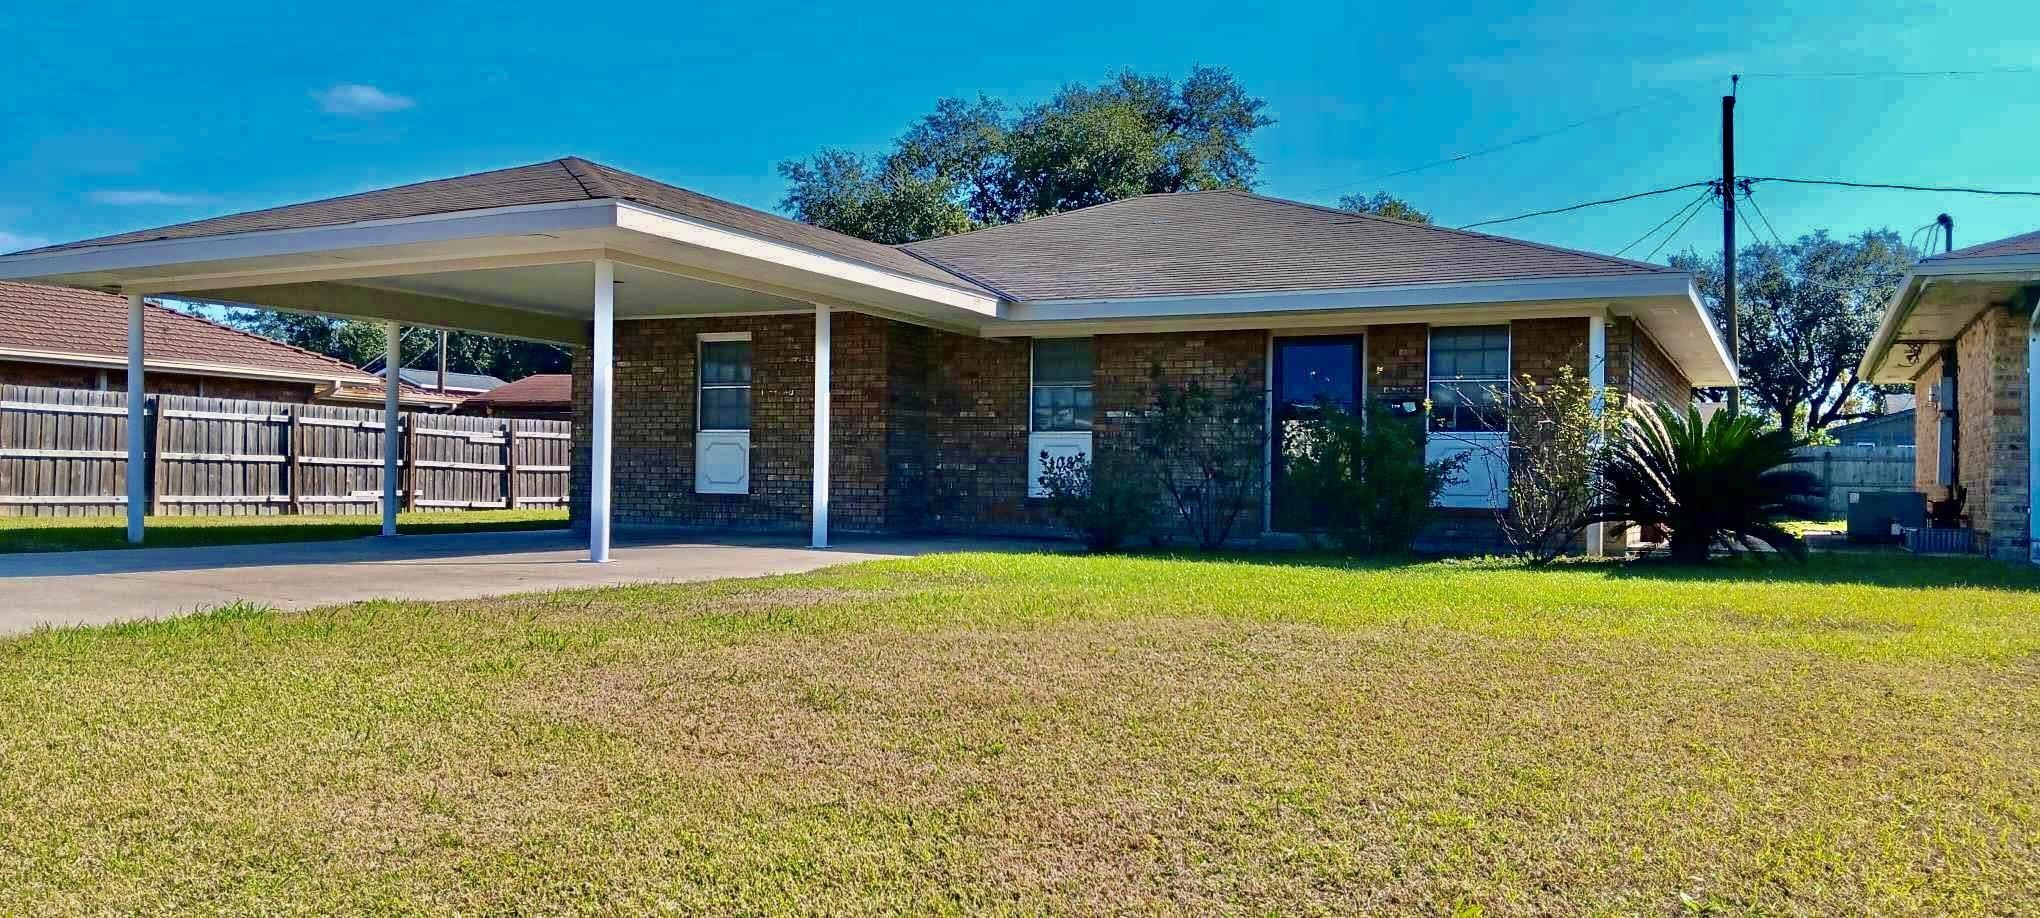
Active
$165,000
4
bds
|
3
ba
|
2,033
sqft
|
built
1973
514 Gaynell Dr, Houma, LA 70364
$323
Cash flow
10.2%
Cash-on-Cash Return
8.0%
Cap rate
1.0%
Rent to Value Ratio
Active
$215,000
3
bds
|
2
ba
|
1,262
sqft
|
built
2005
231 J Patrick Dr, Houma, LA 70364
$-51
Cash flow
-1.2%
Cash-on-Cash Return
5.4%
Cap rate
0.7%
Rent to Value Ratio
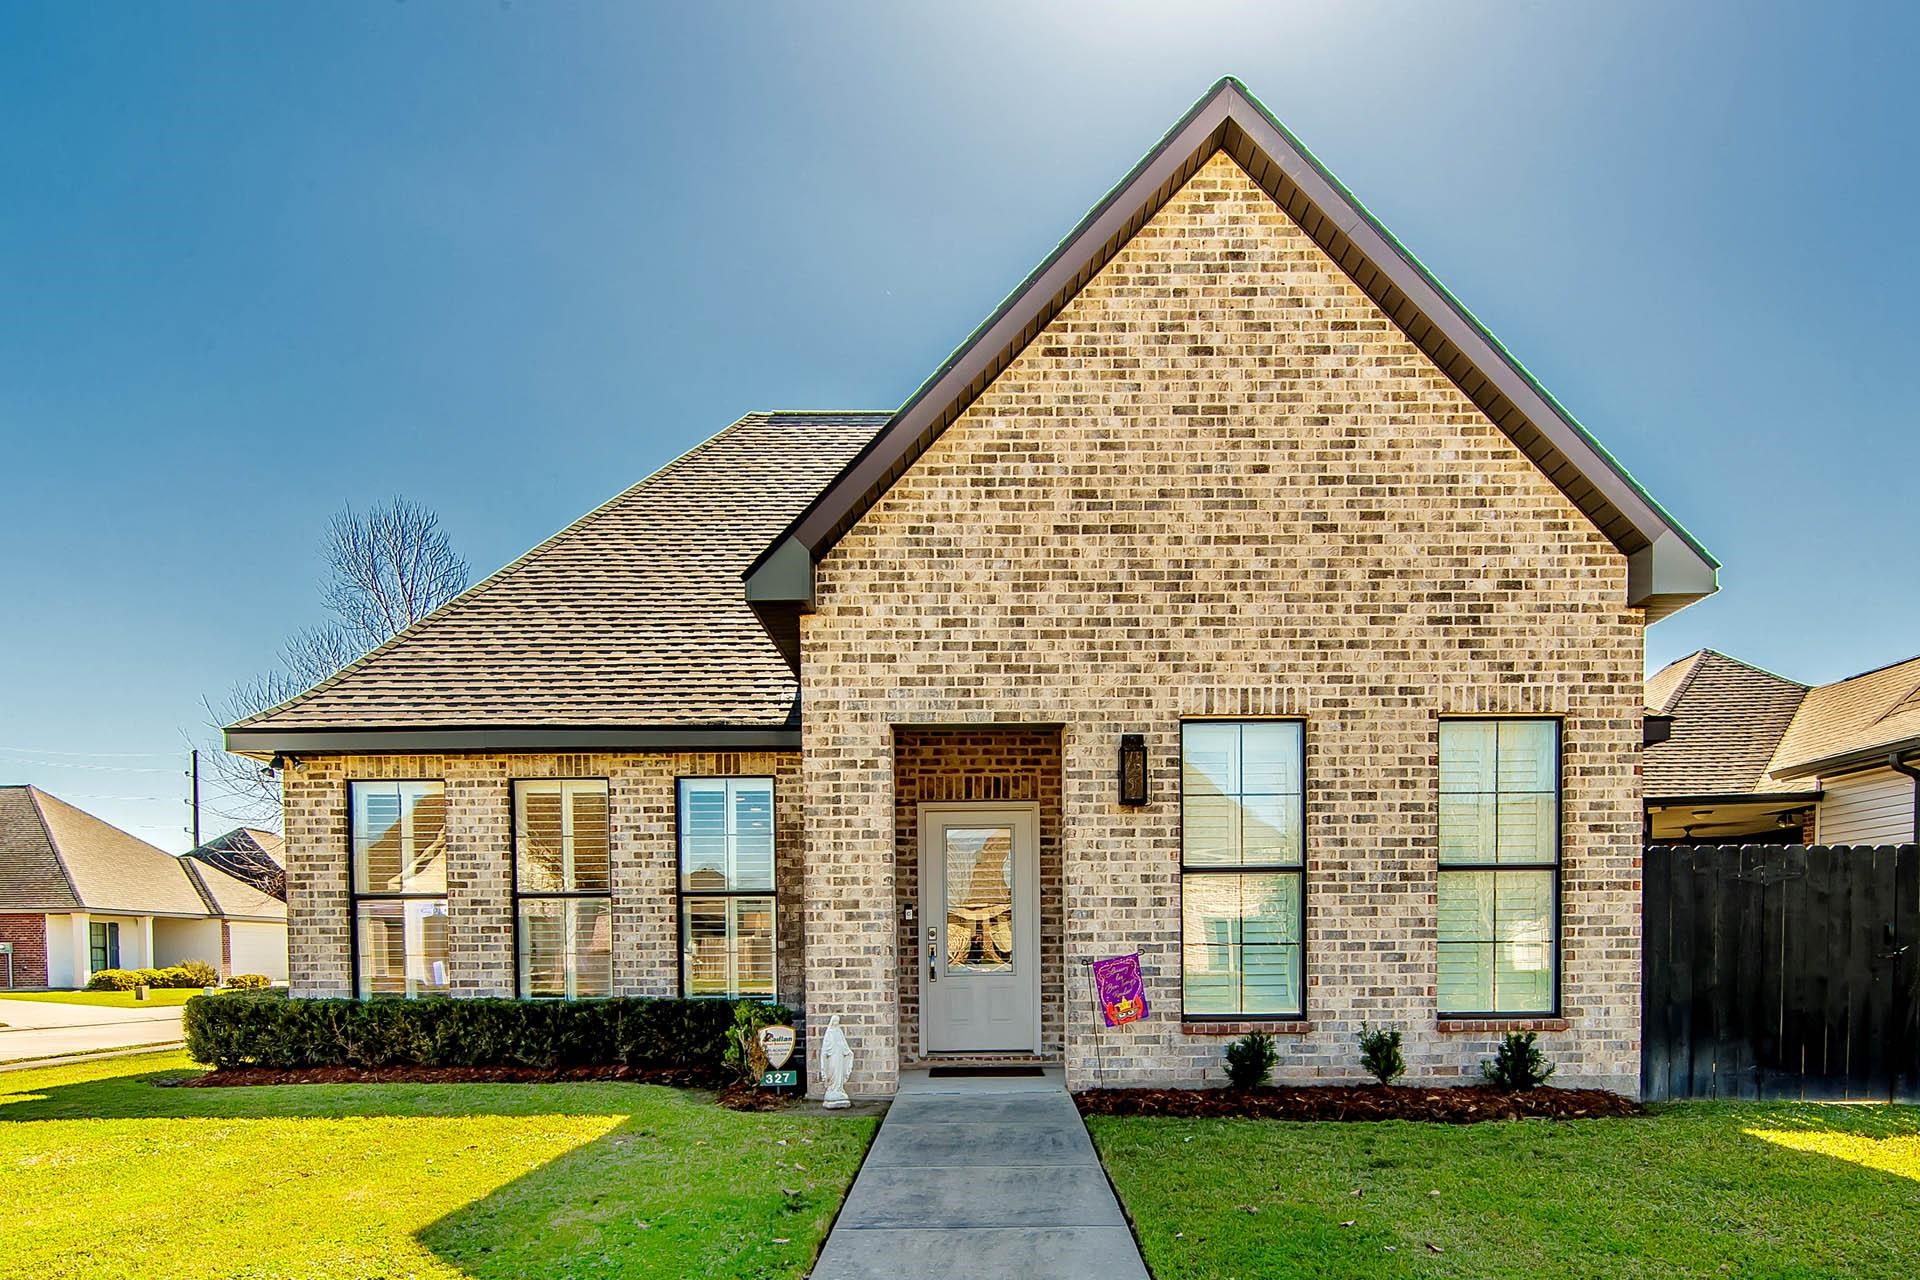
Active
$342,500
3
bds
|
2
ba
|
1,801
sqft
|
built
2015
327 Shelby Claire Dr, Houma, LA 70360
$-241
Cash flow
-3.7%
Cash-on-Cash Return
4.8%
Cap rate
0.6%
Rent to Value Ratio
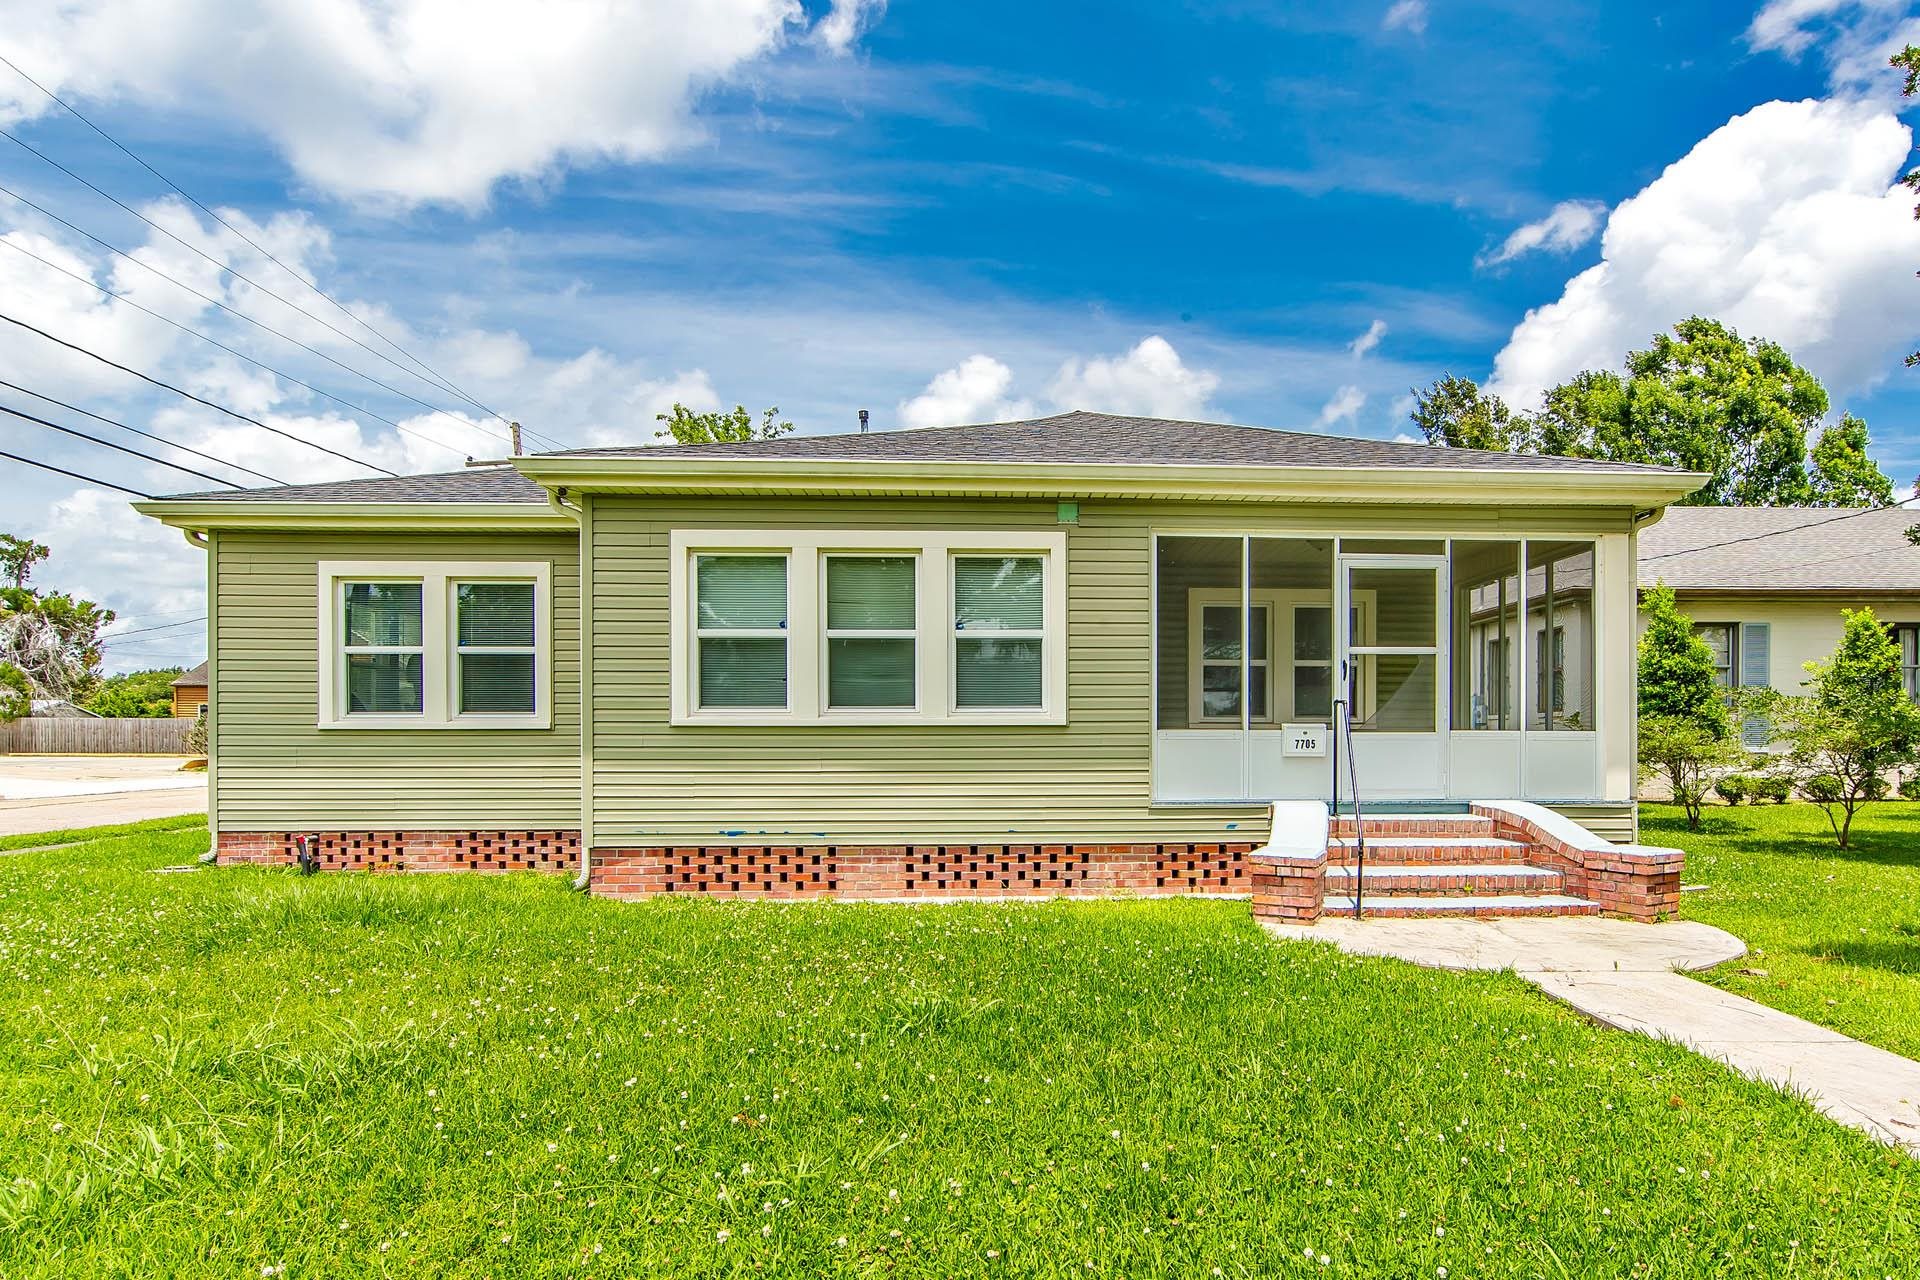
Active
$245,000
3
bds
|
2
ba
|
2,194
sqft
|
built
1956
7705 Park Ave, Houma, LA 70364
$-193
Cash flow
-4.1%
Cash-on-Cash Return
4.7%
Cap rate
0.6%
Rent to Value Ratio