Houma, LA Investment Properties for Sale
Browse homes for sale and investment properties in Houma, LA. Refine your search by price, property type, or more.
Best cash flowing properties in Houma, LA
Active
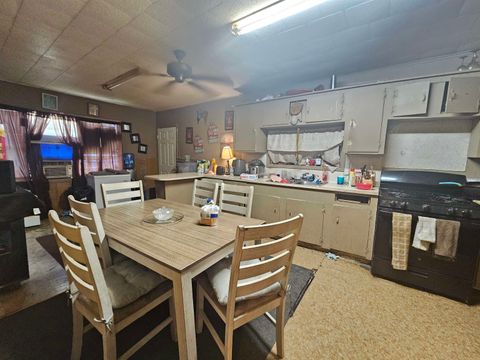
$45,000
3
bds
|
1
ba
|
1,168
sqft
|
built
1934
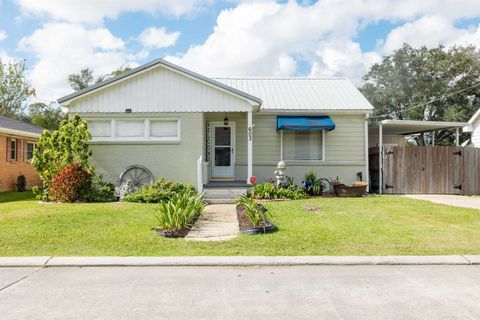
531 Beaumont St, Houma, LA 70360
$897
Cash flow
23.2%
Cash-on-Cash Return
23.9%
Cap rate
2.9%
Rent to Value Ratio

Active
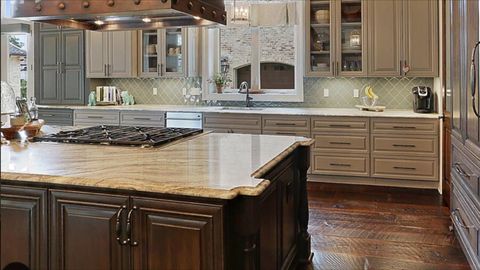
$68,000
2
bds
|
2
ba
|
906
sqft
|
built
1963
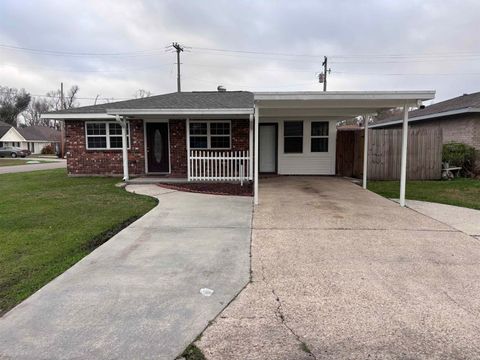
119 Brittany St, Houma, LA 70363
$690
Cash flow
11.8%
Cash-on-Cash Return
12.2%
Cap rate
1.5%
Rent to Value Ratio
308 out of 361 properties for sale in Houma, LA
Limited Results Shown
Create a free account, or log in to reveal all property listings and enjoy the complete experience.
Active
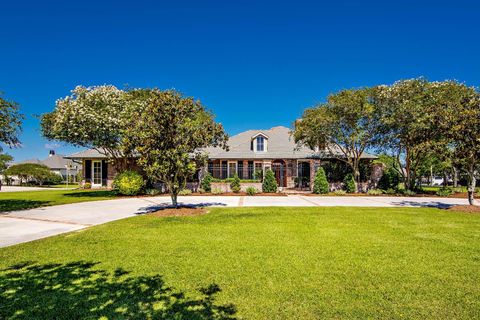
$3,400,000
4
bds
|
7
ba
|
8,841
sqft
|
built
2014
1 Glen Oaks Dr, Houma, LA 70360
$-14,448
Cash flow
-22.2%
Cash-on-Cash Return
0.6%
Cap rate
0.1%
Rent to Value Ratio

Active
$445,000
4
bds
|
2
ba
|
2,347
sqft
|
built
2008
316 Brentwood Dr, Houma, LA 70360
$-726
Cash flow
-8.5%
Cash-on-Cash Return
3.7%
Cap rate
0.4%
Rent to Value Ratio

Active
$440,000
4
bds
|
3
ba
|
2,451
sqft
|
built
2020
207 Madio Dr, Houma, LA 70364
$-564
Cash flow
-6.7%
Cash-on-Cash Return
4.1%
Cap rate
0.5%
Rent to Value Ratio

Active
$599,900
4
bds
|
4
ba
|
3,306
sqft
|
built
1997
21 Richland Row, Houma, LA 70360
$-1,321
Cash flow
-11.5%
Cash-on-Cash Return
3.0%
Cap rate
0.4%
Rent to Value Ratio

Active
$164,900
3
bds
|
2
ba
|
1,092
sqft
|
built
2008
820 Cottagemill Ln, Houma, LA 70363
$186
Cash flow
5.9%
Cash-on-Cash Return
7.0%
Cap rate
0.8%
Rent to Value Ratio
Active
$1,199,500
4
bds
|
6
ba
|
3,850
sqft
|
built
2006
114 Bocage Dr, Houma, LA 70360
$-2,378
Cash flow
-10.3%
Cash-on-Cash Return
3.3%
Cap rate
0.4%
Rent to Value Ratio
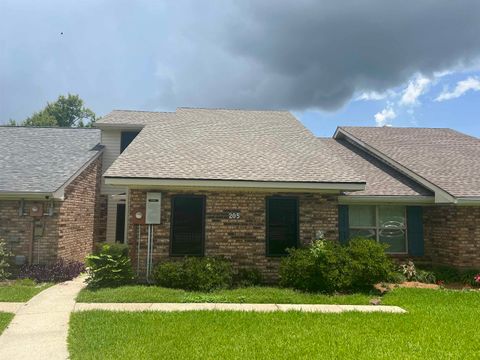
Active
$199,900
3
bds
|
3
ba
|
1,564
sqft
|
built
1984
205 S French Quarter Dr, Houma, LA 70364
$20
Cash flow
0.5%
Cash-on-Cash Return
5.8%
Cap rate
0.7%
Rent to Value Ratio

Active
$379,000
4
bds
|
3
ba
|
2,509
sqft
|
built
2010
310 Lakewood Dr, Houma, LA 70360
$138
Cash flow
1.9%
Cash-on-Cash Return
6.1%
Cap rate
0.7%
Rent to Value Ratio

Active
$190,000
3
bds
|
2
ba
|
1,867
sqft
|
built
1964
212 Everette Dr, Houma, LA 70364
$67
Cash flow
1.8%
Cash-on-Cash Return
6.1%
Cap rate
0.7%
Rent to Value Ratio
Active
$649,900
3
bds
|
4
ba
|
2,371
sqft
|
built
2010
256 Tulip Dr, Houma, LA 70360
$-1,558
Cash flow
-12.5%
Cash-on-Cash Return
2.8%
Cap rate
0.3%
Rent to Value Ratio
Active
$330,000
4
bds
|
3
ba
|
1,863
sqft
|
built
2009
155 Camille St, Houma, LA 70360
$-182
Cash flow
-2.9%
Cash-on-Cash Return
5.0%
Cap rate
0.6%
Rent to Value Ratio

Active
$285,000
3
bds
|
3
ba
|
3,342
sqft
|
built
1974
9704 E Park Ave, Houma, LA 70363
$-245
Cash flow
-4.5%
Cash-on-Cash Return
4.6%
Cap rate
0.6%
Rent to Value Ratio
Active
$599,000
4
bds
|
4
ba
|
3,228
sqft
|
built
1980
9766 E Park Ave, Houma, LA 70363
$-1,731
Cash flow
-15.1%
Cash-on-Cash Return
2.2%
Cap rate
0.3%
Rent to Value Ratio
Active
$128,900
4
bds
|
2
ba
|
1,665
sqft
|
built
1965
222 Sterling Dr, Houma, LA 70363
$356
Cash flow
14.4%
Cash-on-Cash Return
9.0%
Cap rate
1.1%
Rent to Value Ratio
Active
$219,000
3
bds
|
2
ba
|
1,571
sqft
|
built
1996
301 Prevost Dr, Houma, LA 70364
$68
Cash flow
1.6%
Cash-on-Cash Return
6.0%
Cap rate
0.7%
Rent to Value Ratio
Active
$199,000
2
bds
|
2
ba
|
1,812
sqft
|
built
1999
526 S French Quarter Dr, Houma, LA 70364
$300
Cash flow
7.9%
Cash-on-Cash Return
7.5%
Cap rate
0.9%
Rent to Value Ratio

Active
$94,050
3
bds
|
2
ba
|
1,508
sqft
|
built
1978
231 Jean Ellen Ave, Houma, LA 70363
$314
Cash flow
17.4%
Cash-on-Cash Return
9.7%
Cap rate
1.2%
Rent to Value Ratio
Active
$595,000
3
bds
|
3
ba
|
2,237
sqft
|
built
2002
605 Hollygrove Ave, Houma, LA 70360
$-1,436
Cash flow
-12.6%
Cash-on-Cash Return
2.8%
Cap rate
0.3%
Rent to Value Ratio

Active
$179,000
3
bds
|
2
ba
|
1,050
sqft
|
built
1979
311 Saint Patrick St, Houma, LA 70364
$119
Cash flow
3.5%
Cash-on-Cash Return
6.5%
Cap rate
0.8%
Rent to Value Ratio
Active
$405,000
4
bds
|
3
ba
|
2,480
sqft
|
built
2007
273 Brentwood Dr, Houma, LA 70360
$-468
Cash flow
-6.0%
Cash-on-Cash Return
4.3%
Cap rate
0.5%
Rent to Value Ratio

Active
$164,900
2
bds
|
2
ba
|
1,061
sqft
|
built
1977
247 Mc Kinley St, Houma, LA 70364
$117
Cash flow
3.7%
Cash-on-Cash Return
6.5%
Cap rate
0.8%
Rent to Value Ratio

Active
$92,000
2
bds
|
1
ba
|
1,348
sqft
|
built
1960
7331 Park Ave, Houma, LA 70364
$531
Cash flow
30.1%
Cash-on-Cash Return
12.6%
Cap rate
1.5%
Rent to Value Ratio

Active
$330,000
4
bds
|
2
ba
|
2,271
sqft
|
built
1985
318 Estate Dr, Houma, LA 70364
$25
Cash flow
0.4%
Cash-on-Cash Return
5.8%
Cap rate
0.7%
Rent to Value Ratio

Active
$189,900
3
bds
|
2
ba
|
2,200
sqft
|
built
1964
904 Broadmoor Ave, Houma, LA 70364
$205
Cash flow
5.6%
Cash-on-Cash Return
7.0%
Cap rate
0.8%
Rent to Value Ratio
Active
$149,500
3
bds
|
2
ba
|
1,413
sqft
|
built
1950
1300 Honduras St, Houma, LA 70360
$259
Cash flow
9.0%
Cash-on-Cash Return
7.8%
Cap rate
0.9%
Rent to Value Ratio
Active
$68,000
2
bds
|
2
ba
|
906
sqft
|
built
1963
119 Brittany St, Houma, LA 70363
$690
Cash flow
11.8%
Cash-on-Cash Return
12.2%
Cap rate
1.5%
Rent to Value Ratio
Active
$45,000
3
bds
|
1
ba
|
1,168
sqft
|
built
1934
531 Beaumont St, Houma, LA 70360
$897
Cash flow
23.2%
Cash-on-Cash Return
23.9%
Cap rate
2.9%
Rent to Value Ratio
Active
$220,000
3
bds
|
2
ba
|
2,009
sqft
|
built
1973
2006 Ray Dr, Houma, LA 70363
$-6
Cash flow
-0.1%
Cash-on-Cash Return
5.6%
Cap rate
0.7%
Rent to Value Ratio
Active
$750,000
4
bds
|
4
ba
|
4,182
sqft
|
built
1973
3902 Southdown Mandalay Rd, Houma, LA 70360
$-1,962
Cash flow
-13.6%
Cash-on-Cash Return
2.5%
Cap rate
0.3%
Rent to Value Ratio
Active
$458,900
4
bds
|
3
ba
|
2,544
sqft
|
built
1994
206 Arapaho Dr, Houma, LA 70360
$-654
Cash flow
-7.4%
Cash-on-Cash Return
4.0%
Cap rate
0.5%
Rent to Value Ratio

Active
$294,000
4
bds
|
4
ba
|
2,787
sqft
|
built
1936
1716 Daspit St, Houma, LA 70360
$472
Cash flow
8.4%
Cash-on-Cash Return
7.6%
Cap rate
0.9%
Rent to Value Ratio
Active
$625,000
6
bds
|
4
ba
|
5,604
sqft
|
built
1984
120 Whitfield Ct, Houma, LA 70360
$-1,854
Cash flow
-15.5%
Cash-on-Cash Return
2.1%
Cap rate
0.3%
Rent to Value Ratio
Active
$179,900
3
bds
|
2
ba
|
1,520
sqft
|
built
1972
328 Saint Francis St, Houma, LA 70364
$115
Cash flow
3.3%
Cash-on-Cash Return
6.4%
Cap rate
0.8%
Rent to Value Ratio

Active
$195,900
4
bds
|
2
ba
|
1,377
sqft
|
built
1969
410 Harding Dr, Houma, LA 70364
$39
Cash flow
1.0%
Cash-on-Cash Return
5.9%
Cap rate
0.7%
Rent to Value Ratio

Active
$355,000
4
bds
|
3
ba
|
2,372
sqft
|
built
2023
331 Modesto Drive, Houma, LA 70364
$0
Cash flow
n/a
Cash-on-Cash Return
n/a
Cap rate
n/a
Rent to Value Ratio

Active
$199,000
3
bds
|
2
ba
|
1,331
sqft
|
built
1997
1991 Saint Louis Canal Rd, Houma, LA 70364
$24
Cash flow
0.6%
Cash-on-Cash Return
5.8%
Cap rate
0.7%
Rent to Value Ratio
Active
$119,000
3
bds
|
2
ba
|
1,767
sqft
|
built
1983
12 Fernwood Dr, Houma, LA 70364
$403
Cash flow
17.7%
Cash-on-Cash Return
9.7%
Cap rate
1.2%
Rent to Value Ratio

Active
$350,000
4
bds
|
3
ba
|
3,224
sqft
|
built
1979
505 Corpus Christi Dr, Houma, LA 70360
$-138
Cash flow
-2.1%
Cash-on-Cash Return
5.2%
Cap rate
0.6%
Rent to Value Ratio

Active
$313,000
4
bds
|
3
ba
|
3,298
sqft
|
built
1965
104 Grenes St, Houma, LA 70363
$37
Cash flow
0.6%
Cash-on-Cash Return
5.8%
Cap rate
0.7%
Rent to Value Ratio
Active
$155,000
3
bds
|
2
ba
|
1,494
sqft
|
built
1960
603 Wilson Ave, Houma, LA 70364
$370
Cash flow
12.5%
Cash-on-Cash Return
8.5%
Cap rate
1.0%
Rent to Value Ratio