Houma, LA Investment Properties for Sale
Browse homes for sale and investment properties in Houma, LA. Refine your search by price, property type, or more.
Best cash flowing properties in Houma, LA
Active
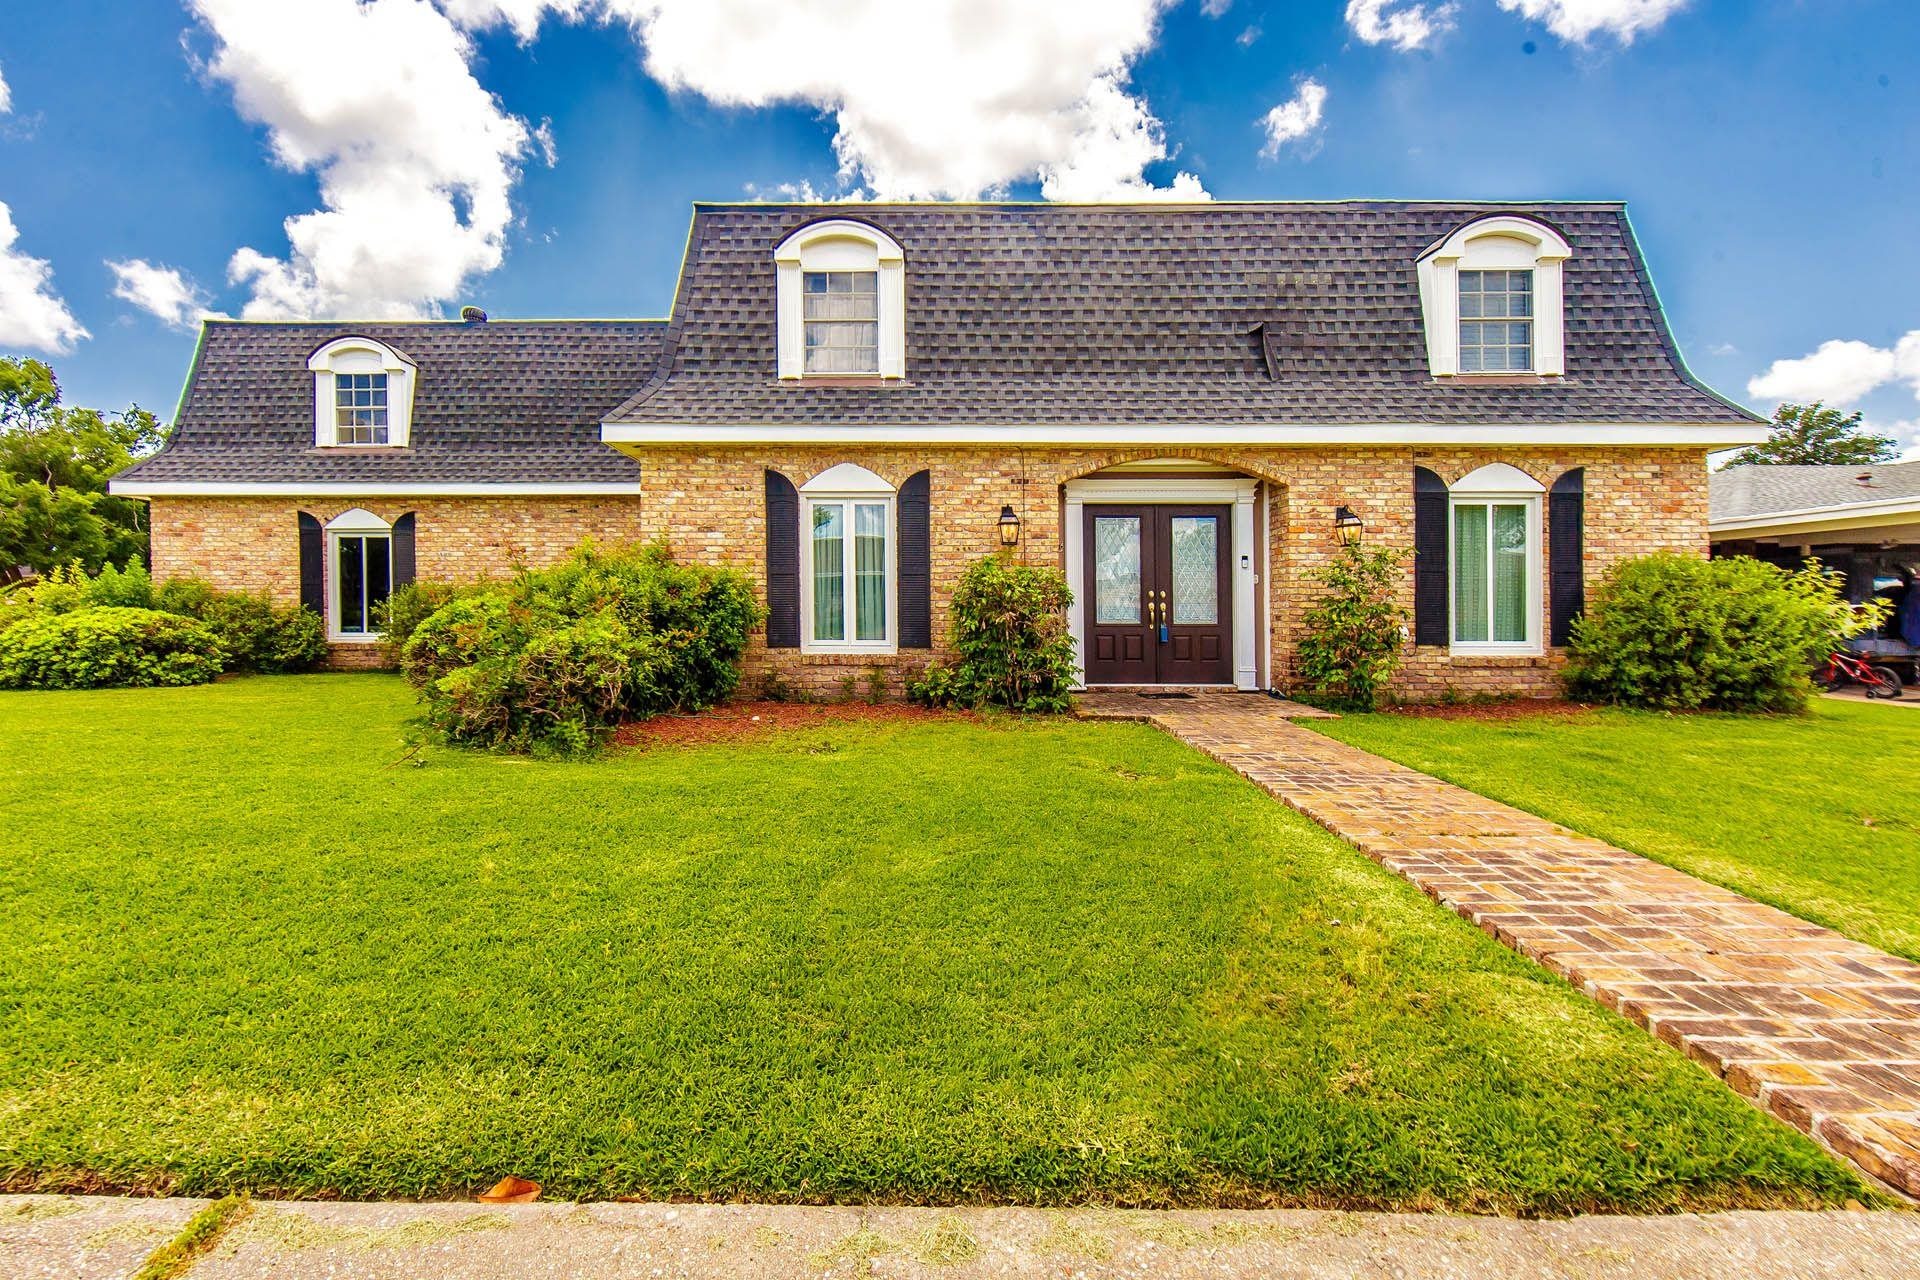
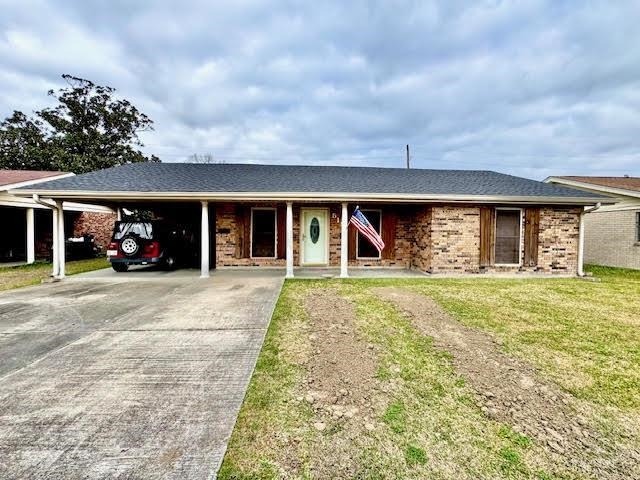
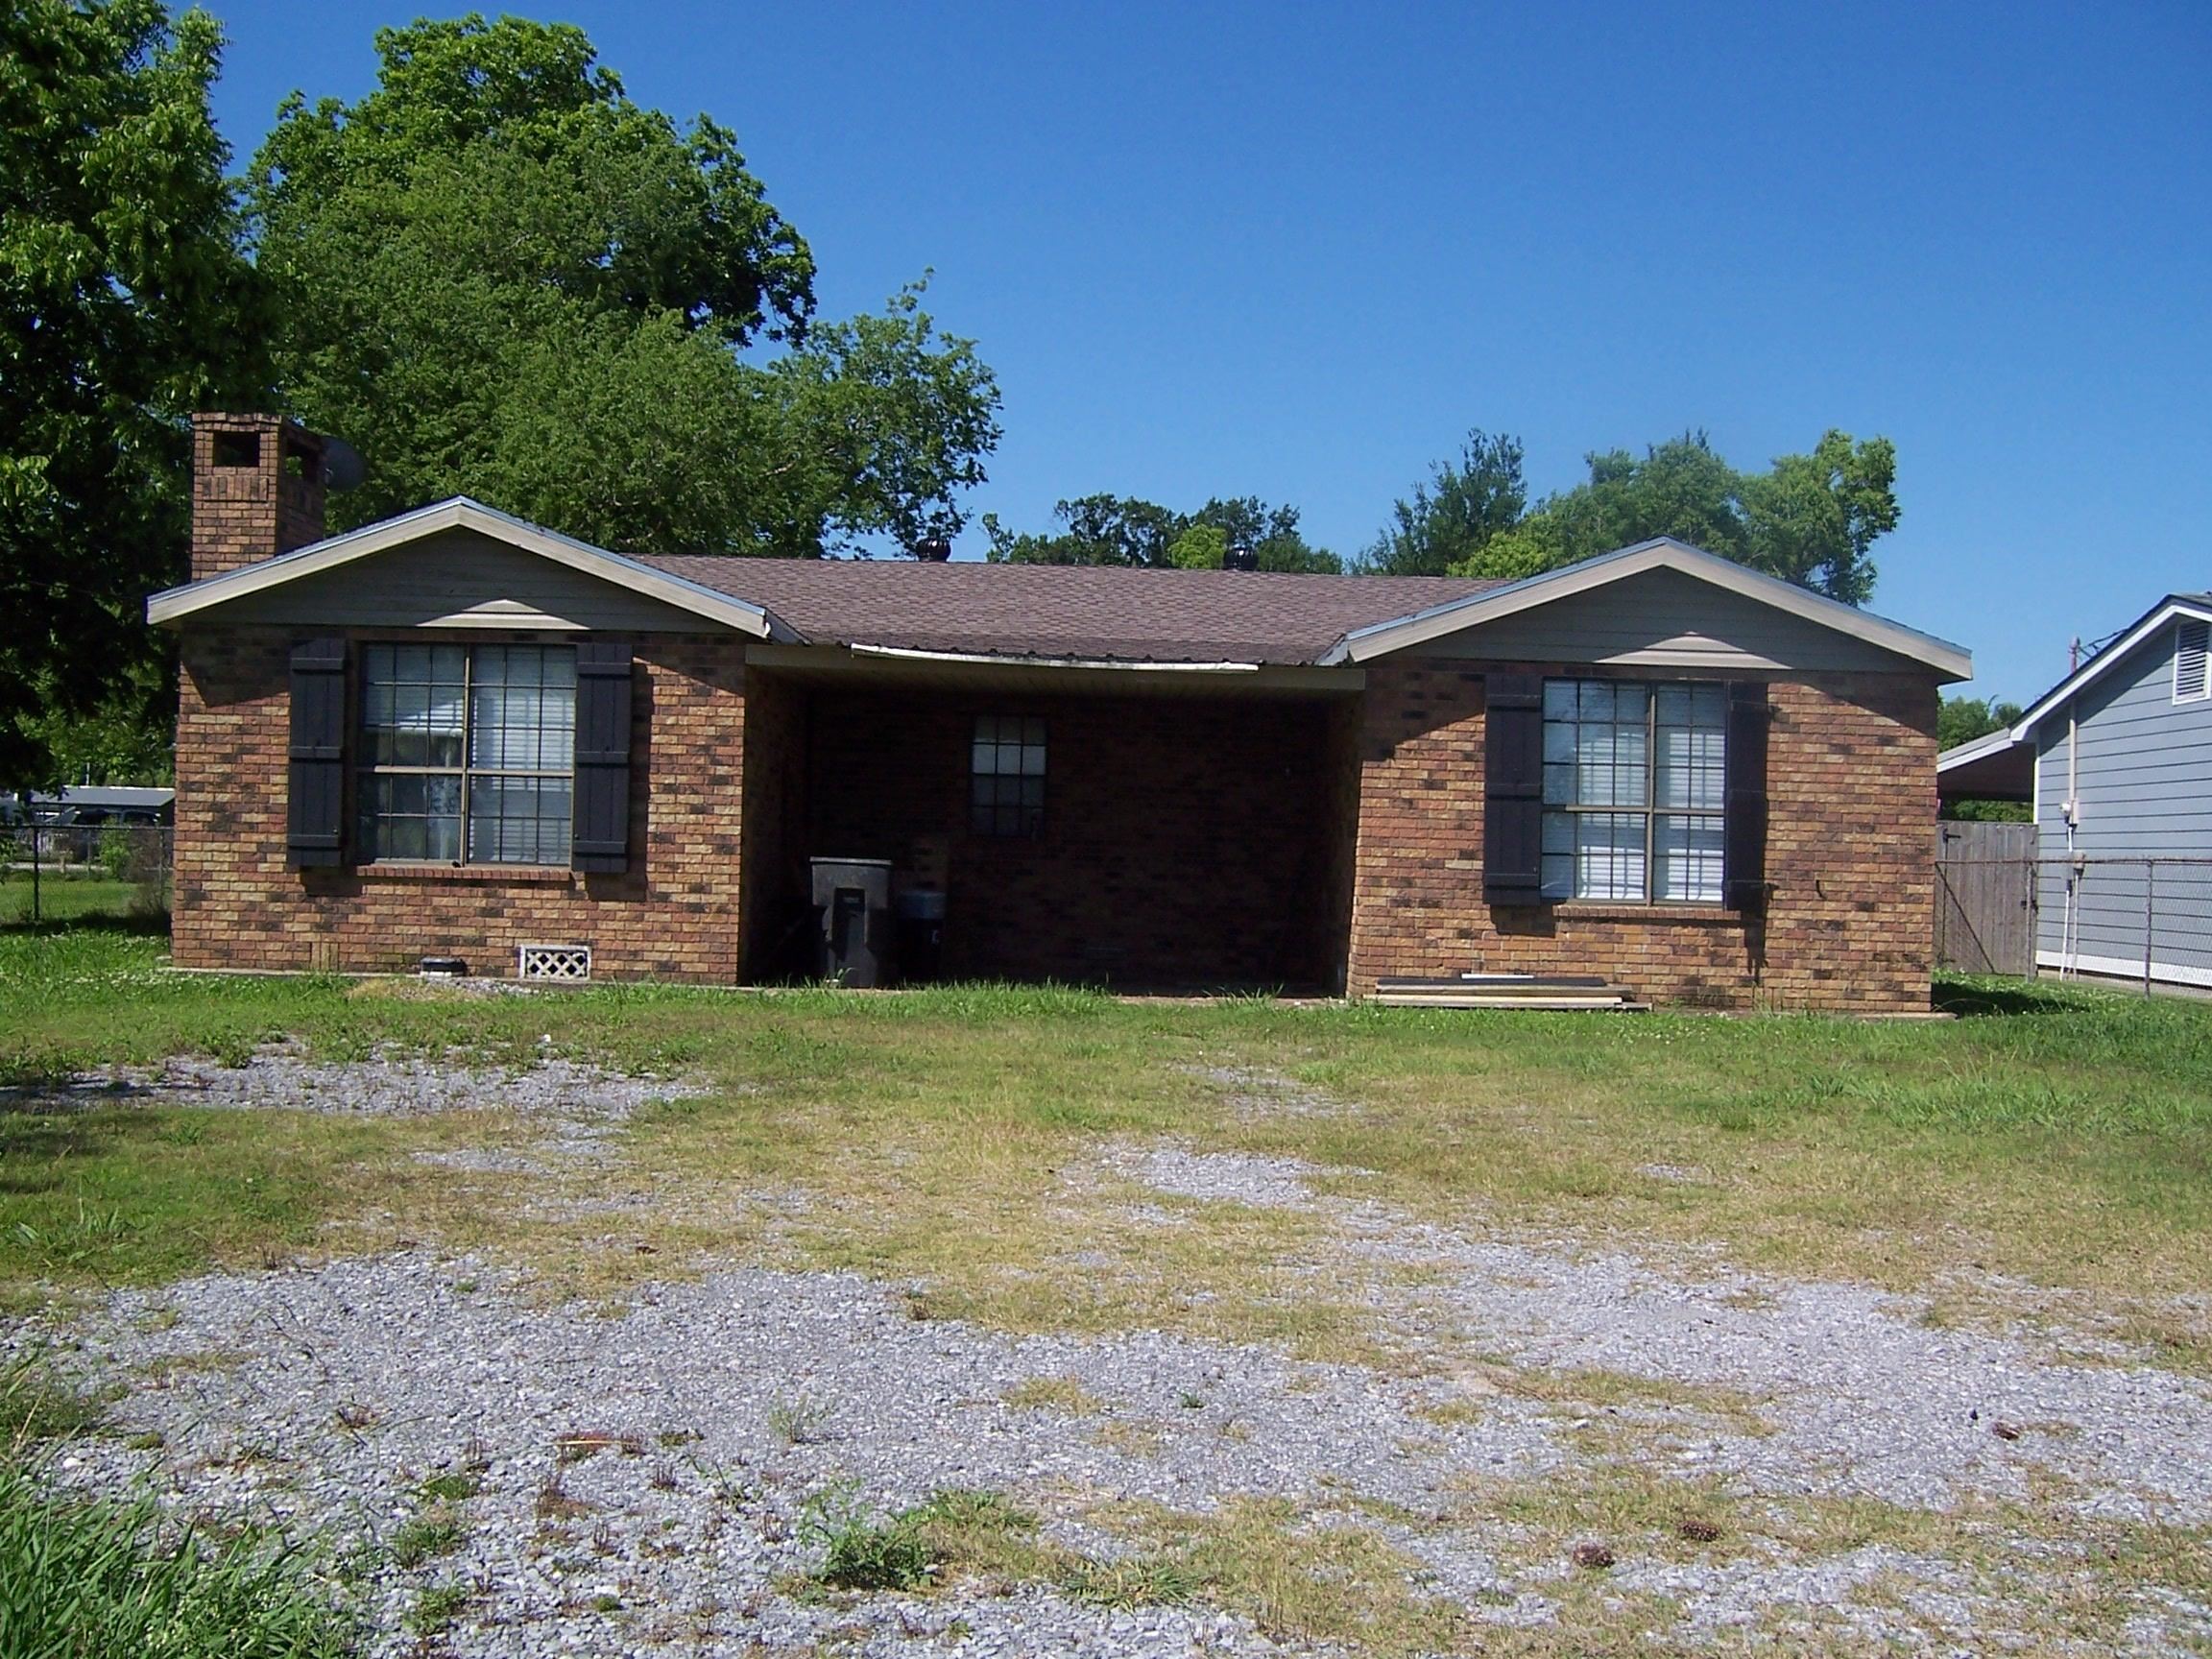
$60,000
3
bds
|
2
ba
|
2,200
sqft
|
built
1975
5477 W Main St, Houma, LA 70360
$966
Cash flow
18.8%
Cash-on-Cash Return
19.3%
Cap rate
2.3%
Rent to Value Ratio
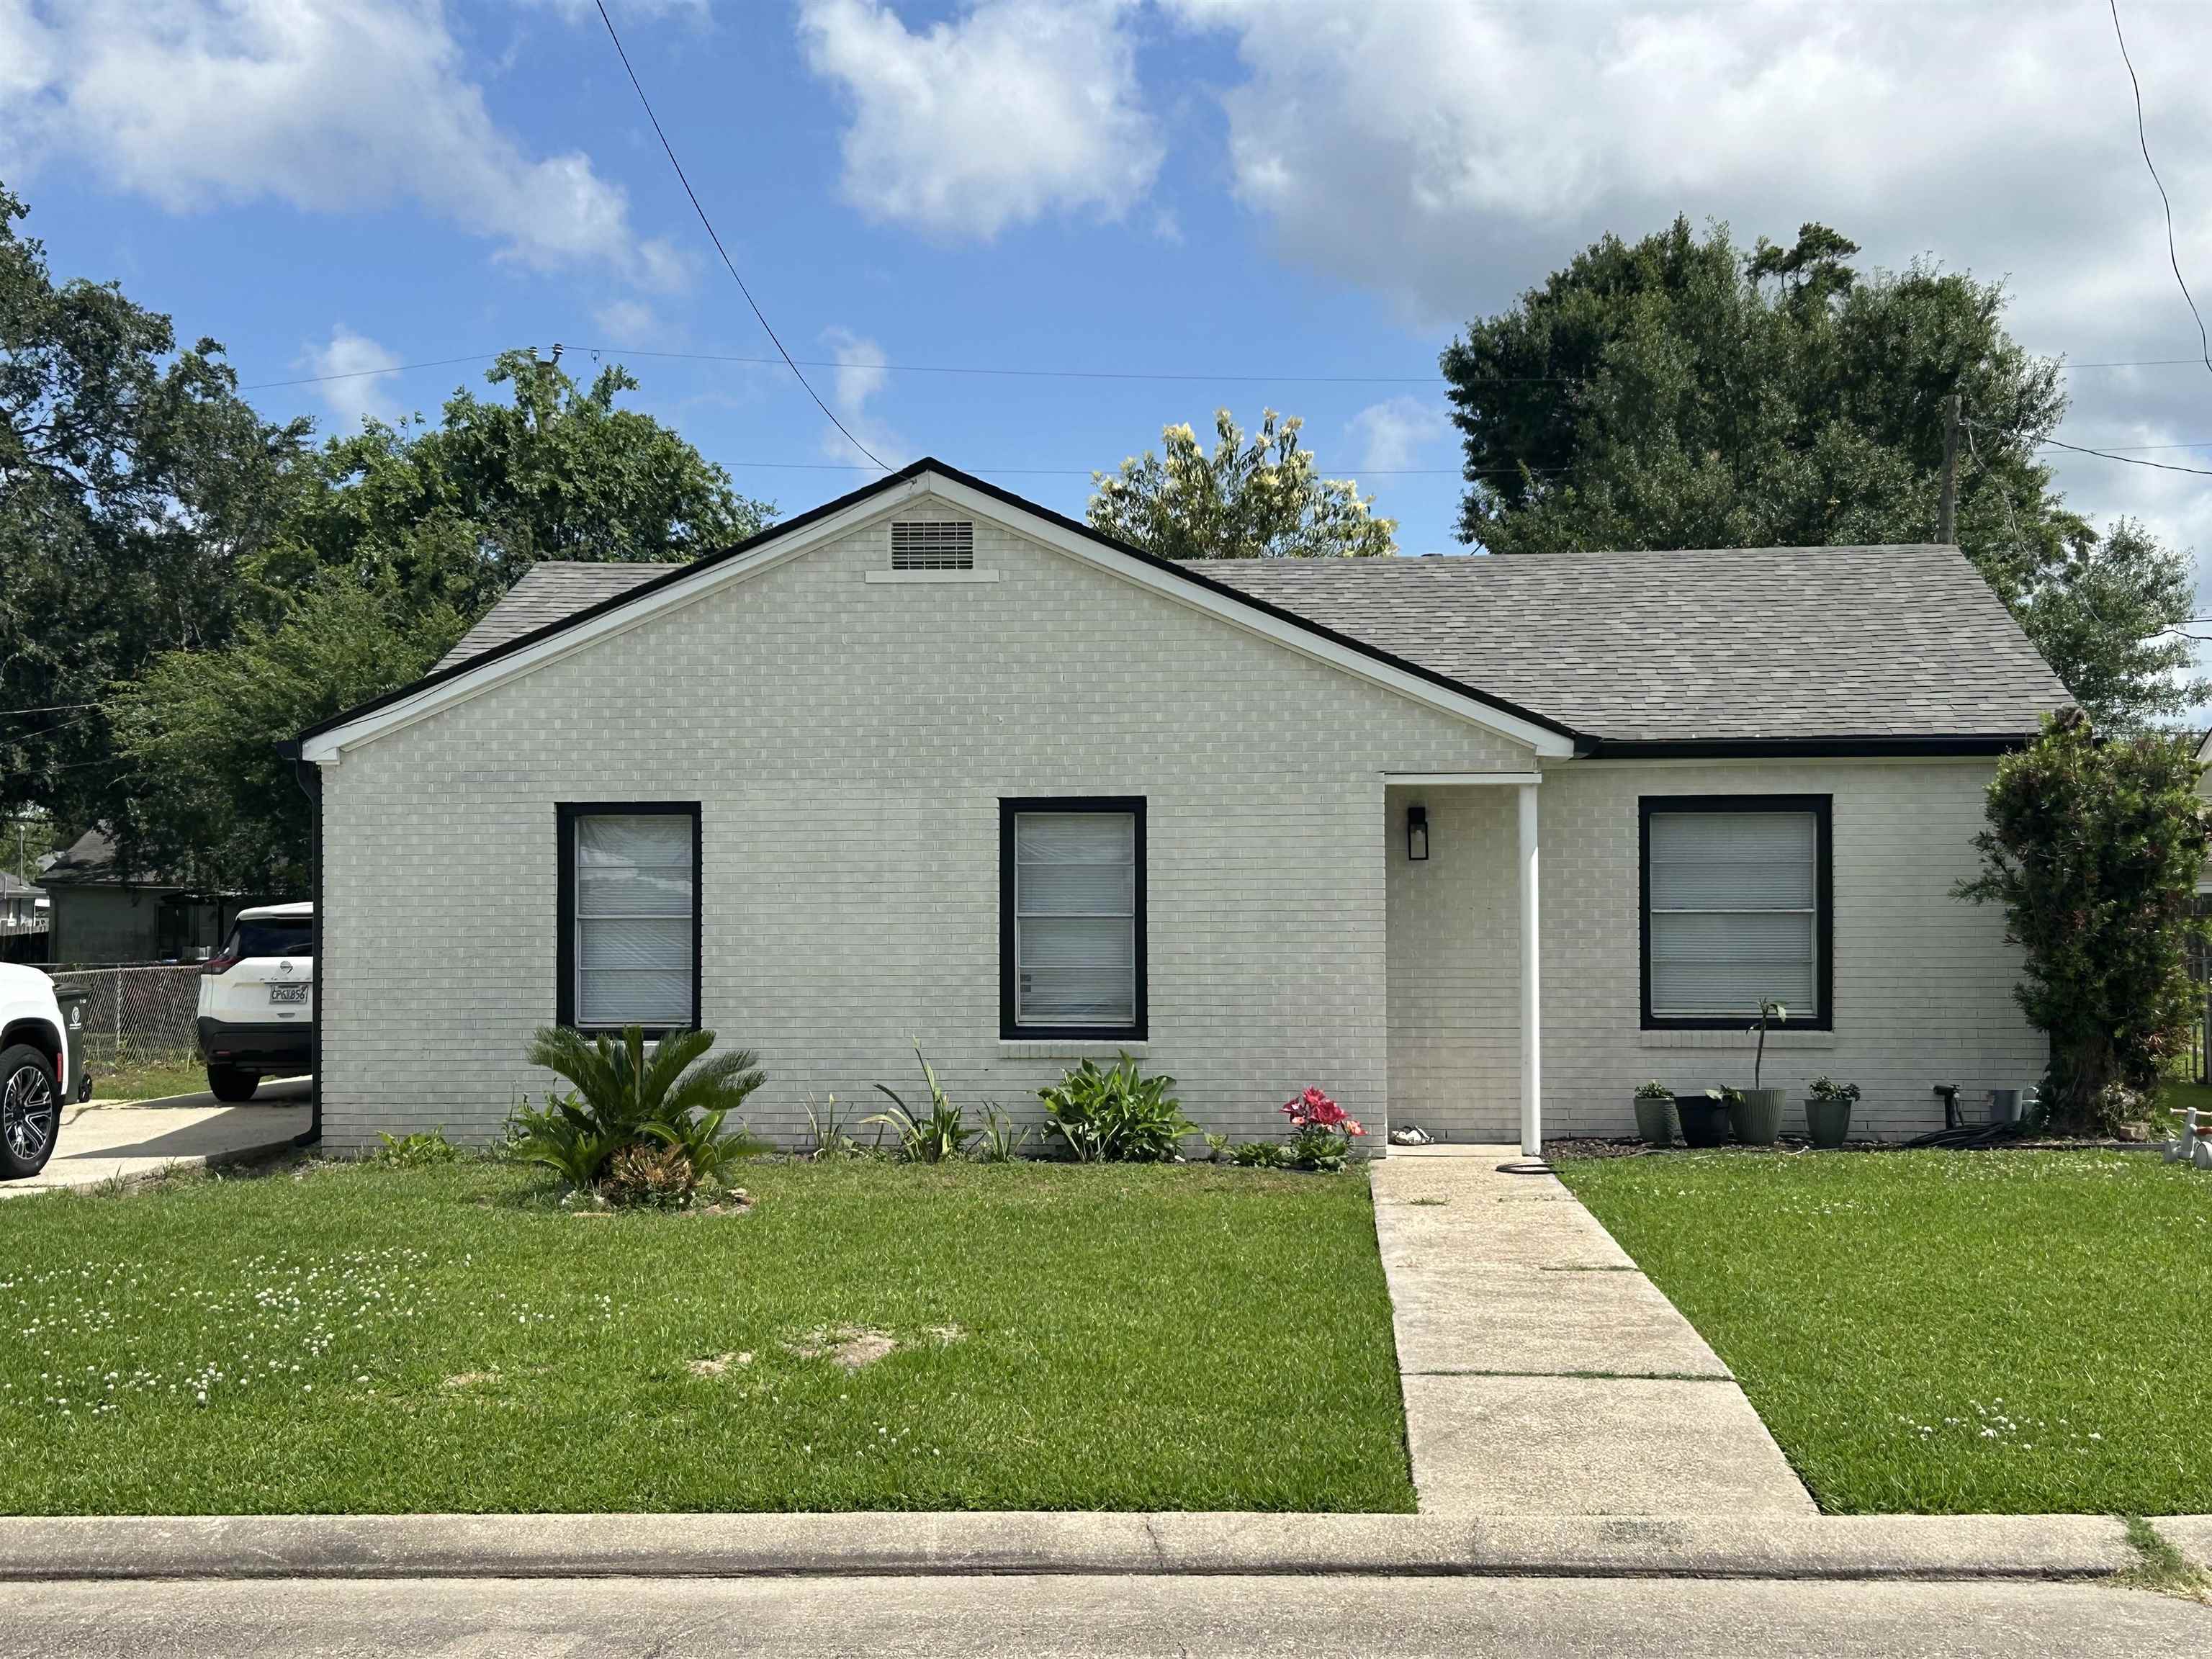
Active
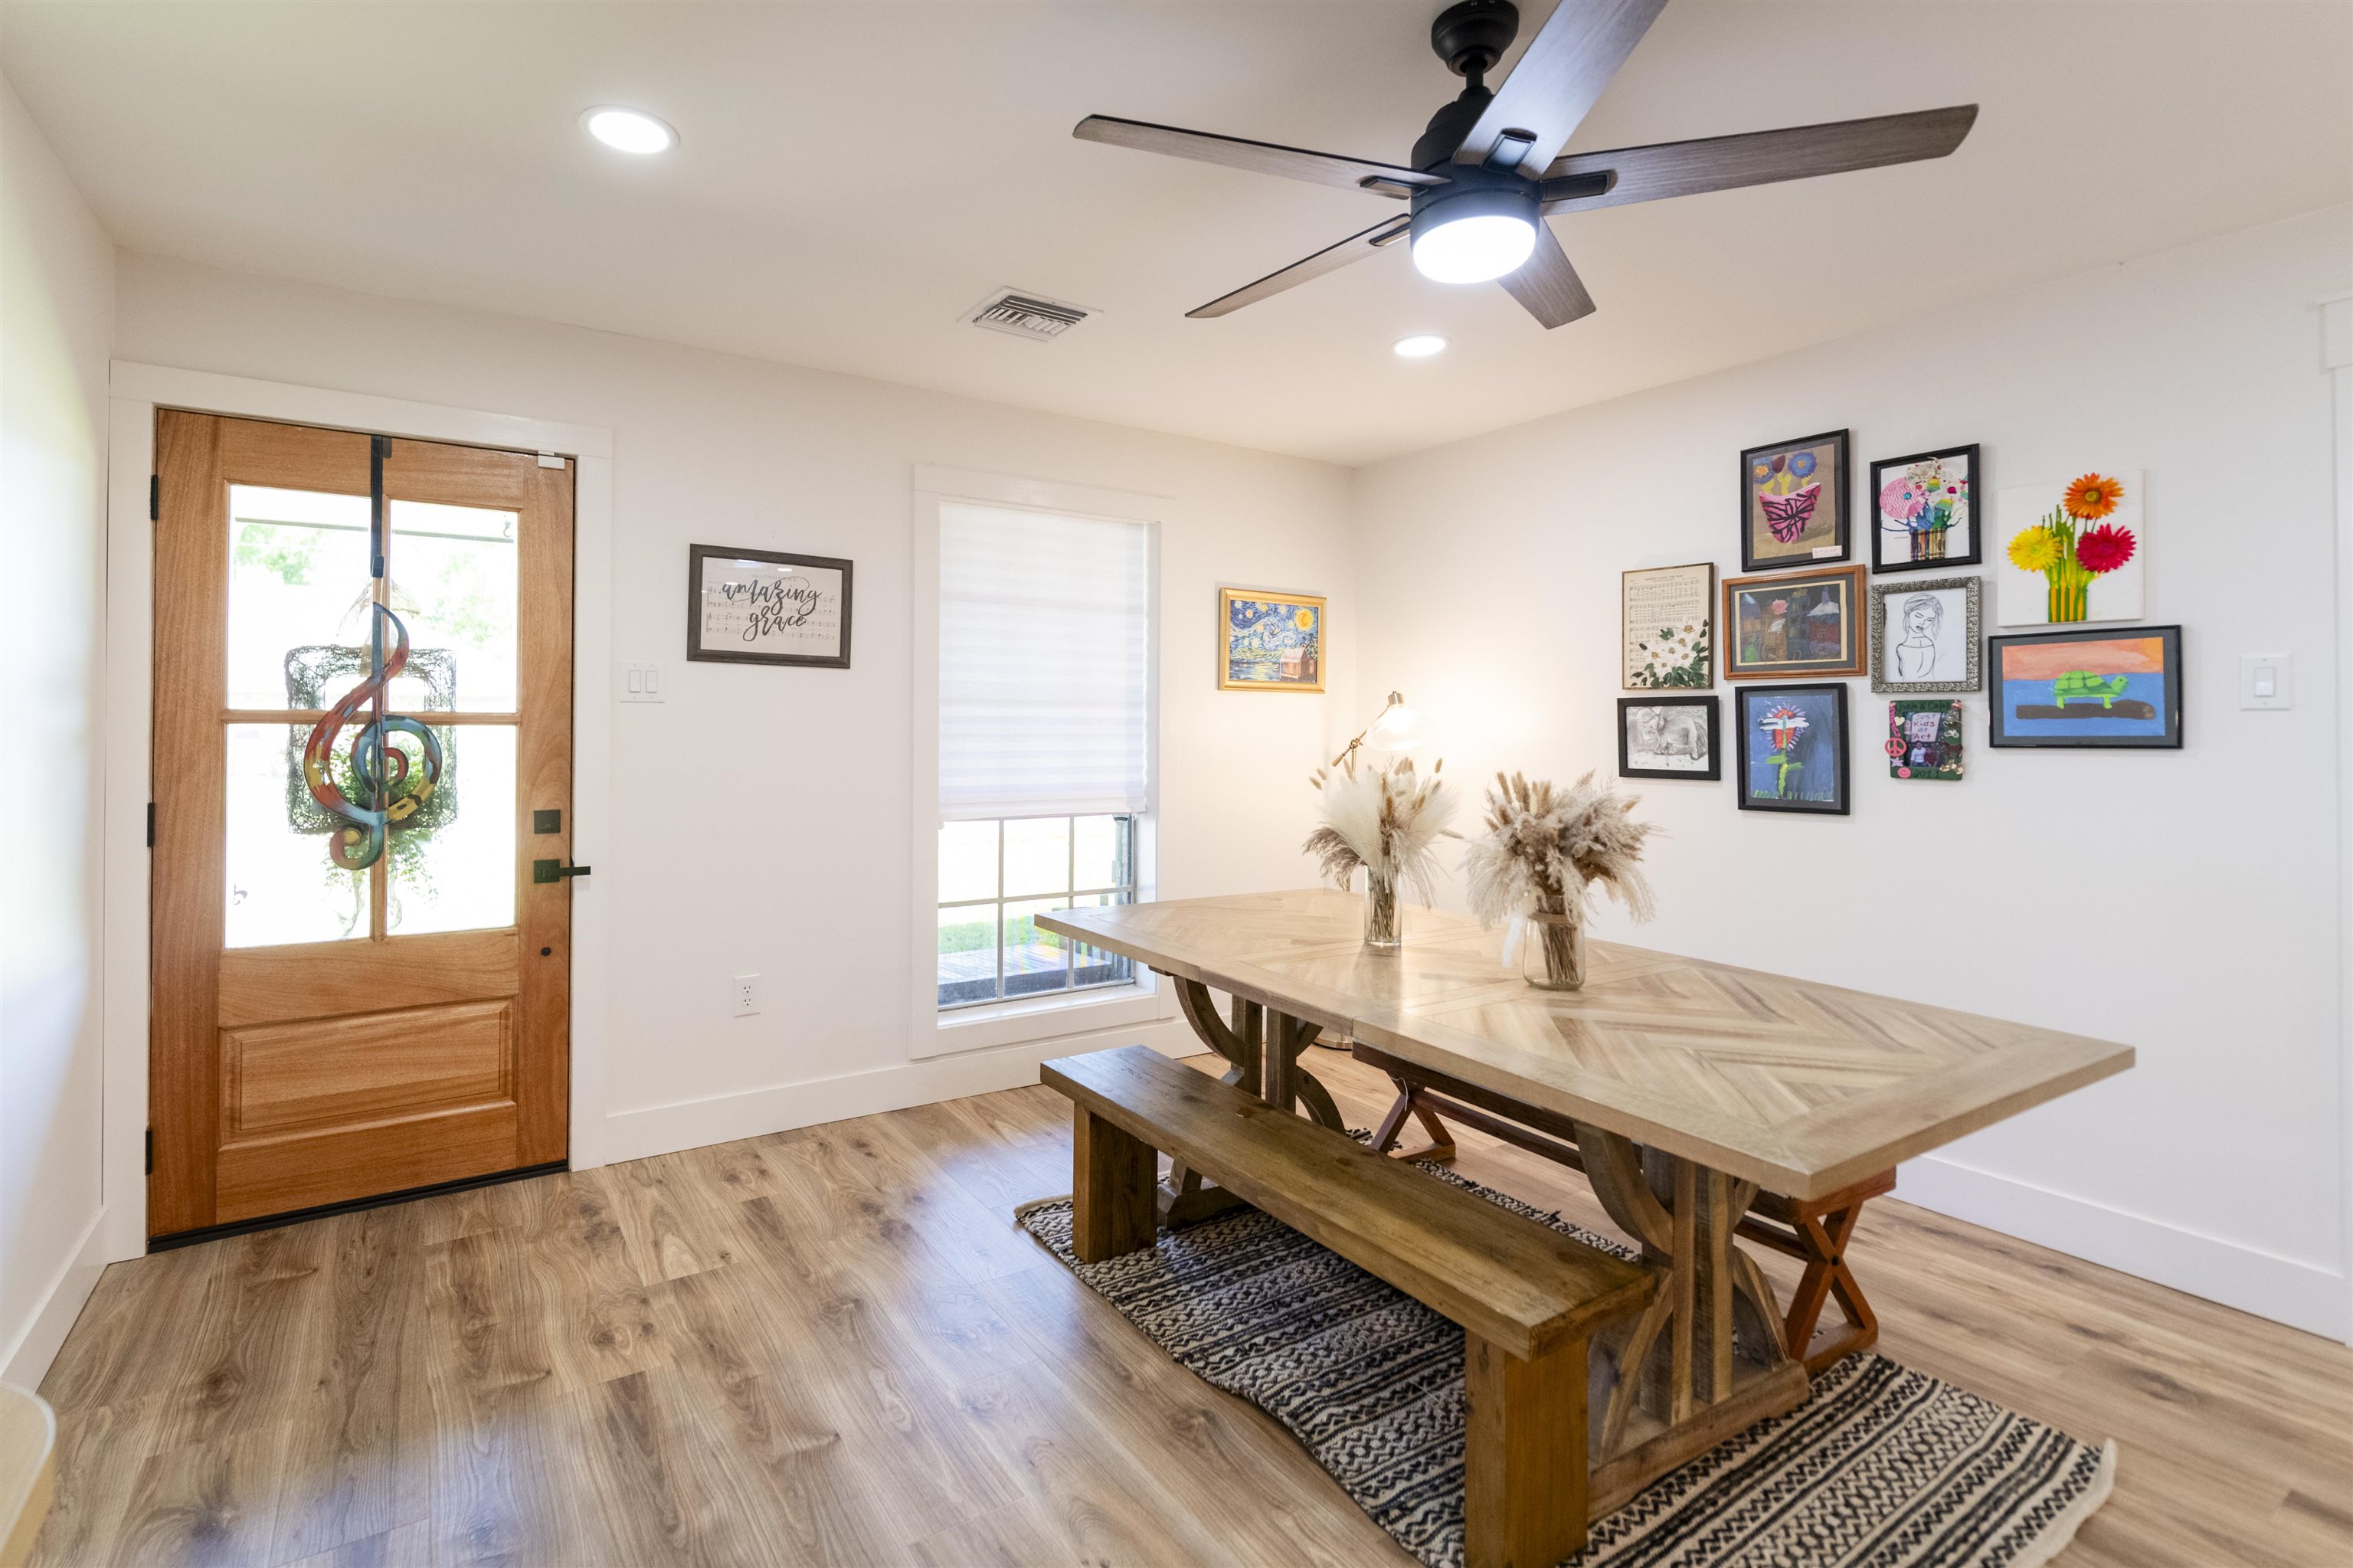
$55,000
2
bds
|
1
ba
|
943
sqft
|
built
1953
5489 W Main St, Houma, LA 70360
$897
Cash flow
19.0%
Cash-on-Cash Return
19.6%
Cap rate
2.4%
Rent to Value Ratio
315 out of 342 properties for sale in Houma, LA
Limited Results Shown
Create a free account, or log in to reveal all property listings and enjoy the complete experience.
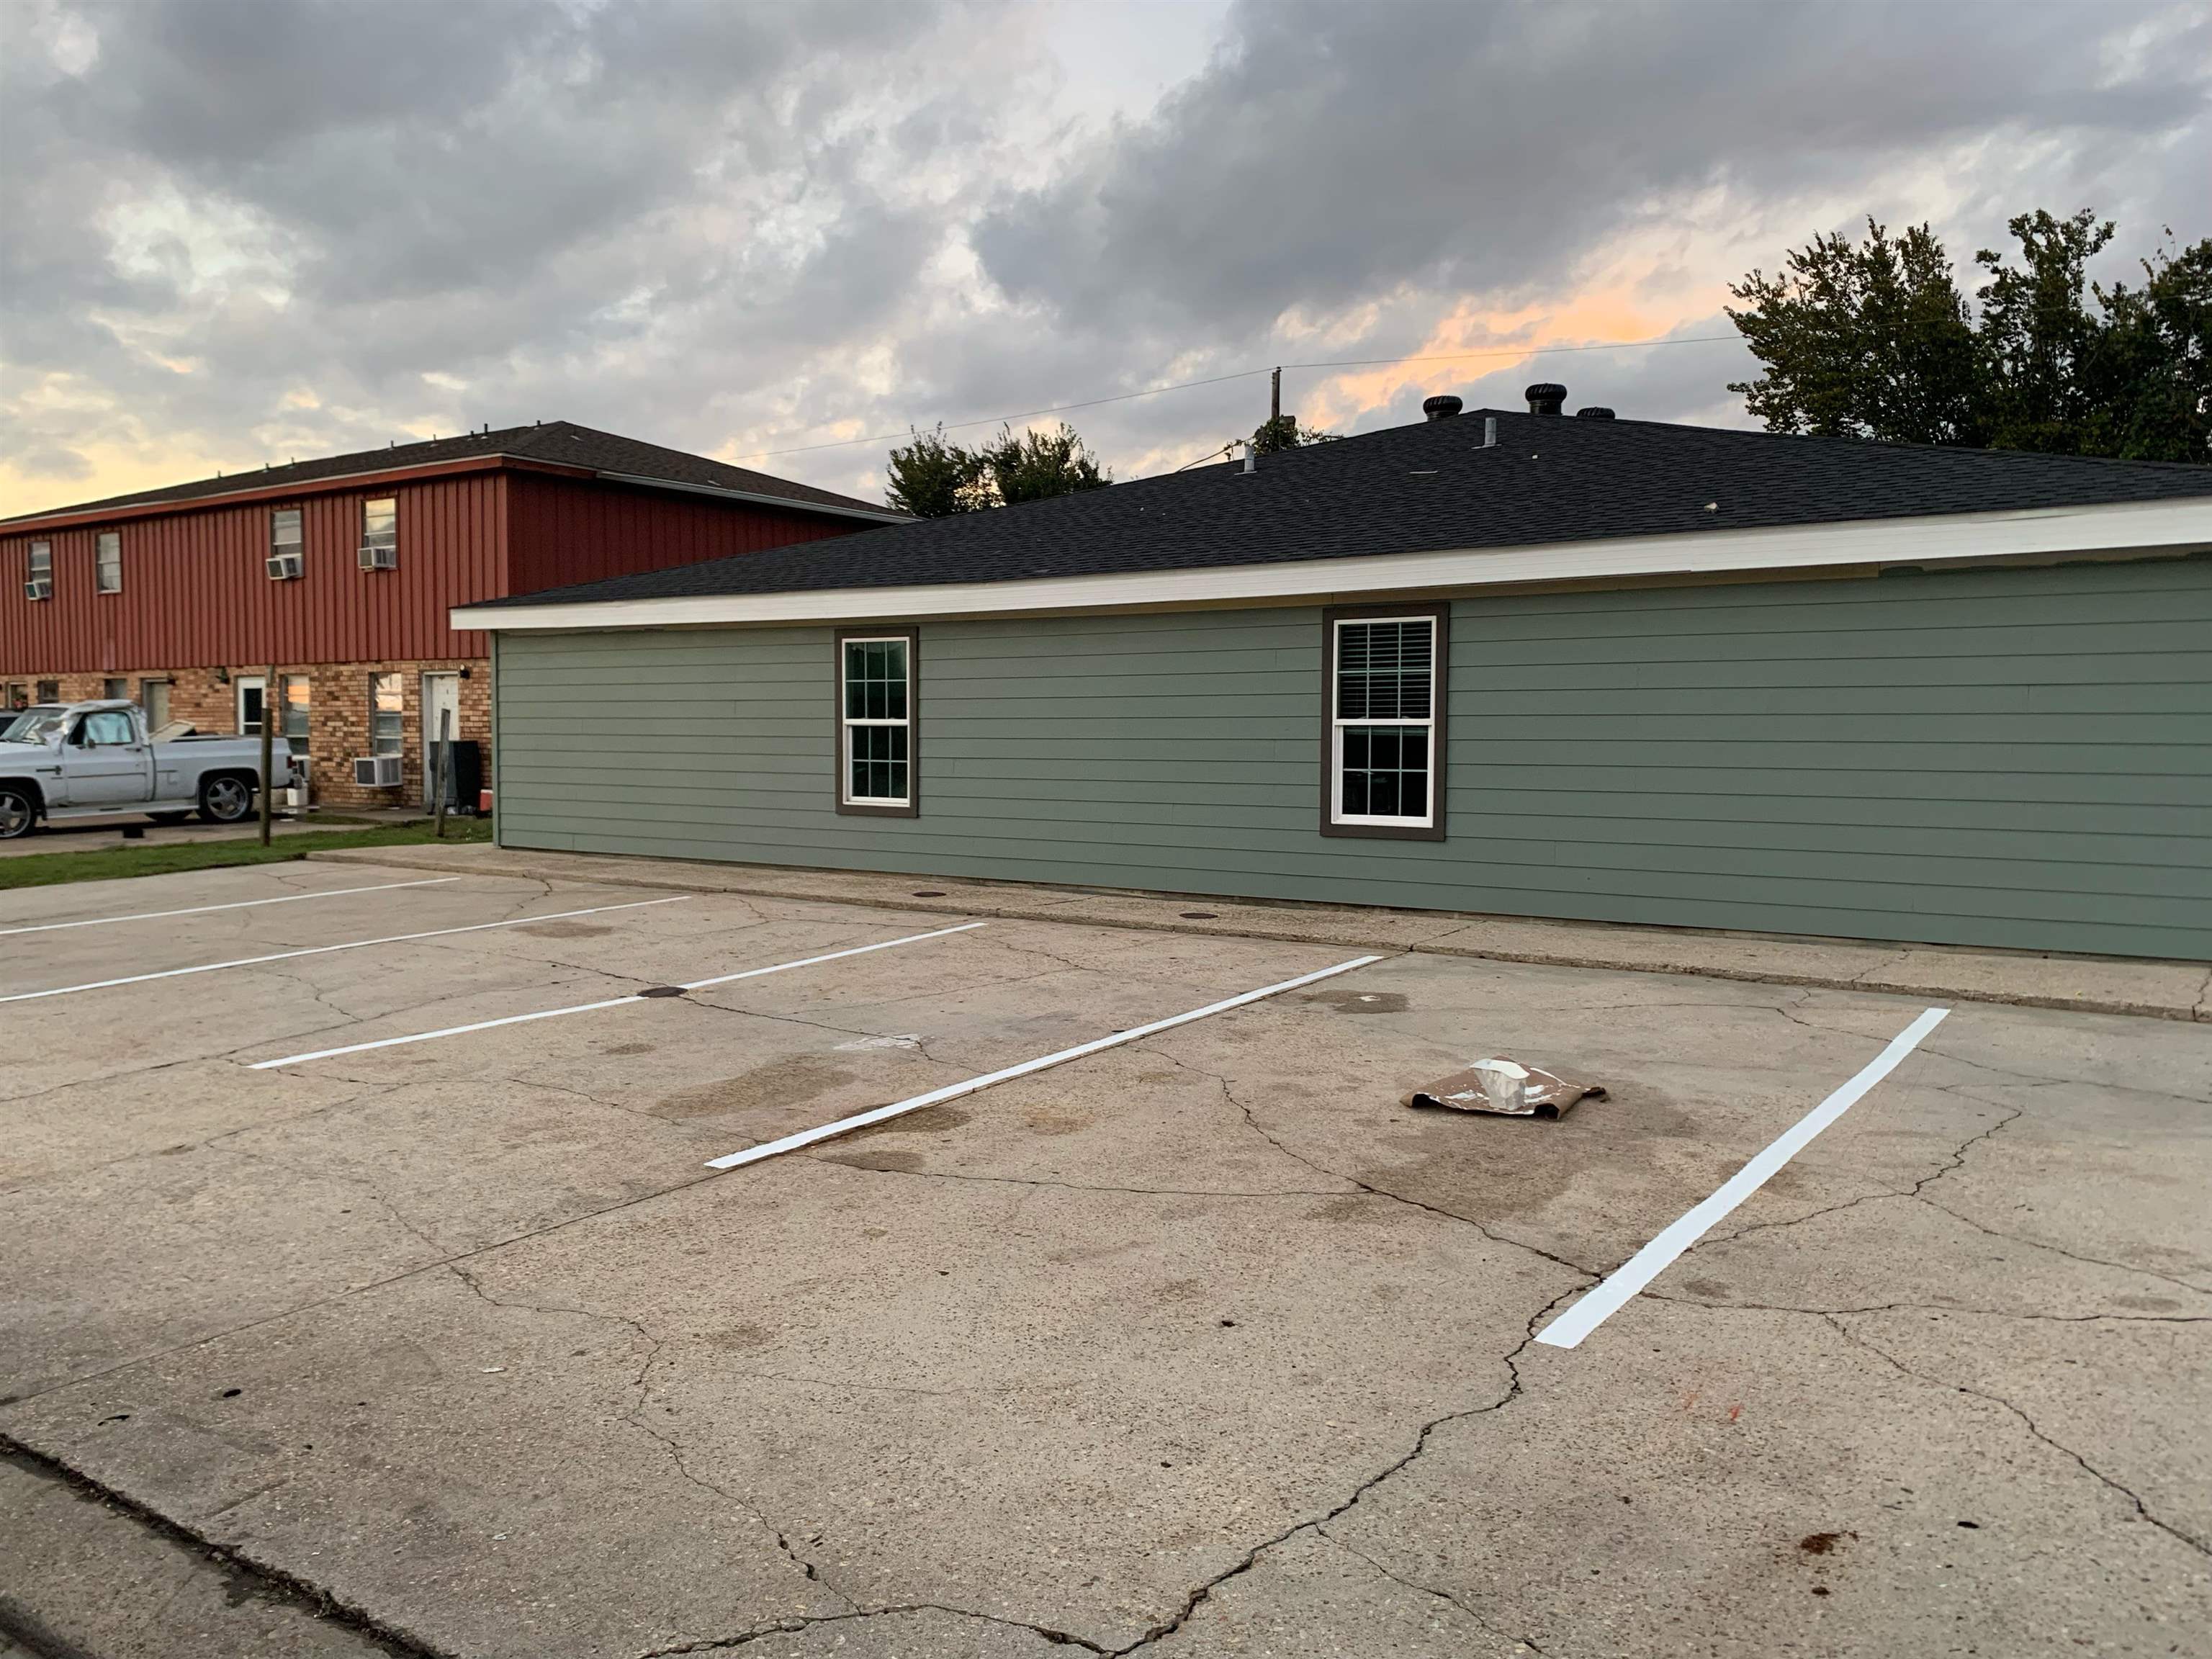
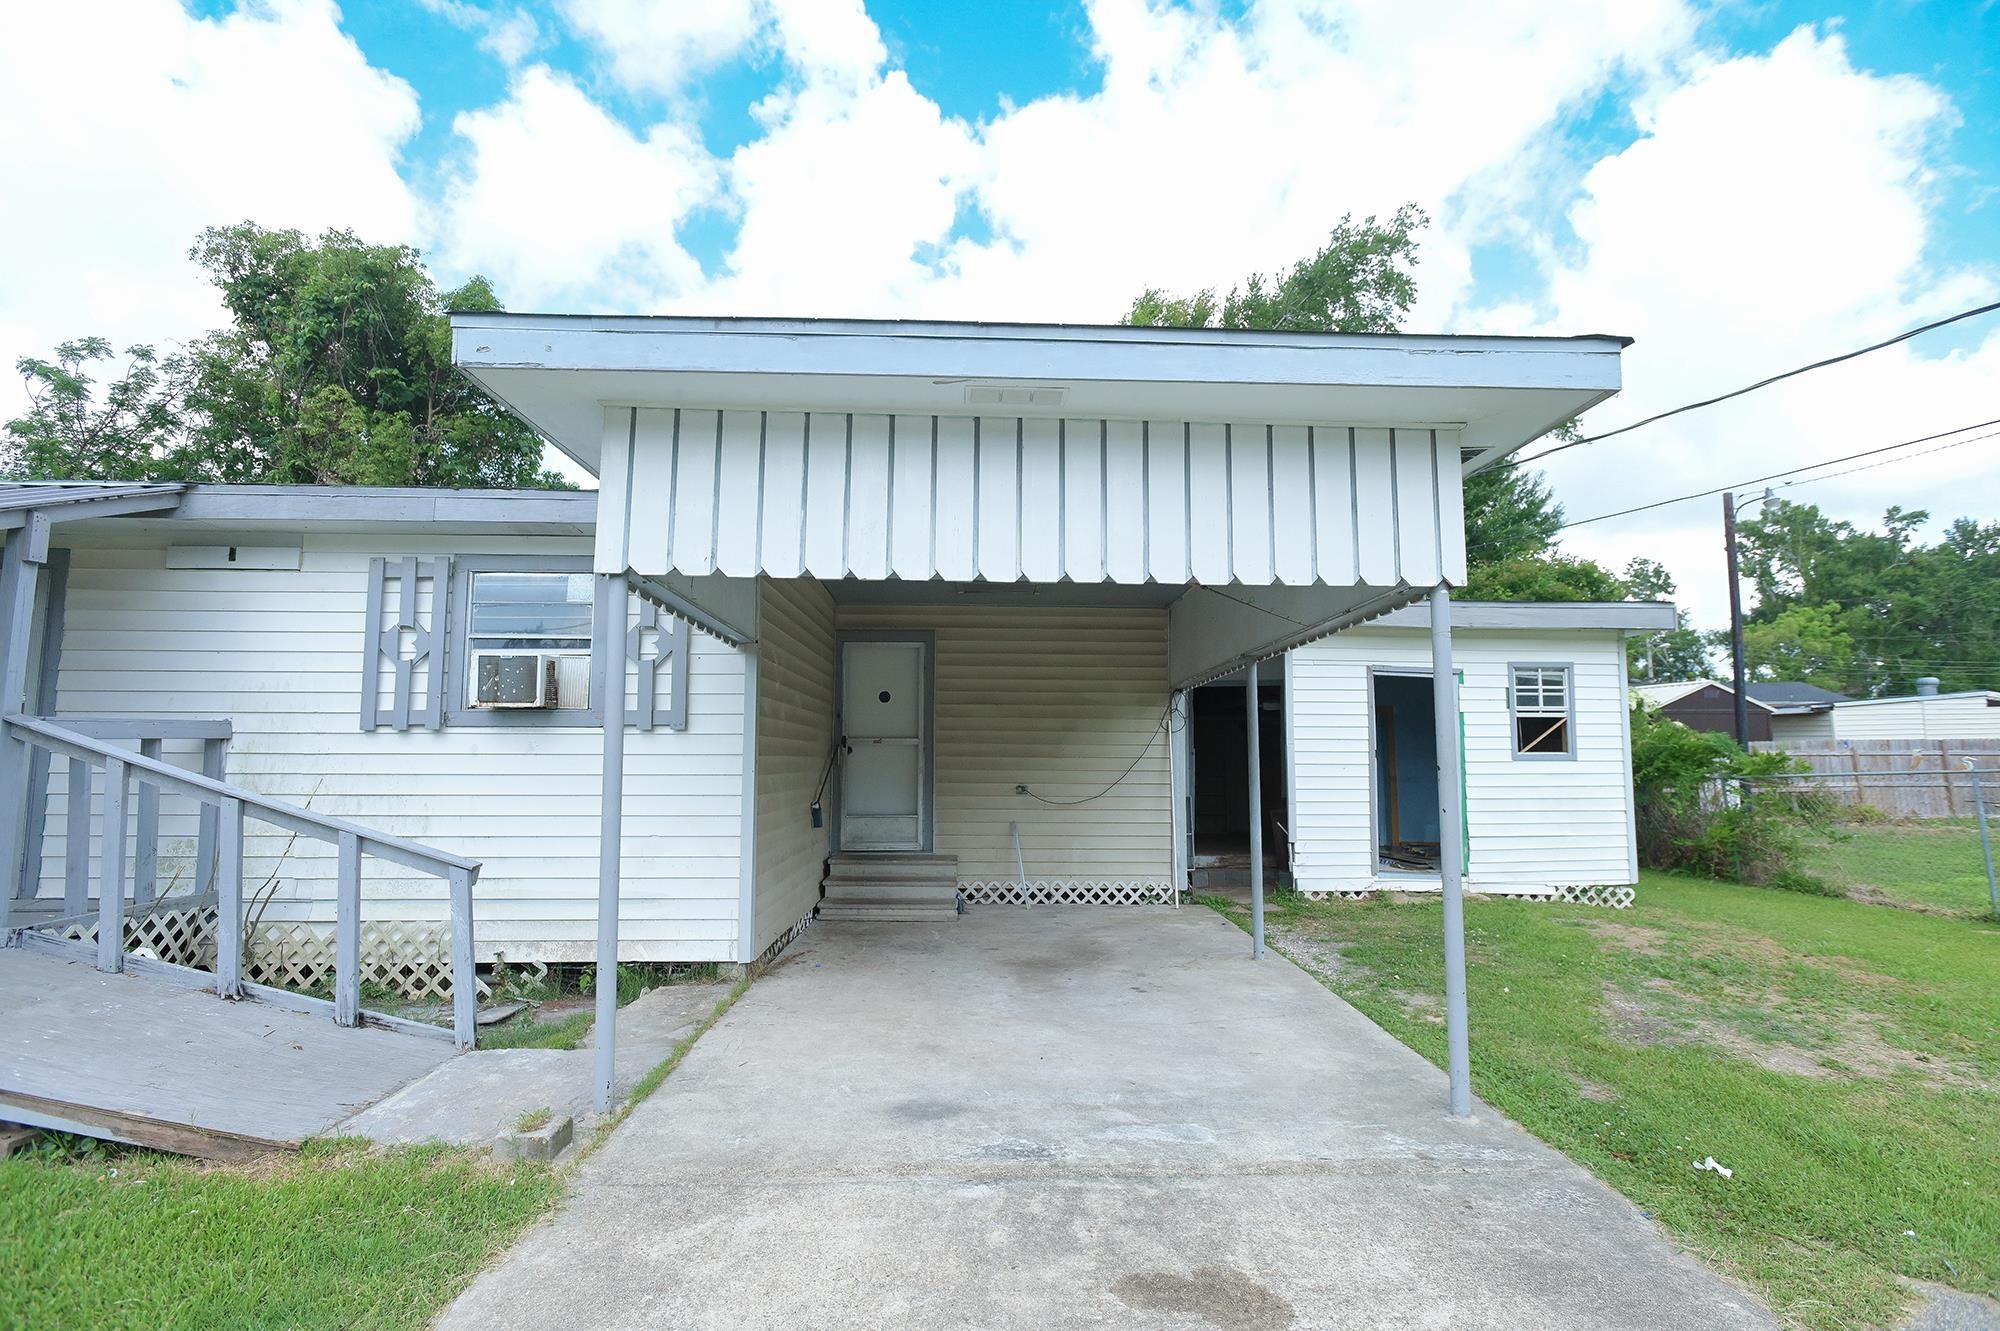
Active
$82,500
bds
|
0
ba
|
2,800
sqft
|
built
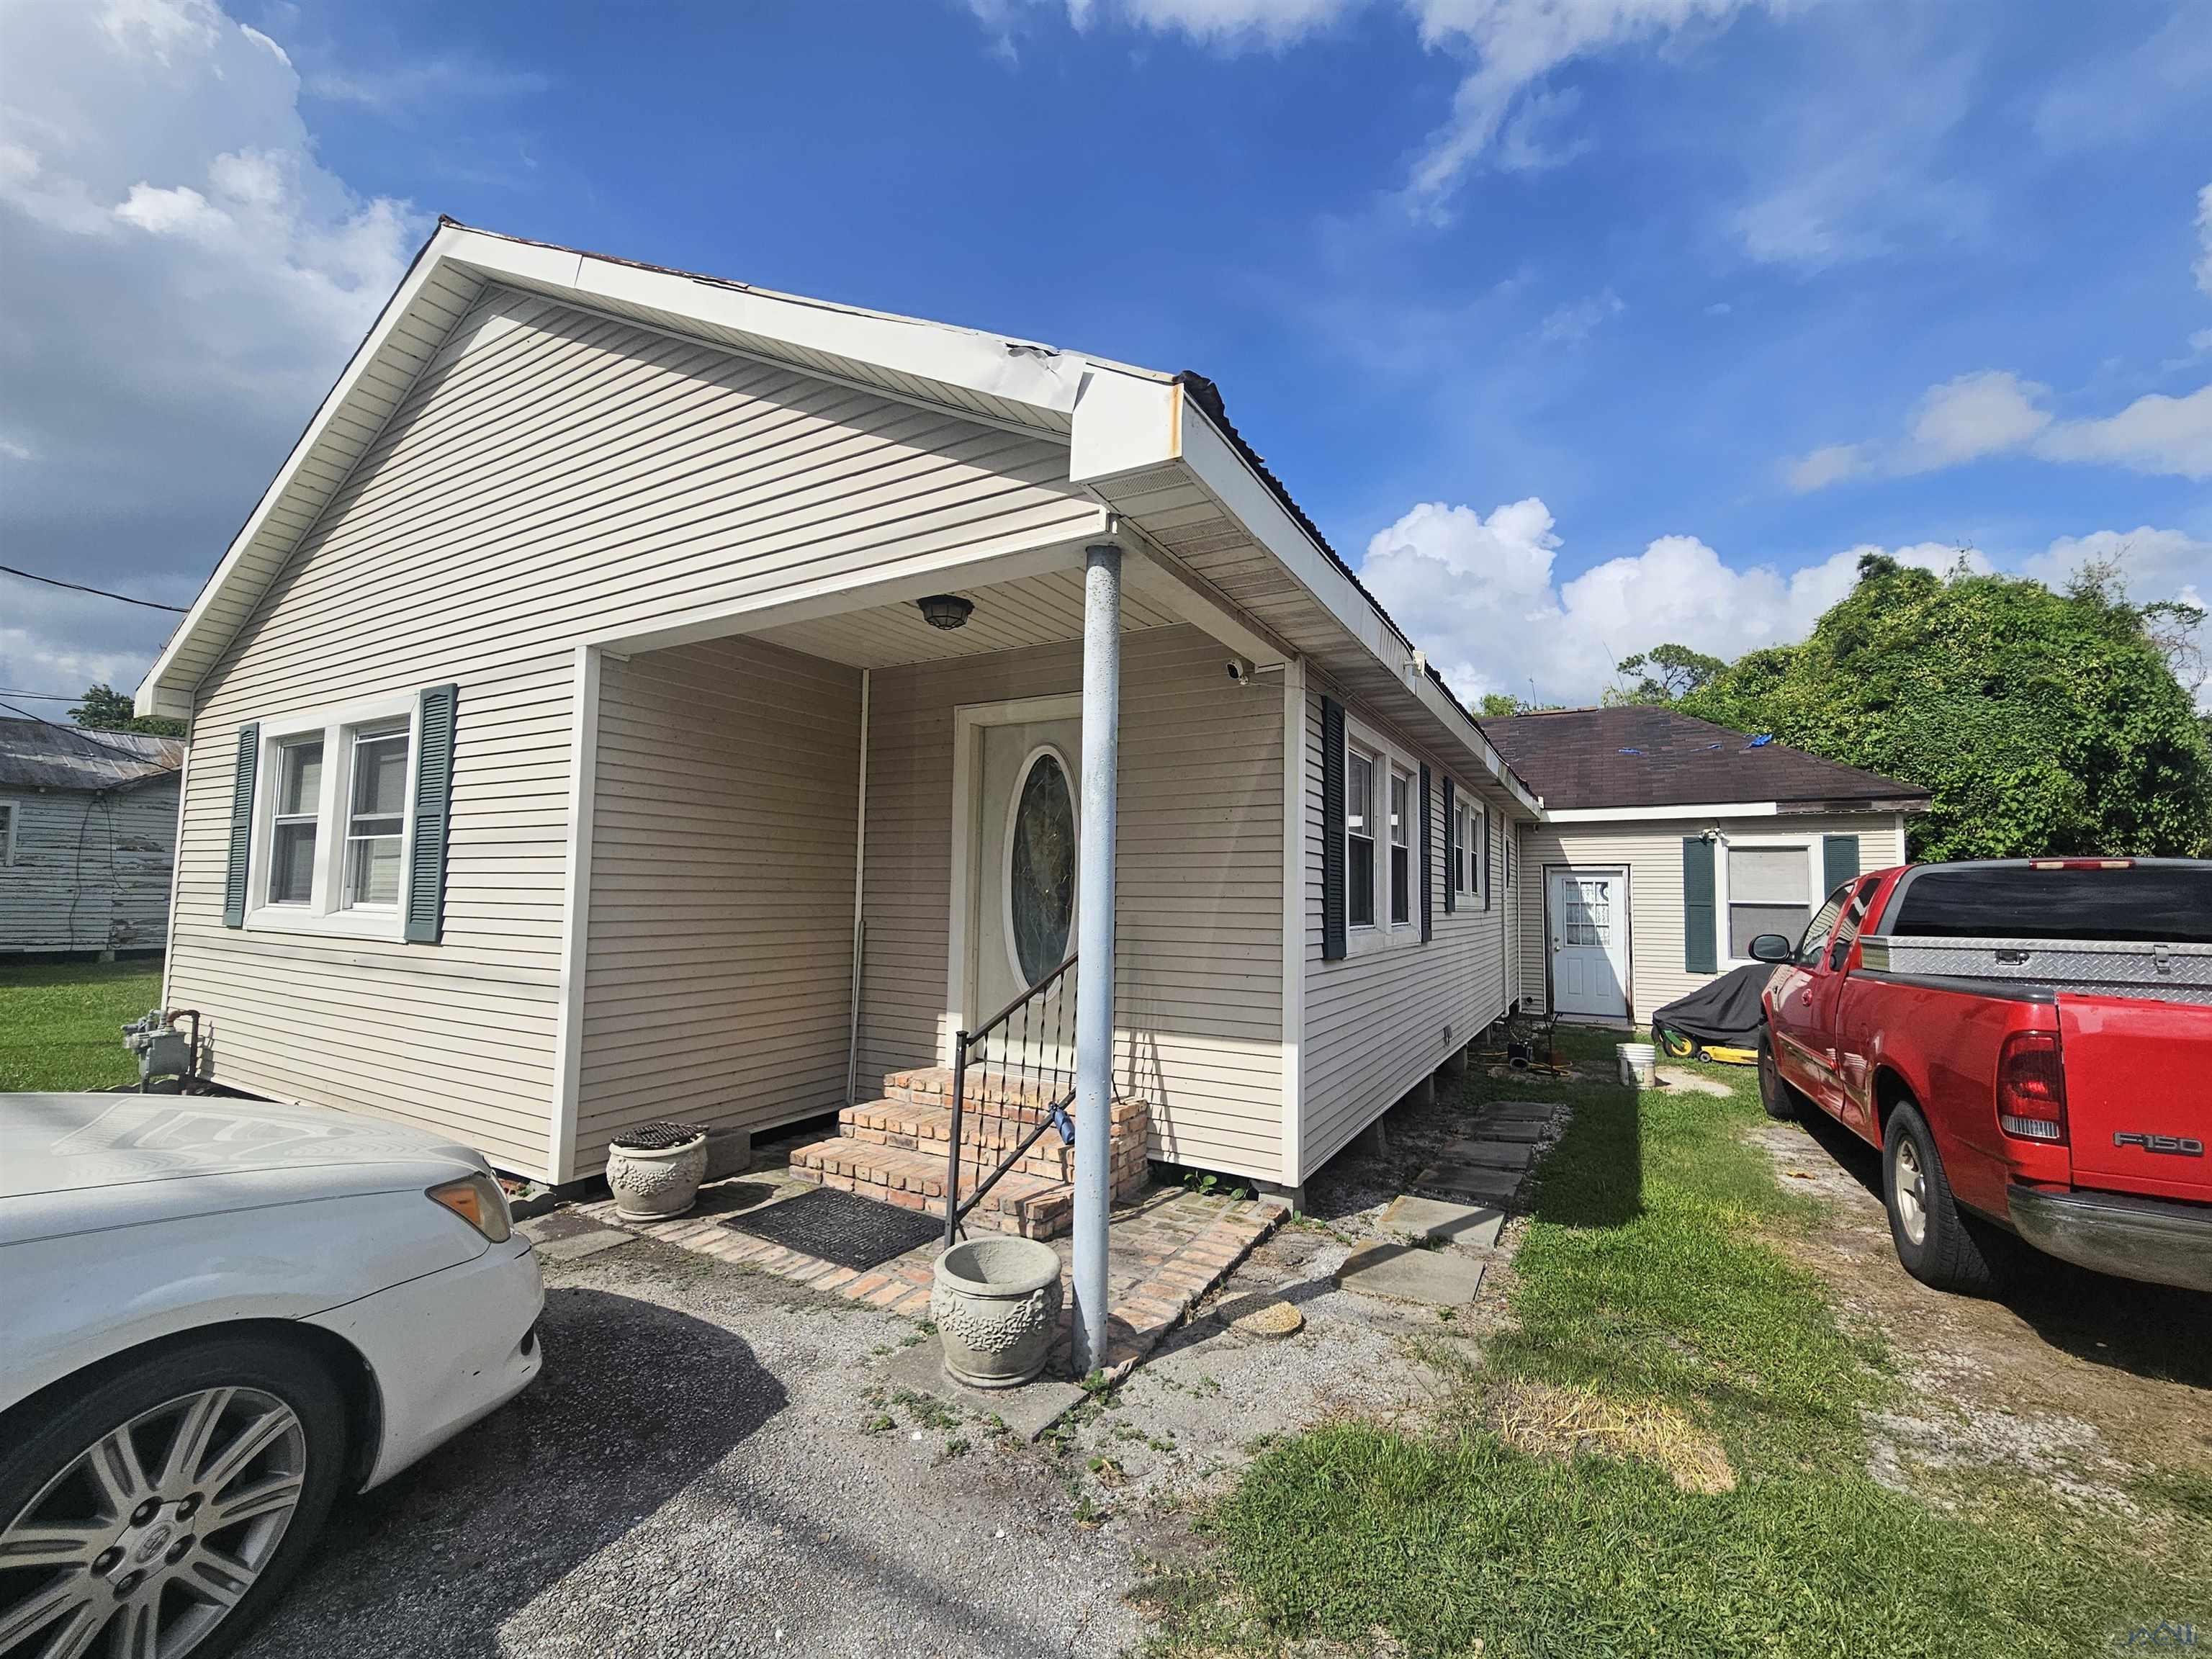
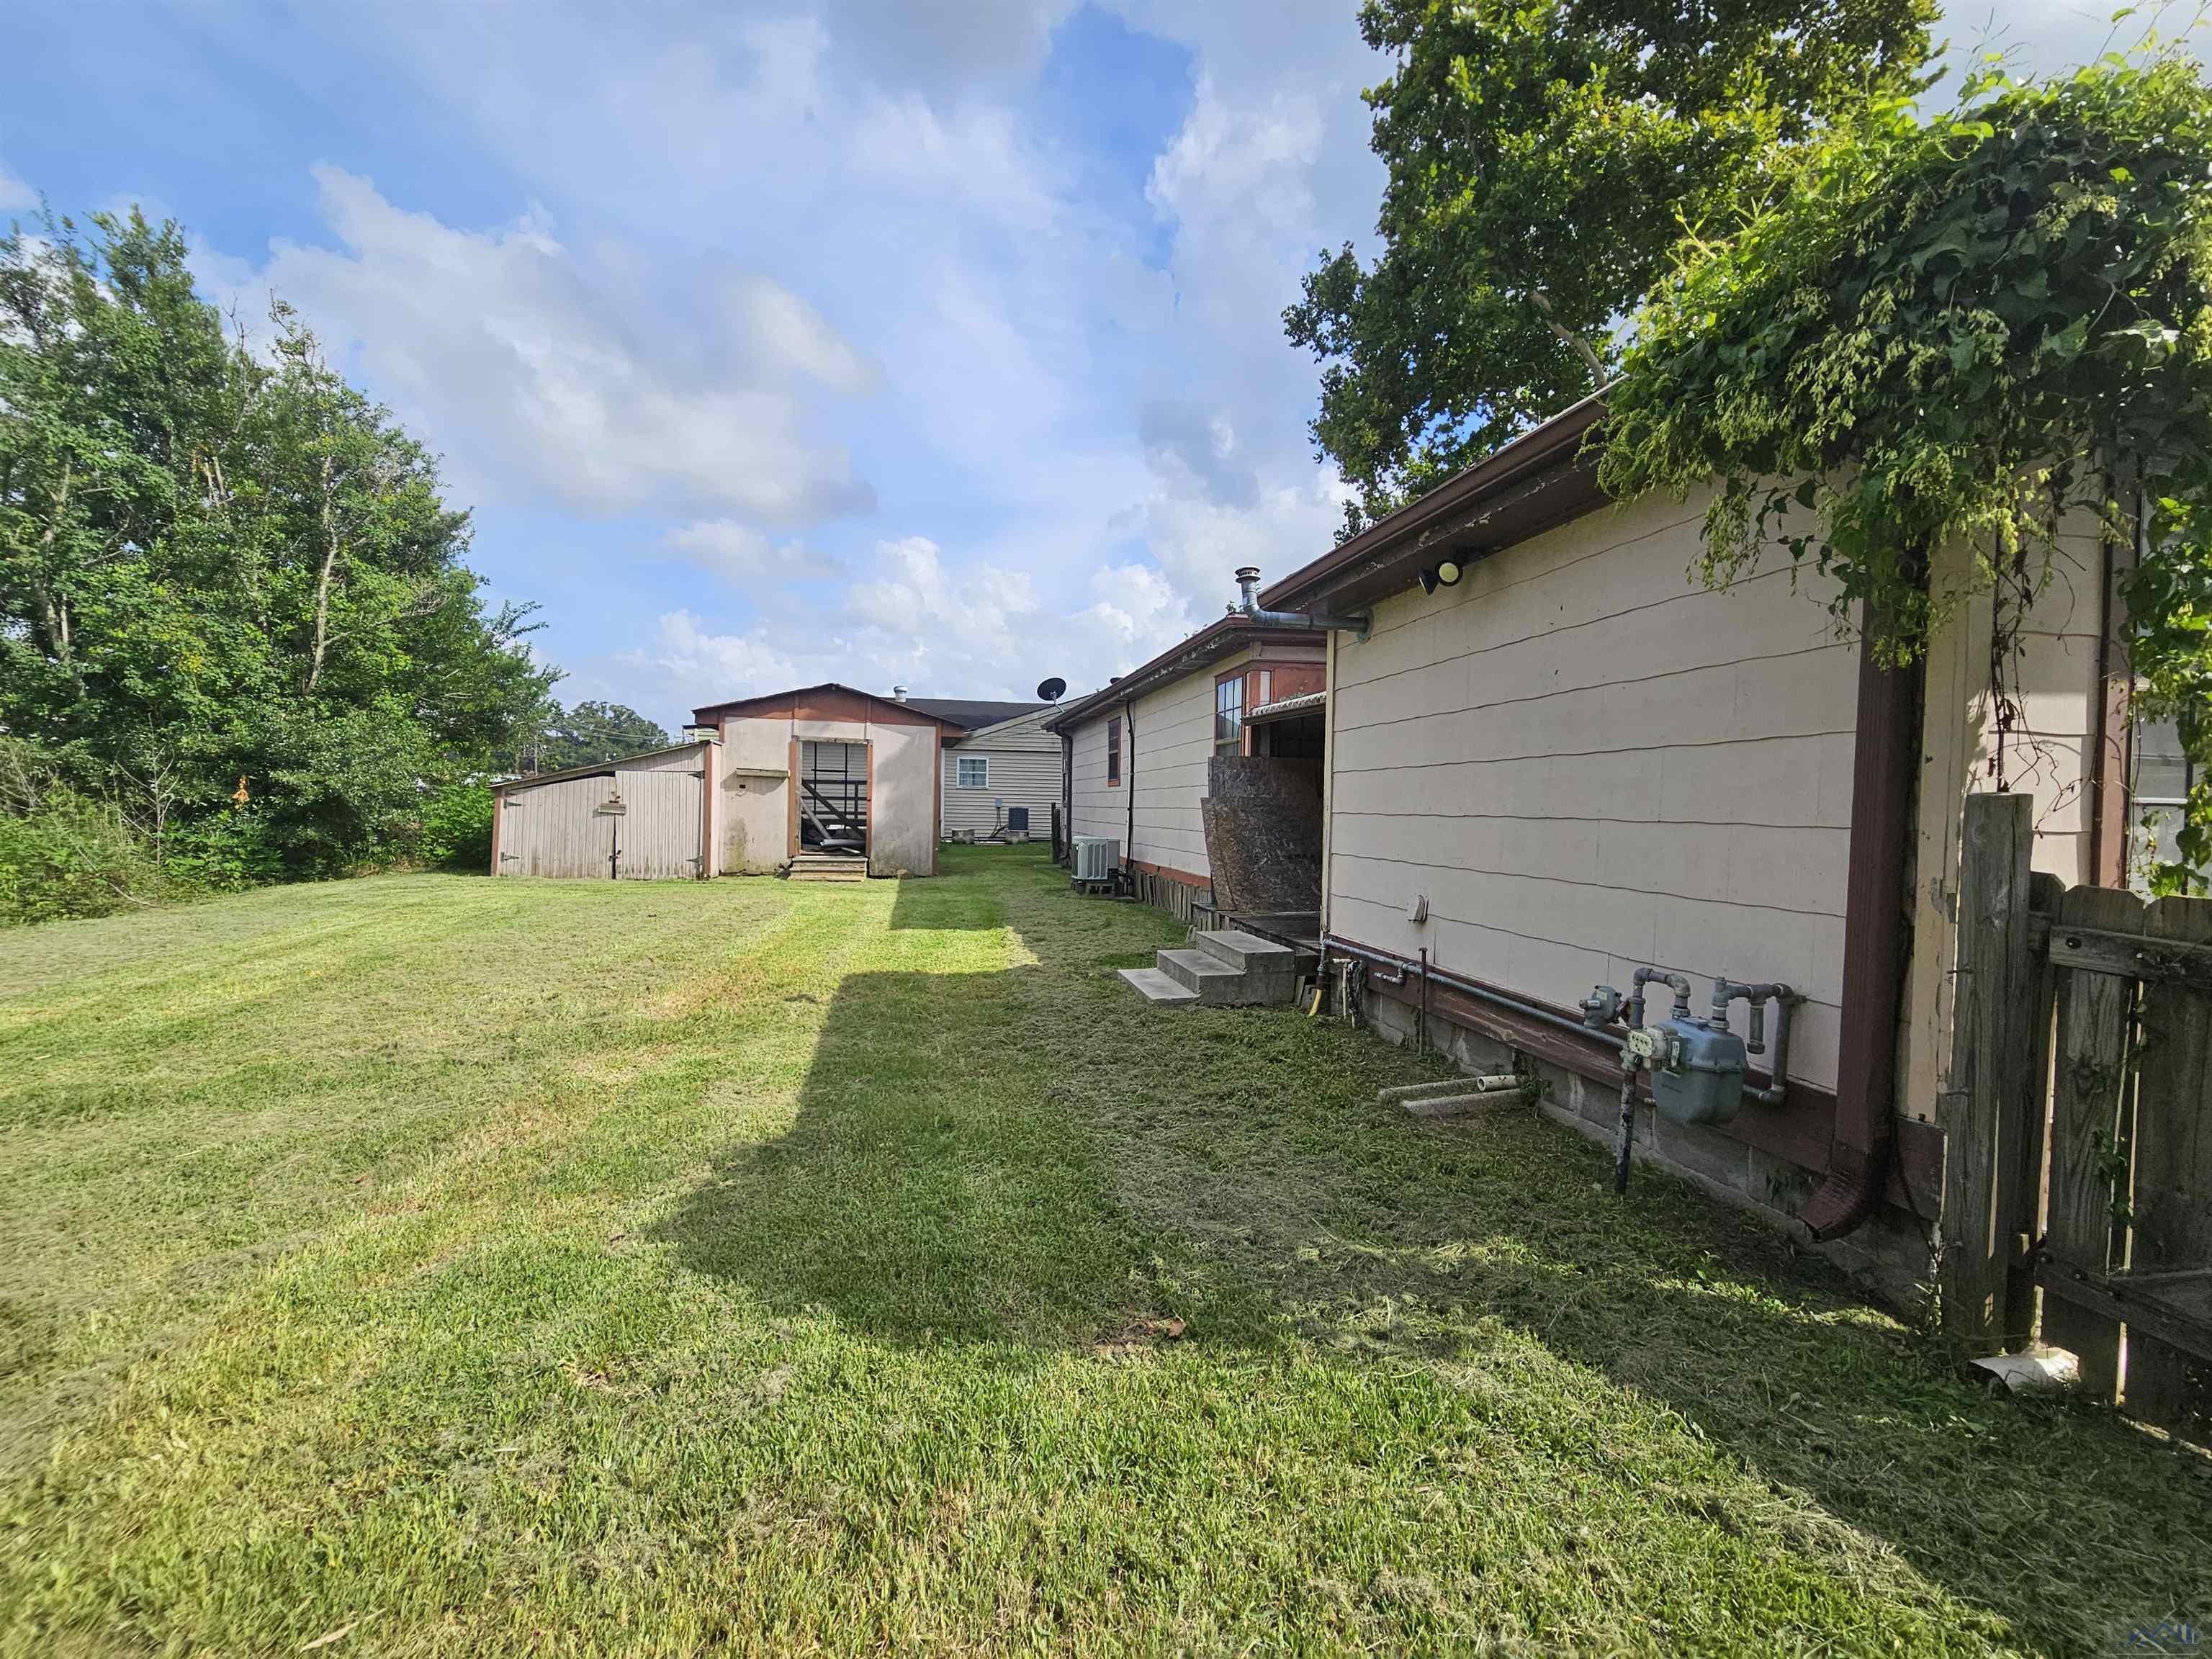
600 Columbus St, Houma, LA 70360
$534
Cash flow
33.8%
Cash-on-Cash Return
14.1%
Cap rate
1.7%
Rent to Value Ratio
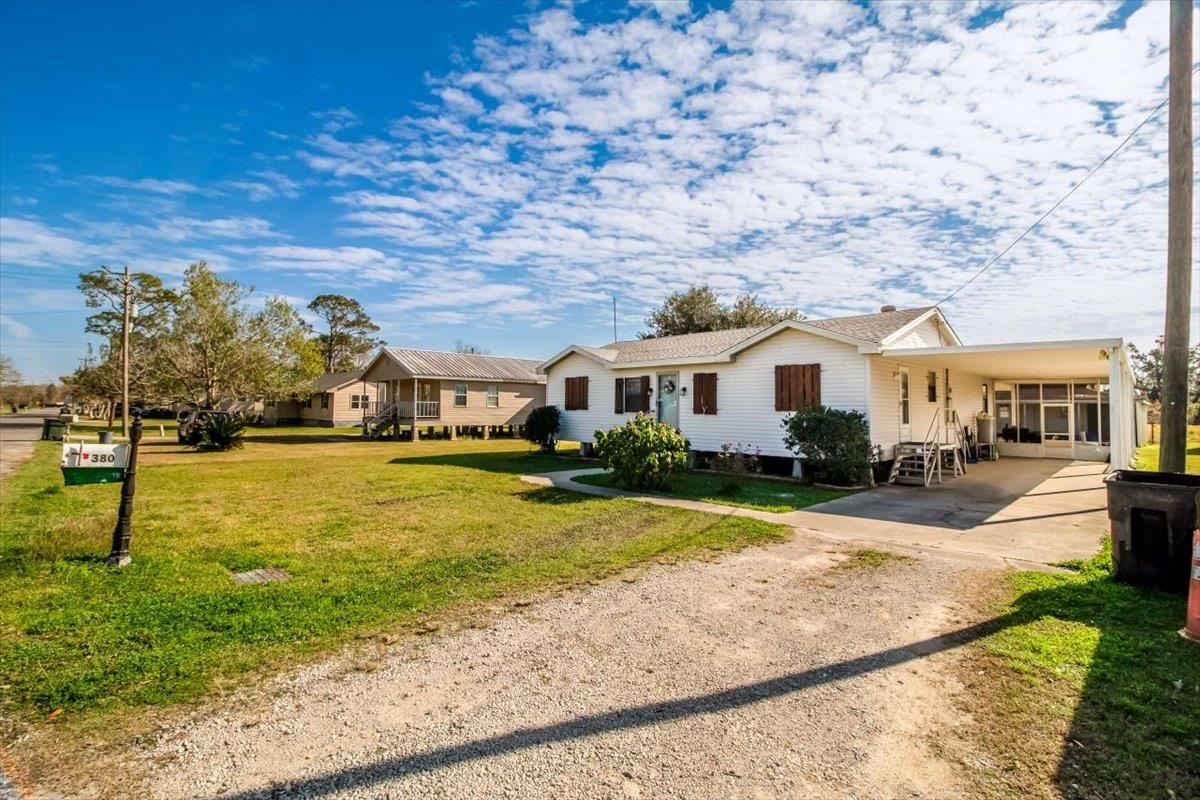
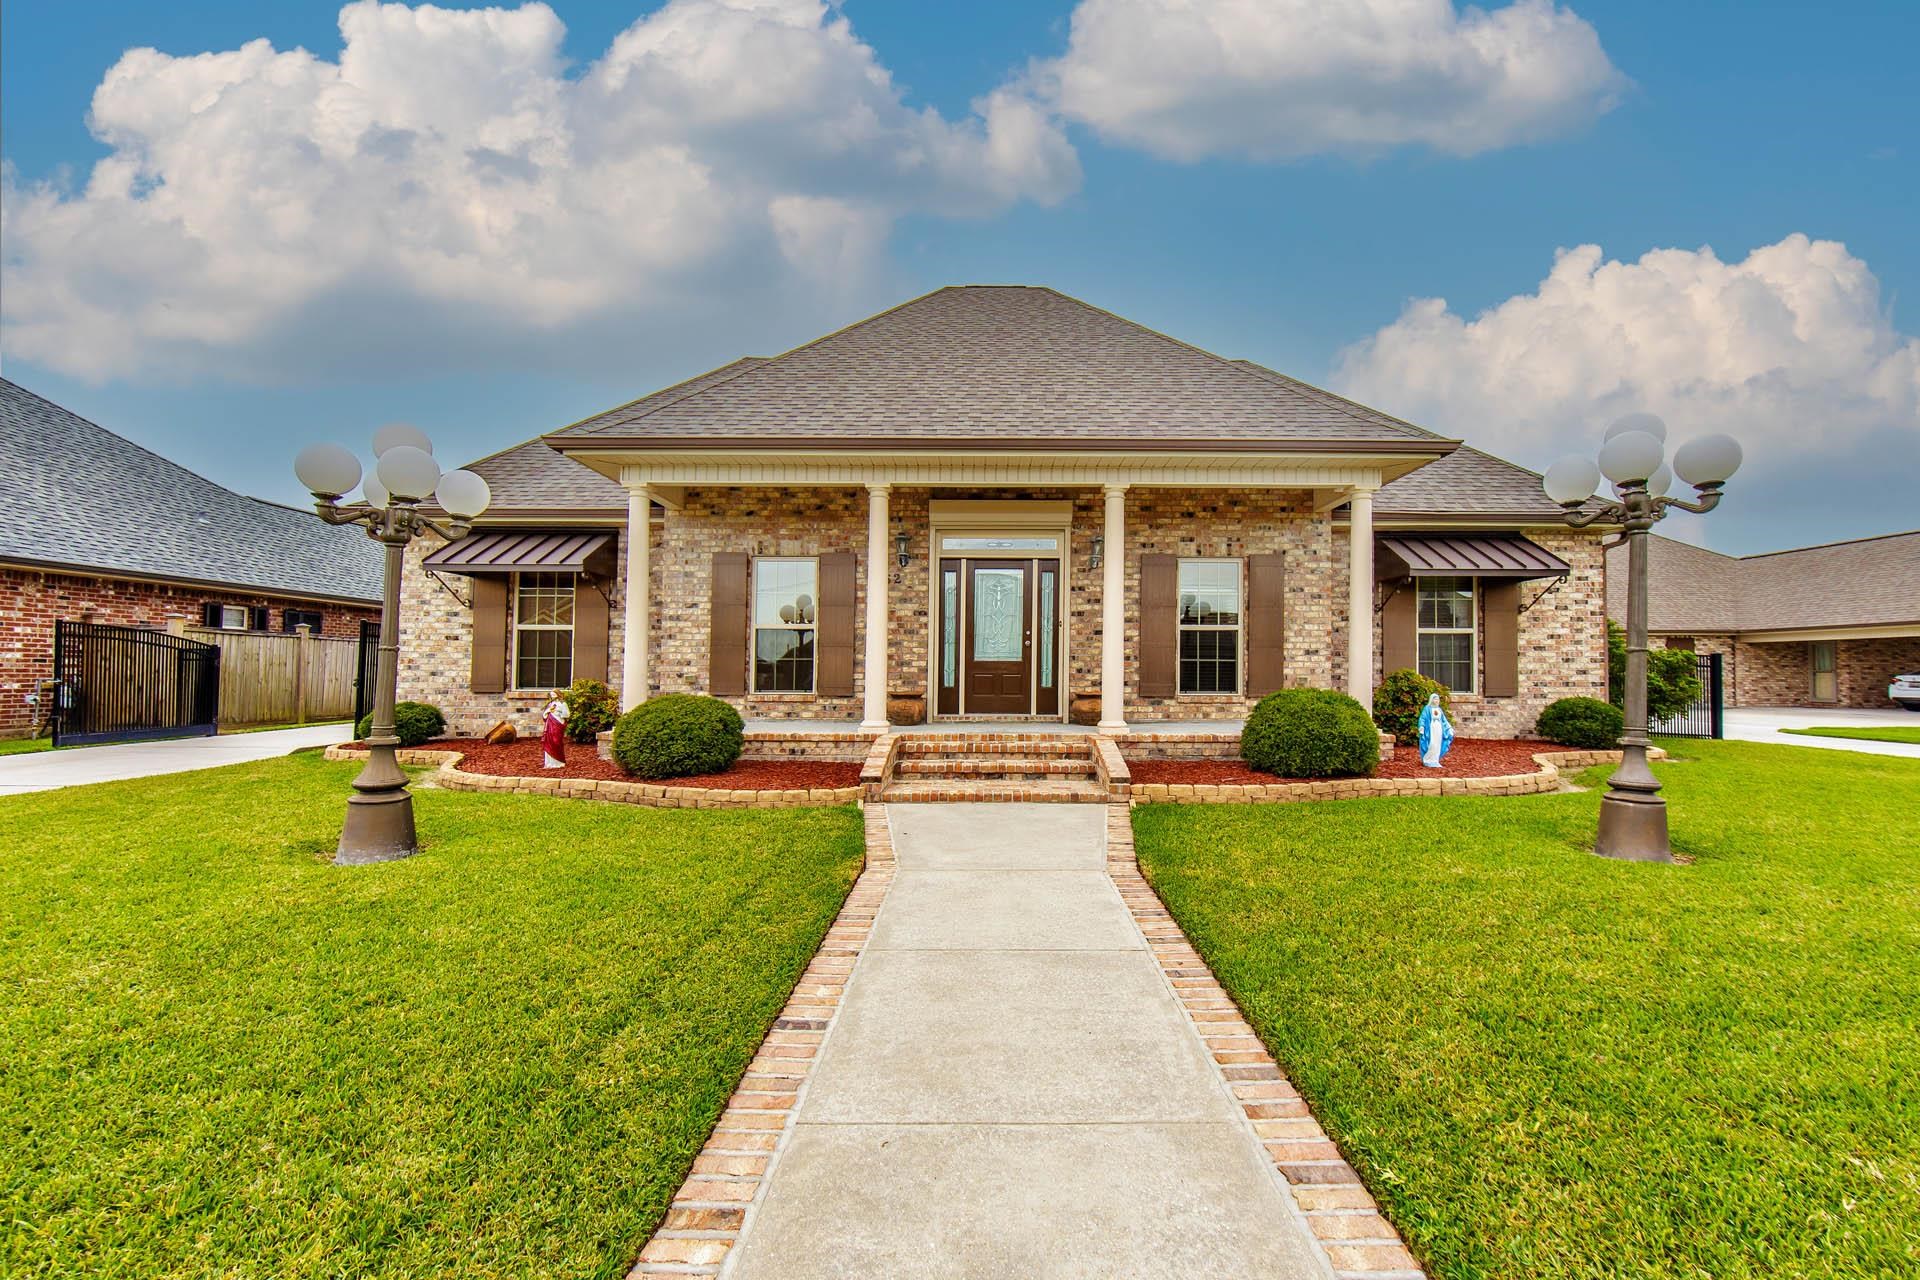
Active
$135,000
3
bds
|
2
ba
|
1,388
sqft
|
built
1960
380 Highridge Dr, Houma, LA 70363
$259
Cash flow
10.0%
Cash-on-Cash Return
8.6%
Cap rate
1.0%
Rent to Value Ratio

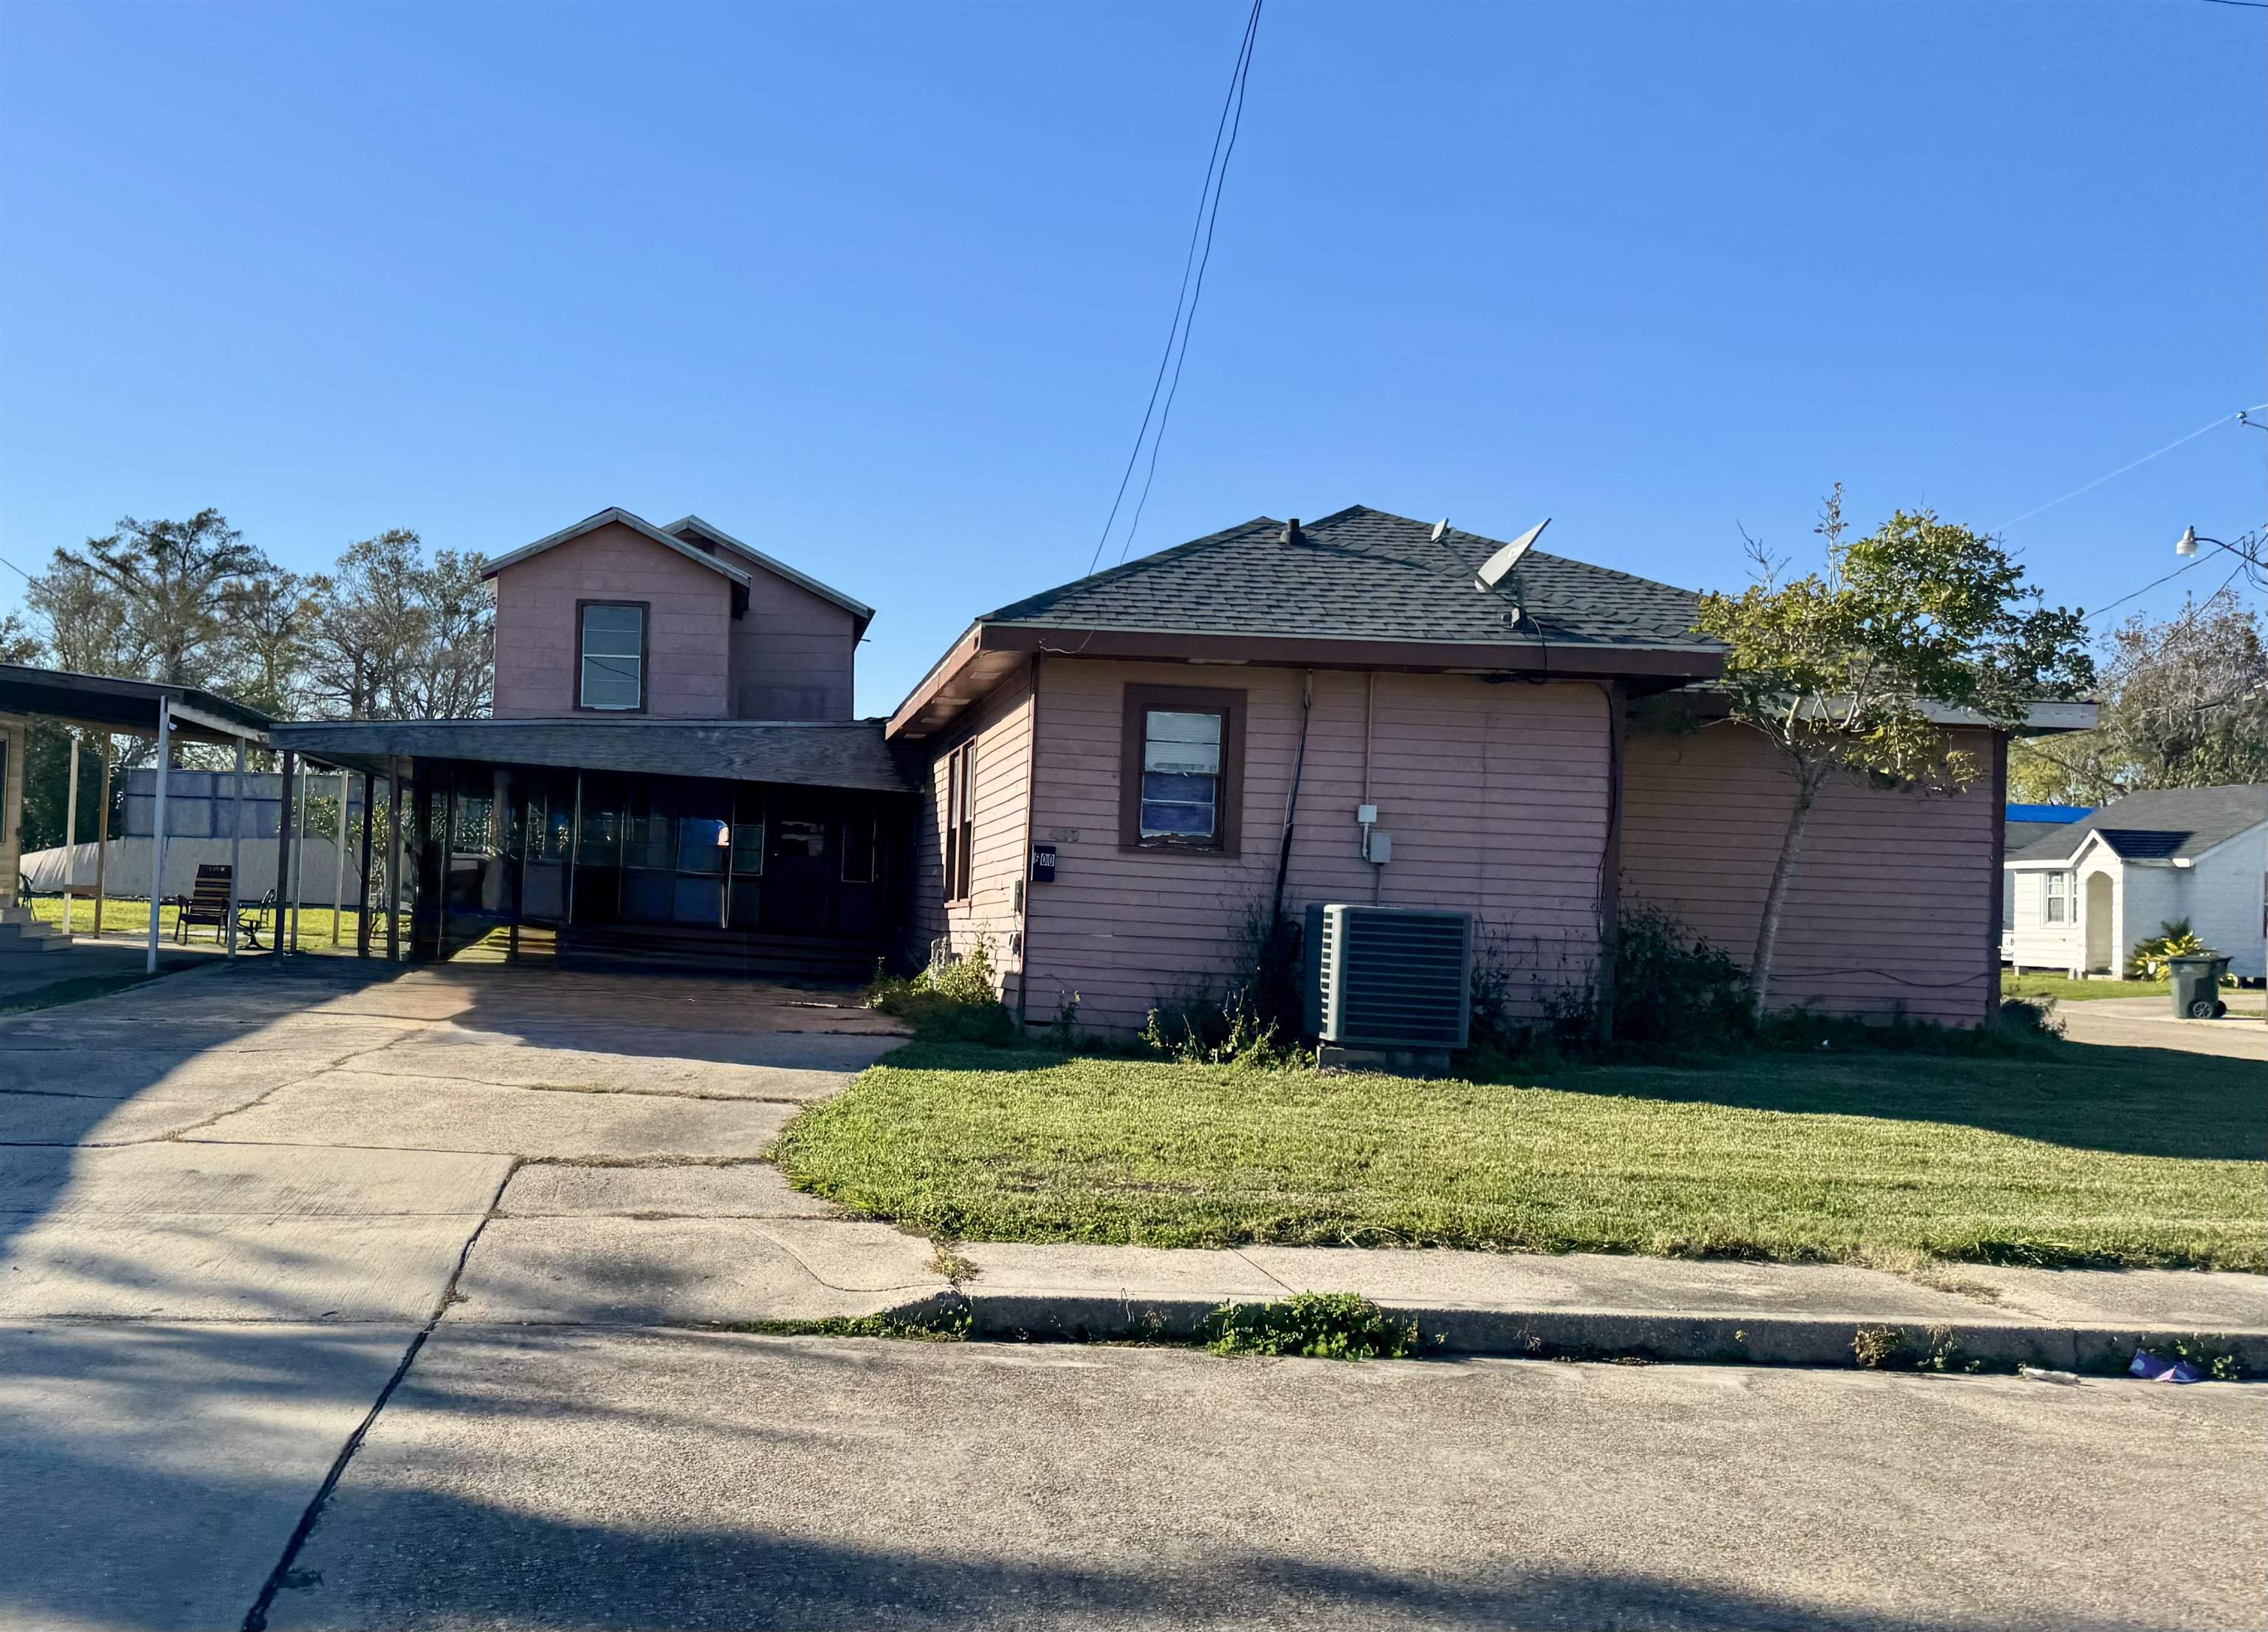
Active
$330,000
3
bds
|
2
ba
|
2,562
sqft
|
built
1975
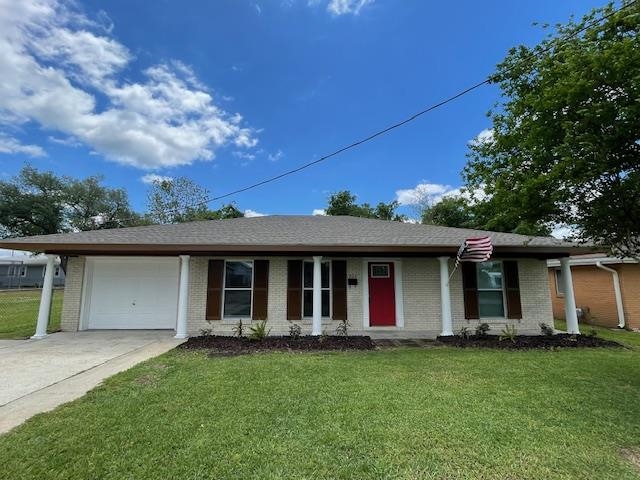
420 Bayou Blue Rd, Houma, LA 70364
$204
Cash flow
3.2%
Cash-on-Cash Return
7.0%
Cap rate
0.8%
Rent to Value Ratio
Active
$139,900
3
bds
|
2
ba
|
1,477
sqft
|
built
1956
314 Marmande St, Houma, LA 70363
$233
Cash flow
8.7%
Cash-on-Cash Return
8.3%
Cap rate
1.0%
Rent to Value Ratio
Active
$119,999
3
bds
|
2
ba
|
1,399
sqft
|
built
1951
111 Roselawn Ave, Houma, LA 70363
$269
Cash flow
11.7%
Cash-on-Cash Return
9.0%
Cap rate
1.1%
Rent to Value Ratio

Active
$139,000
3
bds
|
2
ba
|
1,293
sqft
|
built
1976
1304 Sylvia St, Houma, LA 70363
$238
Cash flow
8.9%
Cash-on-Cash Return
8.3%
Cap rate
1.0%
Rent to Value Ratio
Active
$60,000
3
bds
|
2
ba
|
2,200
sqft
|
built
1975
5477 W Main St, Houma, LA 70360
$966
Cash flow
18.8%
Cash-on-Cash Return
19.3%
Cap rate
2.3%
Rent to Value Ratio
Active
$55,000
2
bds
|
1
ba
|
943
sqft
|
built
1953
5489 W Main St, Houma, LA 70360
$897
Cash flow
19.0%
Cash-on-Cash Return
19.6%
Cap rate
2.4%
Rent to Value Ratio

Active
$165,000
3
bds
|
2
ba
|
1,647
sqft
|
built
1964
137 Hackberry Ave, Houma, LA 70360
$102
Cash flow
3.2%
Cash-on-Cash Return
7.0%
Cap rate
0.8%
Rent to Value Ratio
Active
$183,400
3
bds
|
2
ba
|
1,087
sqft
|
built
1981
515 Cascade Dr, Houma, LA 70364
$144
Cash flow
4.1%
Cash-on-Cash Return
7.2%
Cap rate
0.9%
Rent to Value Ratio

Active
$290,000
4
bds
|
2
ba
|
2,223
sqft
|
built
1973
209 Denning Dr, Houma, LA 70360
$-346
Cash flow
-6.2%
Cash-on-Cash Return
4.9%
Cap rate
0.6%
Rent to Value Ratio

Active
$250,000
3
bds
|
2
ba
|
1,696
sqft
|
built
2014
427 Christopher Dr, Houma, LA 70364
$-205
Cash flow
-4.3%
Cash-on-Cash Return
5.3%
Cap rate
0.6%
Rent to Value Ratio

Active
$169,900
3
bds
|
2
ba
|
1,275
sqft
|
built
1984
3001 Sycamore Dr, Houma, LA 70363
$76
Cash flow
2.3%
Cash-on-Cash Return
6.8%
Cap rate
0.8%
Rent to Value Ratio

Active
$175,000
3
bds
|
1
ba
|
1,417
sqft
|
built
1975
112 Everette Dr, Houma, LA 70364
$50
Cash flow
1.5%
Cash-on-Cash Return
6.6%
Cap rate
0.8%
Rent to Value Ratio
Active
$300,000
4
bds
|
3
ba
|
2,193
sqft
|
built
1972
180 Division St, Houma, LA 70364
$-329
Cash flow
-5.7%
Cash-on-Cash Return
5.0%
Cap rate
0.6%
Rent to Value Ratio

Active
$165,000
3
bds
|
2
ba
|
1,667
sqft
|
built
1975
115 Olympe Dr, Houma, LA 70363
$102
Cash flow
3.2%
Cash-on-Cash Return
7.0%
Cap rate
0.8%
Rent to Value Ratio
Active
$159,000
2
bds
|
2
ba
|
1,250
sqft
|
built
1983
207 N French Quarter Dr, Houma, LA 70364
$133
Cash flow
4.4%
Cash-on-Cash Return
7.3%
Cap rate
0.9%
Rent to Value Ratio
Active
$245,000
3
bds
|
2
ba
|
1,712
sqft
|
built
1984
208 Angelle Dr, Houma, LA 70360
$-179
Cash flow
-3.8%
Cash-on-Cash Return
5.4%
Cap rate
0.7%
Rent to Value Ratio
Active
$330,000
3
bds
|
3
ba
|
3,021
sqft
|
built
1979
118 Chantilly Dr, Houma, LA 70360
$-486
Cash flow
-7.7%
Cash-on-Cash Return
4.5%
Cap rate
0.5%
Rent to Value Ratio
Active
$204,500
3
bds
|
2
ba
|
1,619
sqft
|
built
2005
404 Tanglewood Dr, Houma, LA 70364
$33
Cash flow
0.8%
Cash-on-Cash Return
6.5%
Cap rate
0.8%
Rent to Value Ratio
Active
$382,900
5
bds
|
3
ba
|
3,893
sqft
|
built
1977
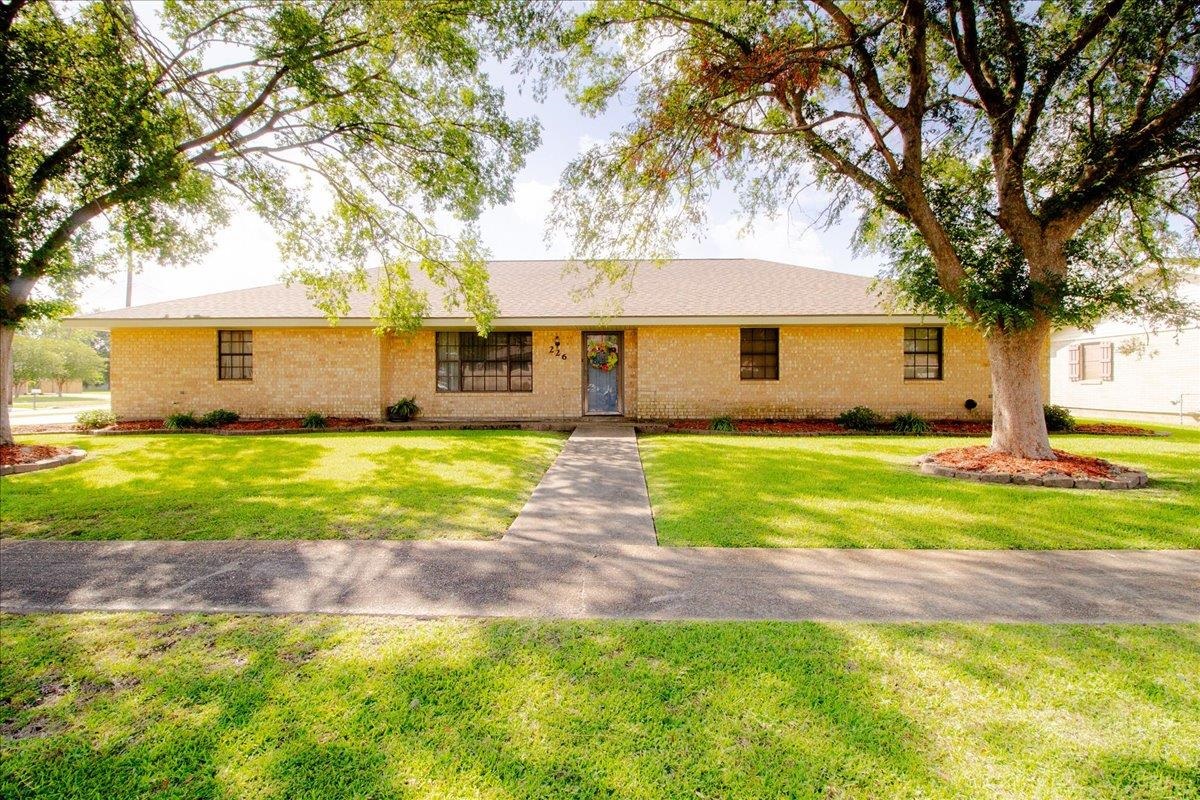
226 Lynwood Dr, Houma, LA 70360
$-763
Cash flow
-10.4%
Cash-on-Cash Return
3.9%
Cap rate
0.5%
Rent to Value Ratio
Active
$190,000
3
bds
|
1
ba
|
1,453
sqft
|
built
1957
503 July Dr, Houma, LA 70360
$-236
Cash flow
-6.5%
Cash-on-Cash Return
4.8%
Cap rate
0.6%
Rent to Value Ratio

Active
$745,000
3
bds
|
4
ba
|
2,717
sqft
|
built
2015
118 Godchaux Dr, Houma, LA 70360
$-2,383
Cash flow
-16.7%
Cash-on-Cash Return
2.4%
Cap rate
0.3%
Rent to Value Ratio
Active
$384,900
bds
|
0
ba
|
3,152
sqft
|
built
3605 Thomas Dr, Houma, LA 70363
$-1,533
Cash flow
-20.8%
Cash-on-Cash Return
1.5%
Cap rate
0.2%
Rent to Value Ratio

Active
$210,000
3
bds
|
2
ba
|
1,428
sqft
|
built
1998
439 Woodfield Blvd, Houma, LA 70364
$-134
Cash flow
-3.3%
Cash-on-Cash Return
5.5%
Cap rate
0.7%
Rent to Value Ratio
Active
$400,000
4
bds
|
3
ba
|
2,921
sqft
|
built
2013
4622 Sugar Bend St, Houma, LA 70364
$-577
Cash flow
-7.5%
Cash-on-Cash Return
4.6%
Cap rate
0.5%
Rent to Value Ratio
Active
$185,000
3
bds
|
2
ba
|
1,590
sqft
|
built
1976
515 Douglas Dr, Houma, LA 70364
$66
Cash flow
1.9%
Cash-on-Cash Return
6.7%
Cap rate
0.8%
Rent to Value Ratio
Active
$227,500
3
bds
|
2
ba
|
1,653
sqft
|
built
1979
424 Gaynell Dr, Houma, LA 70364
$-156
Cash flow
-3.6%
Cash-on-Cash Return
5.5%
Cap rate
0.7%
Rent to Value Ratio
Active
$75,000
3
bds
|
2
ba
|
1,079
sqft
|
built
1970
208 Authement St, Houma, LA 70363
$504
Cash flow
35.1%
Cash-on-Cash Return
14.4%
Cap rate
1.7%
Rent to Value Ratio

Active
$159,900
2
bds
|
2
ba
|
1,096
sqft
|
built
1988
209 N French Quarter Dr, Houma, LA 70364
$129
Cash flow
4.2%
Cash-on-Cash Return
7.2%
Cap rate
0.9%
Rent to Value Ratio
Active
$449,000
3
bds
|
2
ba
|
2,242
sqft
|
built
2011
262 Inglewood Way, Houma, LA 70360
$-902
Cash flow
-10.5%
Cash-on-Cash Return
3.9%
Cap rate
0.5%
Rent to Value Ratio

Active
$389,000
4
bds
|
3
ba
|
2,380
sqft
|
built
1982
210 Lynwood Dr, Houma, LA 70360
$-933
Cash flow
-12.5%
Cash-on-Cash Return
3.4%
Cap rate
0.4%
Rent to Value Ratio
Active
$120,000
4
bds
|
2
ba
|
2,115
sqft
|
built
1991
411 Bayou Blue Rd, Houma, LA 70364
$338
Cash flow
14.7%
Cash-on-Cash Return
9.7%
Cap rate
1.2%
Rent to Value Ratio

Active
$225,000
3
bds
|
3
ba
|
2,019
sqft
|
built
1966
657 Duval Ave, Houma, LA 70364
$-212
Cash flow
-4.9%
Cash-on-Cash Return
5.2%
Cap rate
0.6%
Rent to Value Ratio
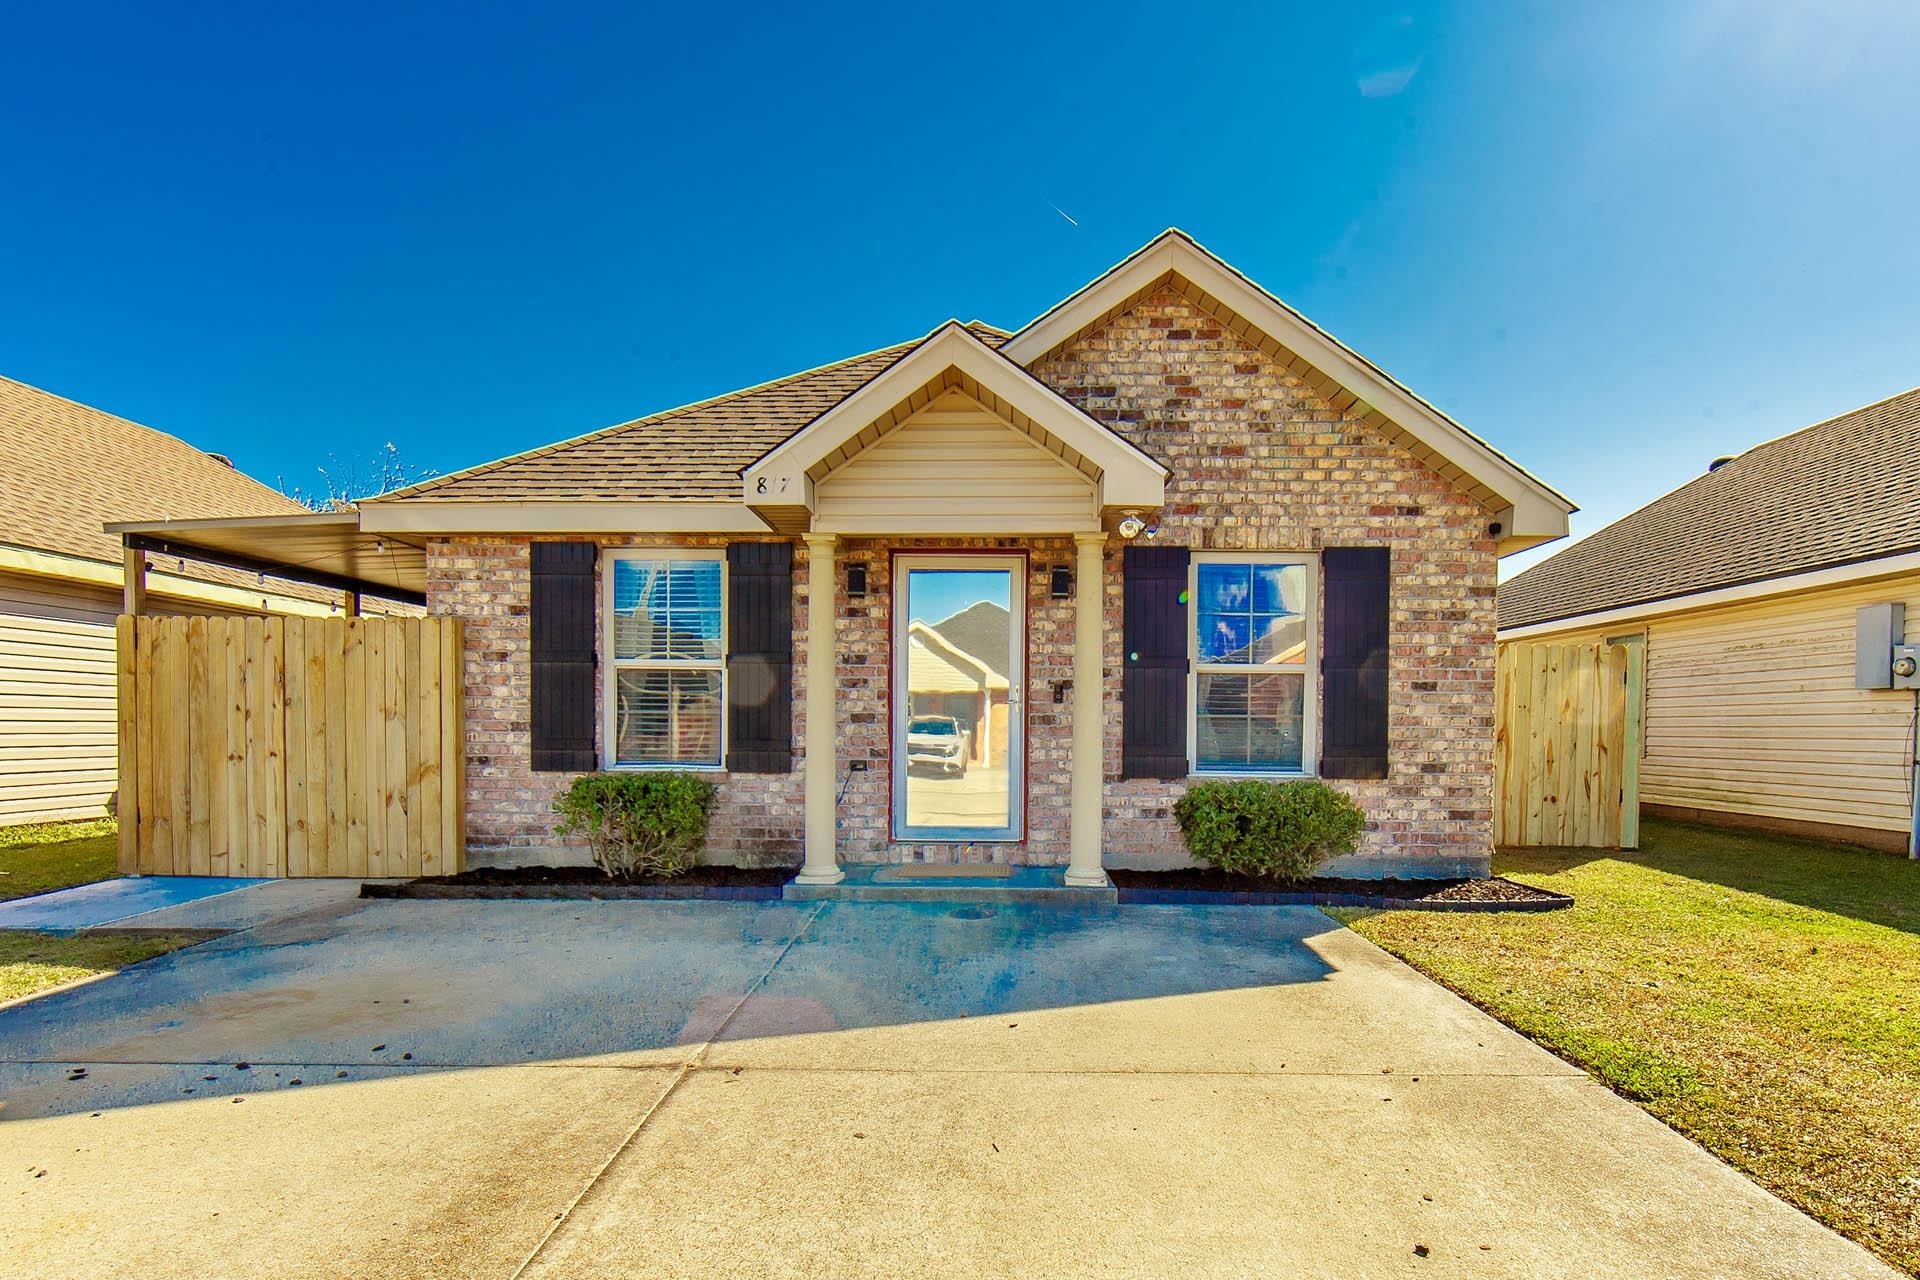
Active
$159,900
3
bds
|
2
ba
|
1,008
sqft
|
built
2001
817 Cottagemill Ln, Houma, LA 70363
$129
Cash flow
4.2%
Cash-on-Cash Return
7.2%
Cap rate
0.9%
Rent to Value Ratio
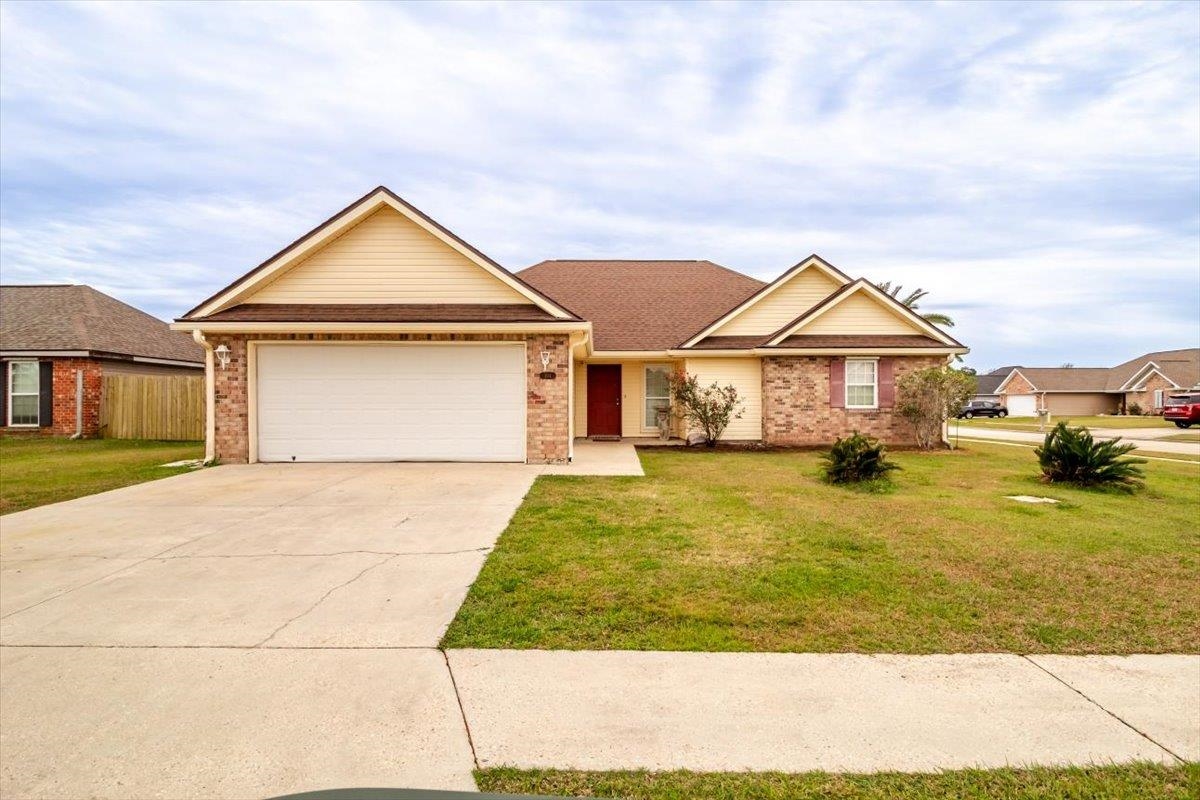
Active
$232,000
4
bds
|
2
ba
|
1,620
sqft
|
built
2007
304 Dawes St, Houma, LA 70363
$-180
Cash flow
-4.0%
Cash-on-Cash Return
5.4%
Cap rate
0.6%
Rent to Value Ratio
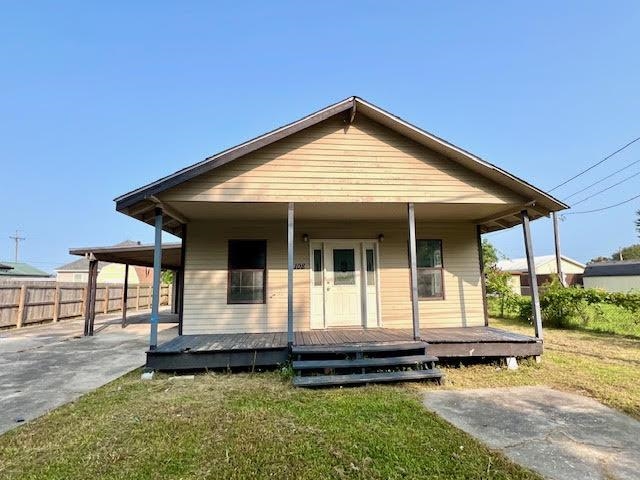
Pending
$58,000
3
bds
|
2
ba
|
1,261
sqft
|
built
1946
108 Jackson St, Houma, LA 70363
$621
Cash flow
12.5%
Cash-on-Cash Return
12.8%
Cap rate
1.6%
Rent to Value Ratio
Active
$199,900
3
bds
|
2
ba
|
1,763
sqft
|
built
1960
201 Buquet St, Houma, LA 70360
$-81
Cash flow
-2.1%
Cash-on-Cash Return
5.8%
Cap rate
0.7%
Rent to Value Ratio
Active
$199,900
3
bds
|
2
ba
|
1,757
sqft
|
built
1979
226 Glenwood Dr, Houma, LA 70363
$-81
Cash flow
-2.1%
Cash-on-Cash Return
5.8%
Cap rate
0.7%
Rent to Value Ratio
Active
$226,900
3
bds
|
2
ba
|
1,592
sqft
|
built
1998
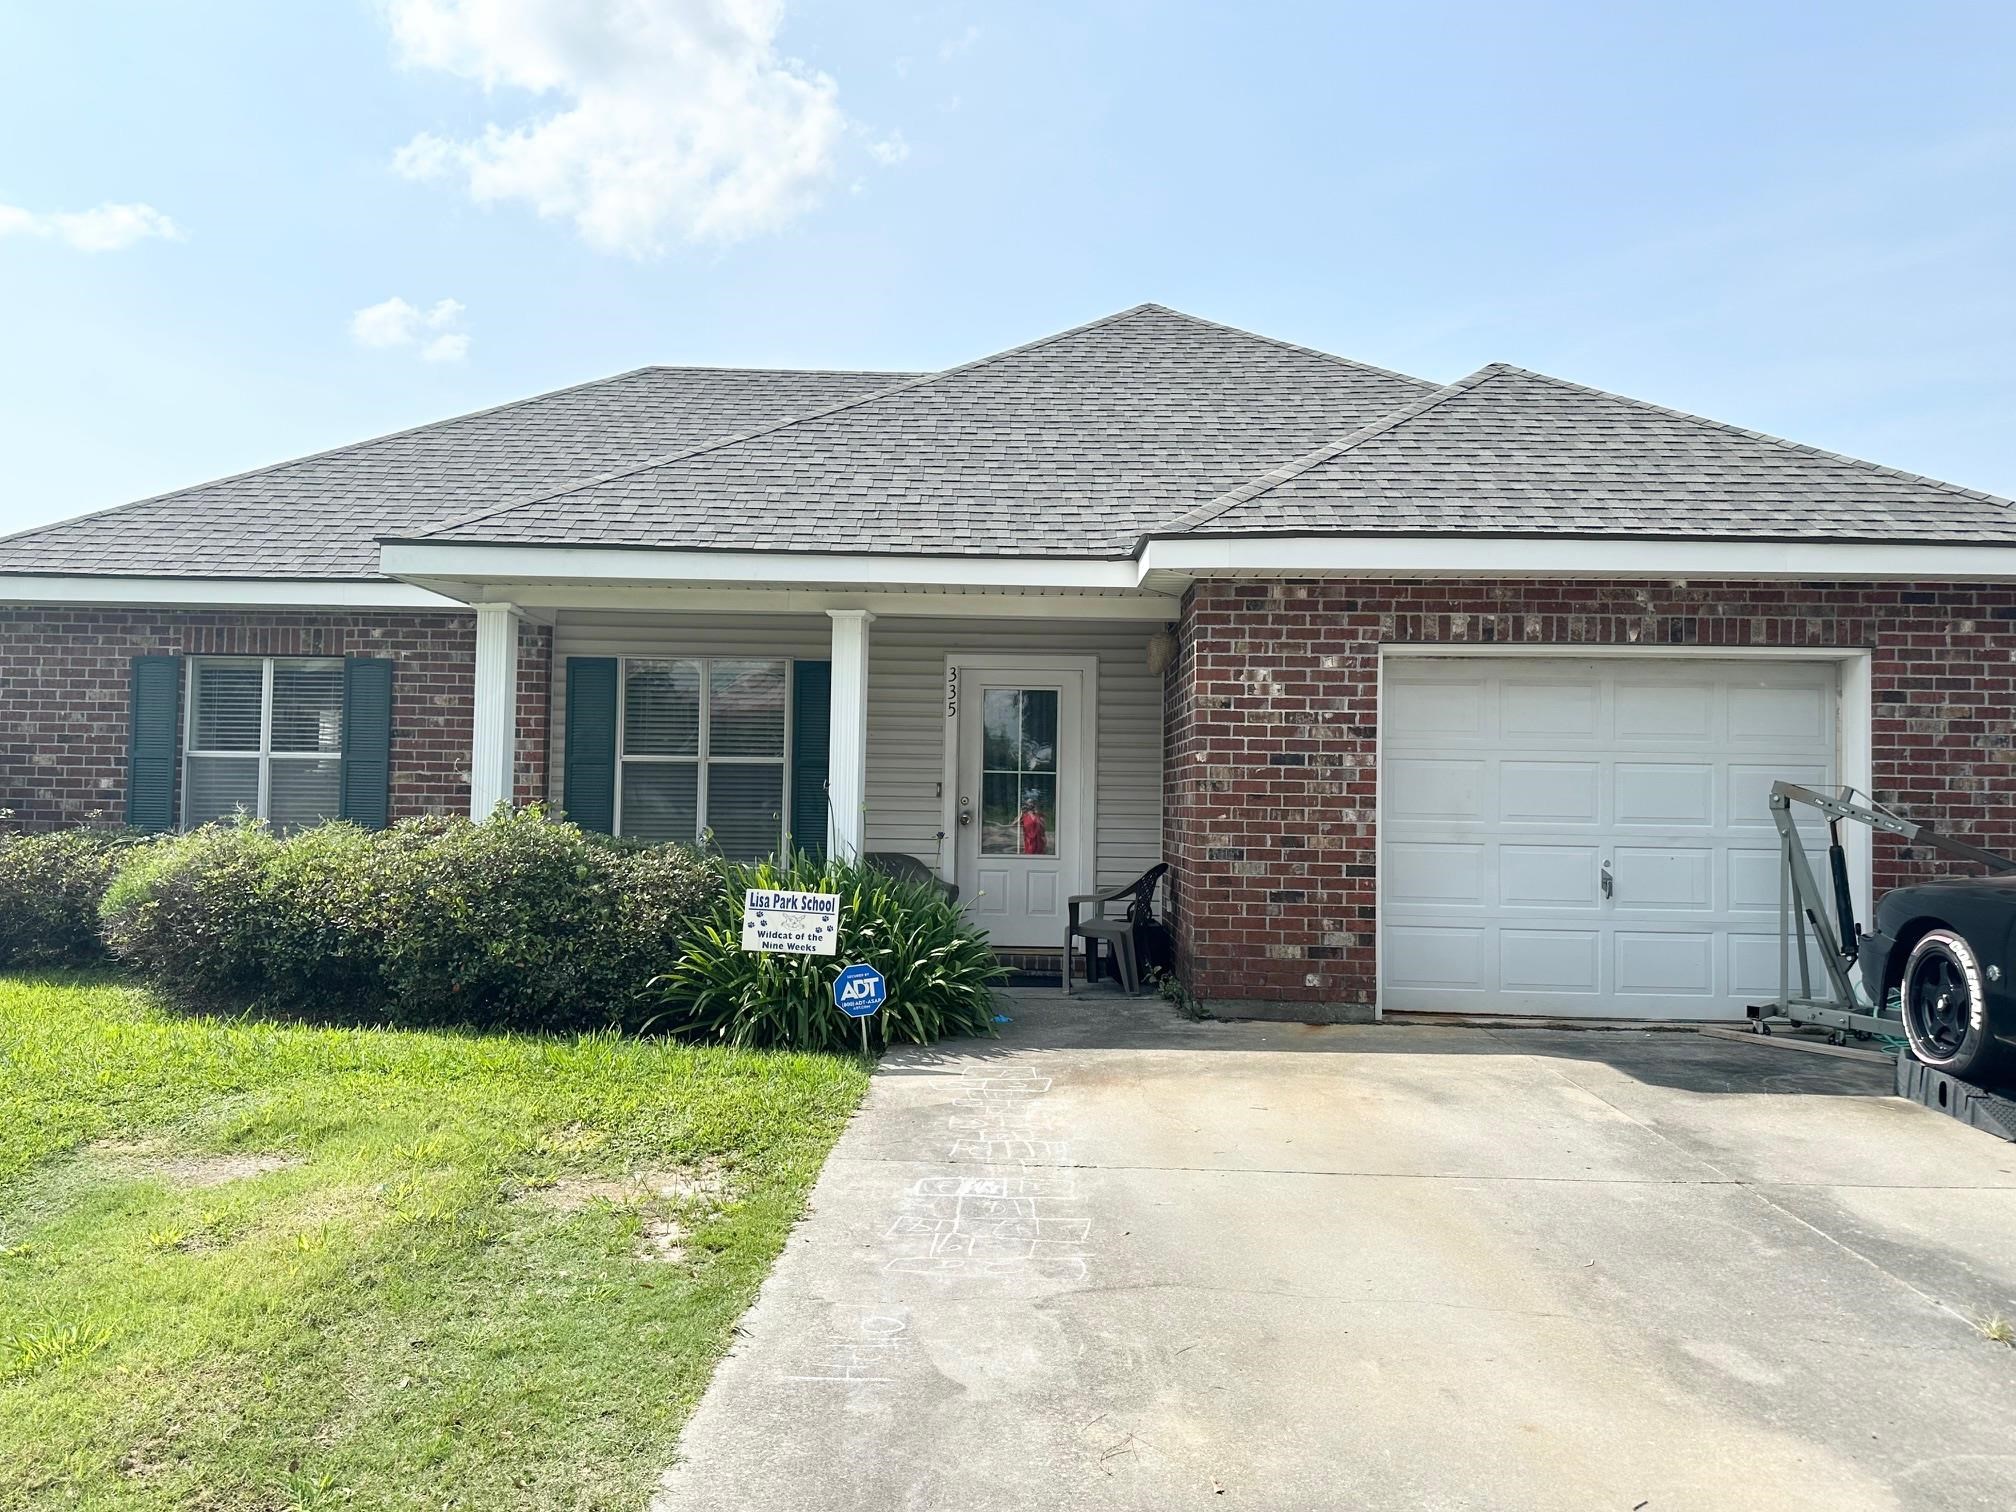
335 Monarch Dr, Houma, LA 70364
$-222
Cash flow
-5.1%
Cash-on-Cash Return
5.1%
Cap rate
0.6%
Rent to Value Ratio