Cook County Investment Properties for Sale
Browse homes for sale and investment properties in Cook County. Refine your search by price, property type, or more.
Best cash flowing properties in Cook County
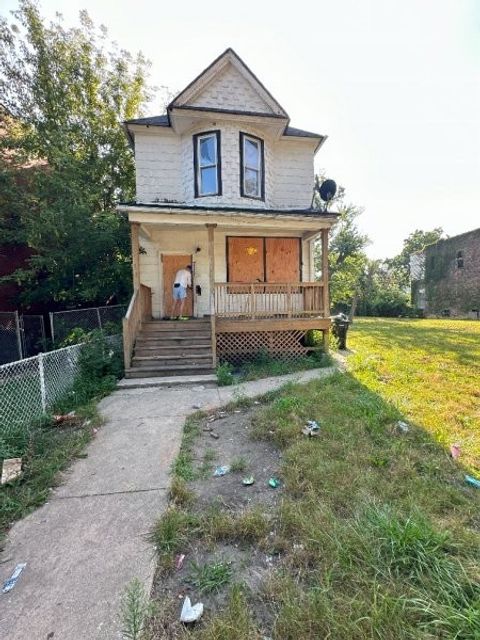
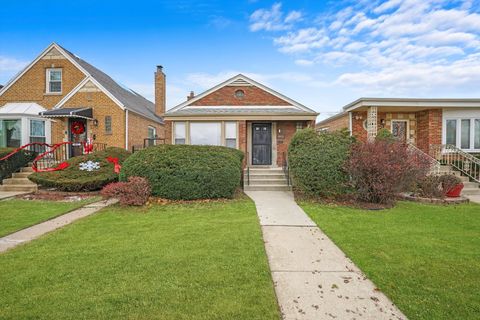
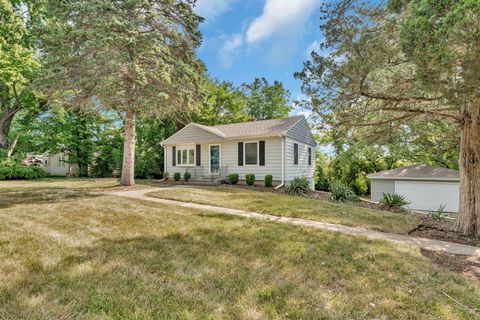
Active
$74,900
4
bds
|
2
ba
|
0
sqft
|
built
1895
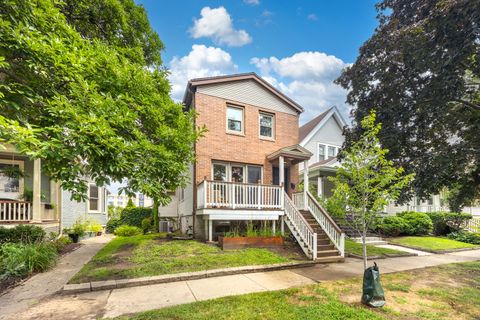
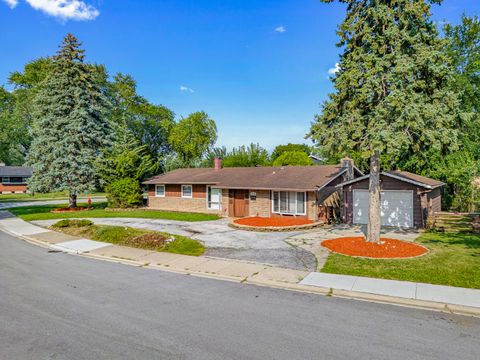
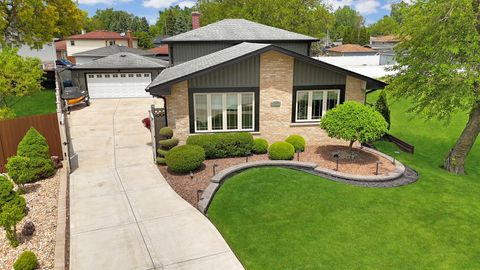
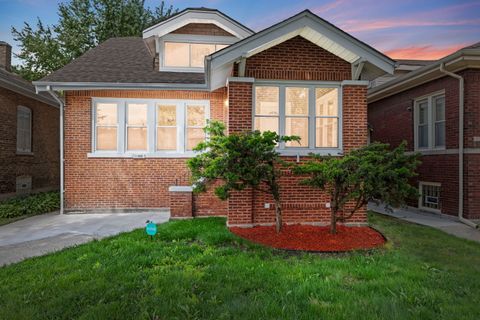
7119 S Emerald Ave, Chicago, IL 60621
$1,655
Cash flow
25.7%
Cash-on-Cash Return
26.5%
Cap rate
3.3%
Rent to Value Ratio
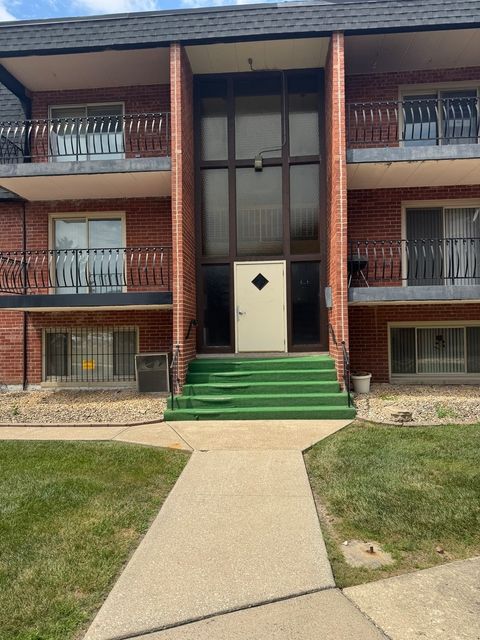
Active
$69,900
1
bds
|
1
ba
|
0
sqft
|
built
1978
3012 171st St, Hazel Crest, IL 60429
$659
Cash flow
11.0%
Cash-on-Cash Return
11.3%
Cap rate
2.0%
Rent to Value Ratio
4,811 out of 5,592 properties for sale in Cook County
Limited Results Shown
Create a free account, or log in to reveal all property listings and enjoy the complete experience.
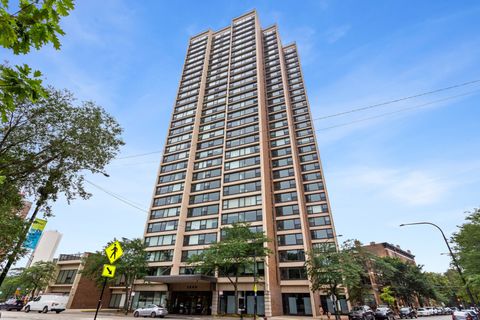
Active
$305,000
1
bds
|
1
ba
|
800
sqft
|
built
1974
1850 N Clark St, Chicago, IL 60614
$-841
Cash flow
-14.4%
Cash-on-Cash Return
2.4%
Cap rate
0.8%
Rent to Value Ratio
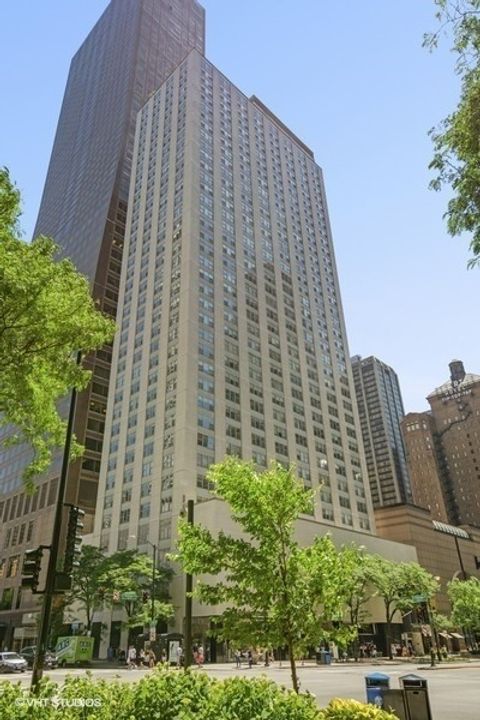
Active
$180,000
bds
|
1
ba
|
600
sqft
|
built
1969
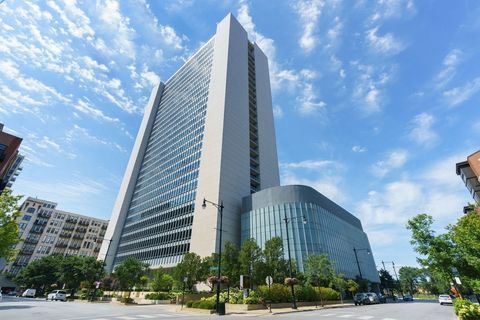
777 N Michigan Ave, Chicago, IL 60611
$-400
Cash flow
-11.6%
Cash-on-Cash Return
3.0%
Cap rate
1.1%
Rent to Value Ratio
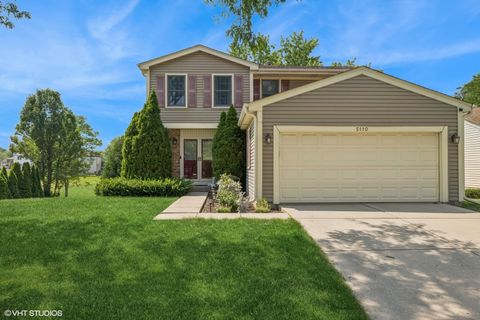
Active
$425,000
3
bds
|
2
ba
|
1,600
sqft
|
built
1978
5110 Chambers Dr, Hoffman Estates, IL 60010
$-743
Cash flow
-9.1%
Cash-on-Cash Return
3.6%
Cap rate
0.7%
Rent to Value Ratio
Active
$139,000
2
bds
|
1
ba
|
780
sqft
|
built
1980
11000 Central Ave, Chicago Ridge, IL 60415
$-71
Cash flow
-2.7%
Cash-on-Cash Return
5.1%
Cap rate
1.2%
Rent to Value Ratio
Active
$300,000
1
bds
|
1
ba
|
0
sqft
|
built
1928
807 Church St, Evanston, IL 60201
$-753
Cash flow
-13.1%
Cash-on-Cash Return
2.7%
Cap rate
0.7%
Rent to Value Ratio
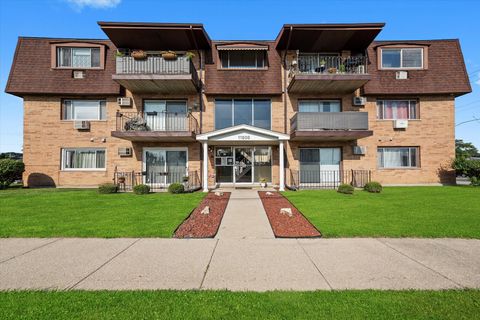
Active
$160,000
5
bds
|
2
ba
|
1,483
sqft
|
built
1927
69 E 159th St, Harvey, IL 60426
$489
Cash flow
15.9%
Cash-on-Cash Return
9.3%
Cap rate
1.4%
Rent to Value Ratio
Active
$375,000
2
bds
|
2
ba
|
1,423
sqft
|
built
1879
114 Elgin Ave, Forest Park, IL 60130
$-418
Cash flow
-5.8%
Cash-on-Cash Return
4.3%
Cap rate
0.9%
Rent to Value Ratio
Active
$775,000
5
bds
|
3
ba
|
3,176
sqft
|
built
1977
6527 Maple St, Morton Grove, IL 60053
$-1,657
Cash flow
-11.2%
Cash-on-Cash Return
3.1%
Cap rate
0.6%
Rent to Value Ratio
Active
$290,000
4
bds
|
1
ba
|
1,800
sqft
|
built
1927
1036 S 12th Ave, Maywood, IL 60153
$516
Cash flow
9.3%
Cash-on-Cash Return
7.8%
Cap rate
1.1%
Rent to Value Ratio
Active
$295,000
3
bds
|
2
ba
|
1,925
sqft
|
built
1999
39 E 89th St, Chicago, IL 60619
$-14
Cash flow
-0.2%
Cash-on-Cash Return
5.6%
Cap rate
0.9%
Rent to Value Ratio
Active
$189,900
3
bds
|
2
ba
|
1,785
sqft
|
built
1964
15615 Avalon Ave, South Holland, IL 60473
$400
Cash flow
11.0%
Cash-on-Cash Return
8.2%
Cap rate
1.5%
Rent to Value Ratio
Active
$285,000
3
bds
|
2
ba
|
1,375
sqft
|
built
1953
3541 Washington St, Lansing, IL 60438
$-574
Cash flow
-10.5%
Cash-on-Cash Return
3.3%
Cap rate
0.7%
Rent to Value Ratio
Active
$220,000
2
bds
|
2
ba
|
1,168
sqft
|
built
1908
6544 S Paulina St, Chicago, IL 60636
$339
Cash flow
8.0%
Cash-on-Cash Return
7.5%
Cap rate
0.9%
Rent to Value Ratio
Active
$229,900
4
bds
|
3
ba
|
0
sqft
|
built
1906
6841 S Bishop St, Chicago, IL 60636
$41
Cash flow
0.9%
Cash-on-Cash Return
5.9%
Cap rate
0.7%
Rent to Value Ratio
Active
$300,000
3
bds
|
2
ba
|
0
sqft
|
built
1953
8941 S Luella Ave, Chicago, IL 60617
$93
Cash flow
1.6%
Cash-on-Cash Return
6.1%
Cap rate
0.8%
Rent to Value Ratio
Active
$315,000
2
bds
|
1
ba
|
1,000
sqft
|
built
1925
4502 N Sacramento Ave, Chicago, IL 60625
$-726
Cash flow
-12.0%
Cash-on-Cash Return
2.9%
Cap rate
0.7%
Rent to Value Ratio
Active
$265,000
2
bds
|
1
ba
|
0
sqft
|
built
1917
1225 W Greenleaf Ave, Chicago, IL 60626
$-500
Cash flow
-9.8%
Cash-on-Cash Return
3.4%
Cap rate
0.8%
Rent to Value Ratio
Active
$275,000
4
bds
|
2
ba
|
0
sqft
|
built
1908
720 E 92nd Pl, Chicago, IL 60619
$-217
Cash flow
-4.1%
Cash-on-Cash Return
4.7%
Cap rate
0.7%
Rent to Value Ratio
Active
$1,650,000
4
bds
|
5
ba
|
6,089
sqft
|
built
2021
1110 Hickory Dr, Western Springs, IL 60558
$-4,200
Cash flow
-13.3%
Cash-on-Cash Return
2.6%
Cap rate
0.5%
Rent to Value Ratio
Active
$249,000
4
bds
|
1
ba
|
1,108
sqft
|
built
1940
10327 S Calumet Ave, Chicago, IL 60628
$205
Cash flow
4.3%
Cash-on-Cash Return
6.7%
Cap rate
0.9%
Rent to Value Ratio
Active
$438,000
4
bds
|
2
ba
|
1,900
sqft
|
built
1960
943 Maple Ln, Elk Grove Village, IL 60007
$-824
Cash flow
-9.8%
Cash-on-Cash Return
3.4%
Cap rate
0.6%
Rent to Value Ratio
Active
$275,000
3
bds
|
2
ba
|
969
sqft
|
built
1963
9553 S Perry Ave, Chicago, IL 60628
$-263
Cash flow
-5.0%
Cash-on-Cash Return
4.5%
Cap rate
0.6%
Rent to Value Ratio
Active
$429,900
4
bds
|
2
ba
|
1,330
sqft
|
built
1987
4690 W 130th Ct, Alsip, IL 60803
$-988
Cash flow
-12.0%
Cash-on-Cash Return
2.9%
Cap rate
0.6%
Rent to Value Ratio
Active
$499,900
4
bds
|
3
ba
|
2,500
sqft
|
built
1997
5724 W 82nd Pl, Burbank, IL 60459
$-999
Cash flow
-10.4%
Cash-on-Cash Return
3.3%
Cap rate
0.6%
Rent to Value Ratio
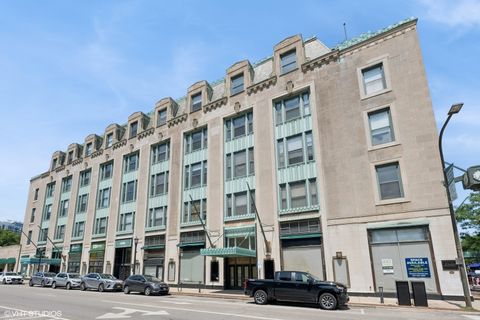
Active
$525,000
1
bds
|
2
ba
|
1,089
sqft
|
built
2006
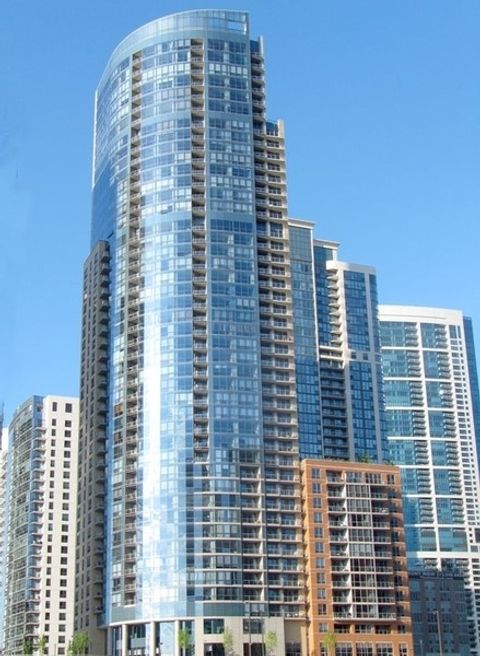
420 E Waterside Dr, Chicago, IL 60601
$-2,008
Cash flow
-20.0%
Cash-on-Cash Return
1.1%
Cap rate
0.6%
Rent to Value Ratio
Active
$699,000
4
bds
|
4
ba
|
2,100
sqft
|
built
1906
3638 N Kedzie Ave, Chicago, IL 60618
$-1,281
Cash flow
-9.6%
Cash-on-Cash Return
3.5%
Cap rate
0.7%
Rent to Value Ratio
Active
$339,850
3
bds
|
2
ba
|
1,250
sqft
|
built
1950
1107 S Hough St, Barrington, IL 60010
$-70
Cash flow
-1.1%
Cash-on-Cash Return
5.4%
Cap rate
0.9%
Rent to Value Ratio
Active
$249,000
2
bds
|
2
ba
|
1,177
sqft
|
built
1978
1860 W Surrey Park Ln, Arlington Heights, IL 60005
$-479
Cash flow
-10.0%
Cash-on-Cash Return
3.4%
Cap rate
0.7%
Rent to Value Ratio
Active
$415,000
4
bds
|
2
ba
|
1,652
sqft
|
built
1911
3206 Highland Ave, Berwyn, IL 60402
$-728
Cash flow
-9.2%
Cash-on-Cash Return
3.6%
Cap rate
0.7%
Rent to Value Ratio
Active
$399,900
3
bds
|
3
ba
|
1,848
sqft
|
built
1878
656 E Bowen Ave, Chicago, IL 60653
$82
Cash flow
1.1%
Cash-on-Cash Return
5.9%
Cap rate
0.9%
Rent to Value Ratio
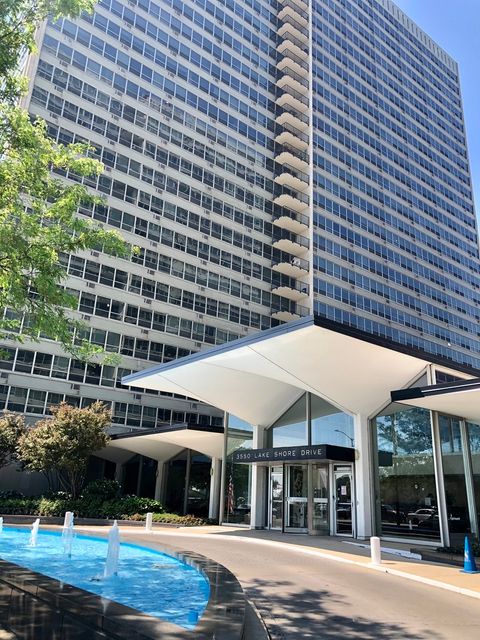
Active
$312,500
2
bds
|
2
ba
|
1,250
sqft
|
built
1962
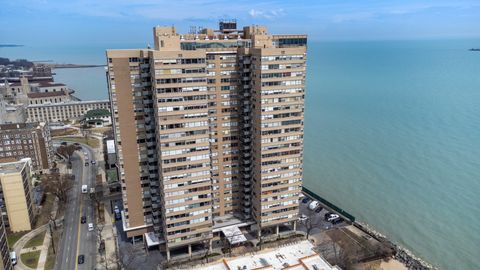
3550 N Lake Shore Dr, Chicago, IL 60657
$-793
Cash flow
-13.2%
Cash-on-Cash Return
2.6%
Cap rate
1.0%
Rent to Value Ratio
Active
$49,900
1
bds
|
1
ba
|
750
sqft
|
built
1923
7205 S Yates Blvd, Chicago, IL 60649
$553
Cash flow
12.9%
Cash-on-Cash Return
13.3%
Cap rate
2.8%
Rent to Value Ratio
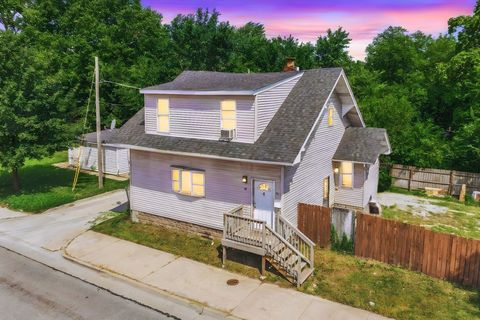
Active
$125,000
3
bds
|
1
ba
|
1,247
sqft
|
built
1927
15515 Marshfield Ave, Harvey, IL 60426
$653
Cash flow
27.3%
Cash-on-Cash Return
12.0%
Cap rate
1.6%
Rent to Value Ratio
Active
$375,000
3
bds
|
2
ba
|
0
sqft
|
built
1927
1217 Hull Ter, Evanston, IL 60202
$-1,157
Cash flow
-16.1%
Cash-on-Cash Return
2.0%
Cap rate
0.6%
Rent to Value Ratio
Active
$425,000
2
bds
|
2
ba
|
1,170
sqft
|
built
1972
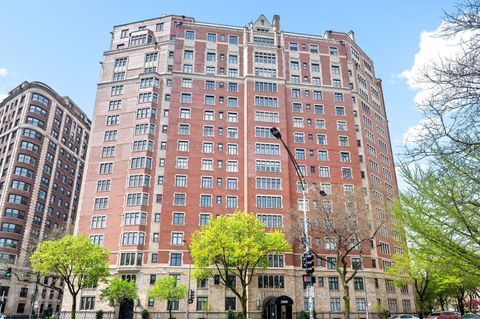
500 W Superior St, Chicago, IL 60654
$-1,488
Cash flow
-18.3%
Cash-on-Cash Return
1.5%
Cap rate
1.0%
Rent to Value Ratio
Active
$179,000
1
bds
|
1
ba
|
800
sqft
|
built
1960
6301 N Sheridan Rd, Chicago, IL 60660
$-477
Cash flow
-13.9%
Cash-on-Cash Return
2.5%
Cap rate
1.1%
Rent to Value Ratio
Active
$510,000
3
bds
|
2
ba
|
2,150
sqft
|
built
1927
3800 N Lake Shore Dr, Chicago, IL 60613
$-1,957
Cash flow
-20.0%
Cash-on-Cash Return
1.1%
Cap rate
0.9%
Rent to Value Ratio
Active
$339,000
5
bds
|
3
ba
|
2,005
sqft
|
built
1926
11322 S Lowe Ave, Chicago, IL 60628
$-330
Cash flow
-5.1%
Cash-on-Cash Return
4.5%
Cap rate
0.6%
Rent to Value Ratio