Cook County Investment Properties for Sale
Browse homes for sale and investment properties in Cook County. Refine your search by price, property type, or more.
Best cash flowing properties in Cook County
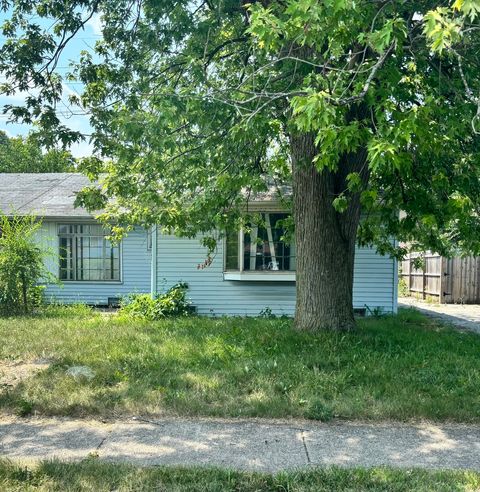
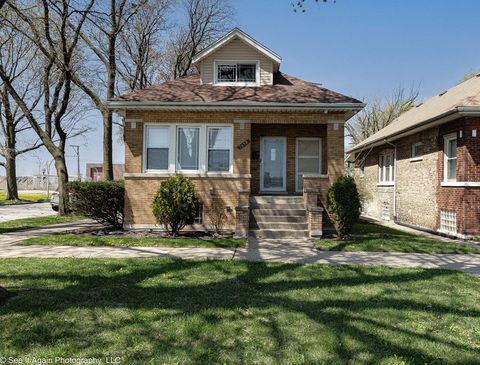
Active
$60,000
4
bds
|
2
ba
|
1,400
sqft
|
built
1955
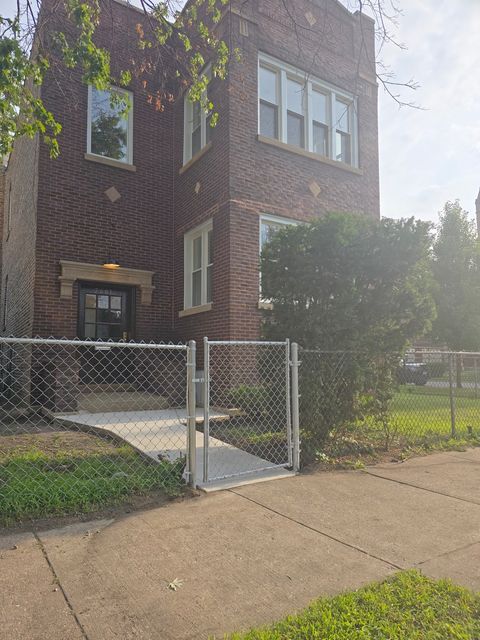
14044 S Grace Ave, Robbins, IL 60472
$1,211
Cash flow
23.5%
Cash-on-Cash Return
24.2%
Cap rate
3.3%
Rent to Value Ratio
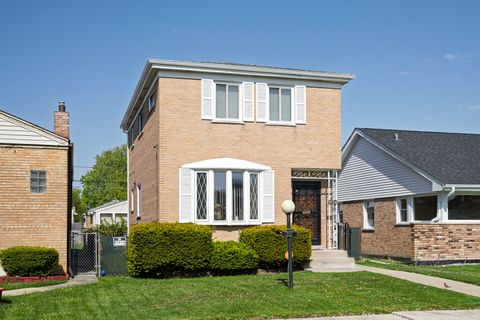
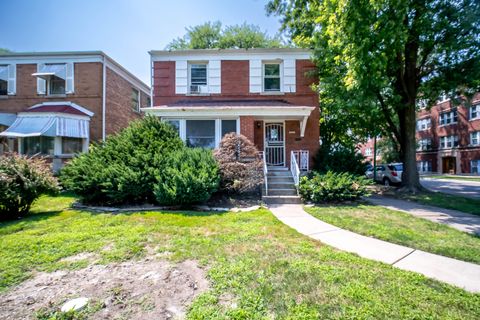
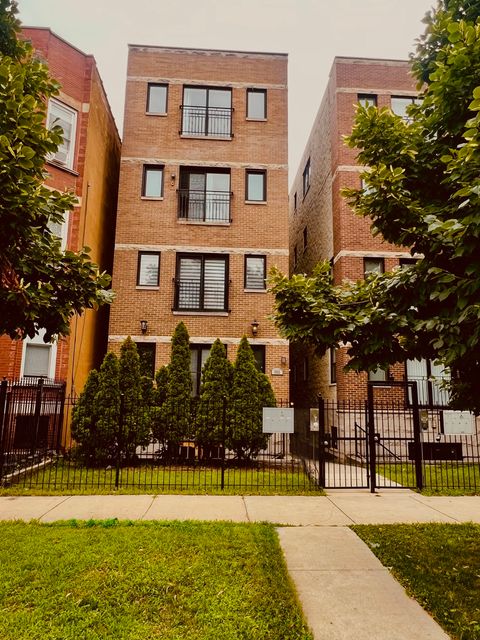
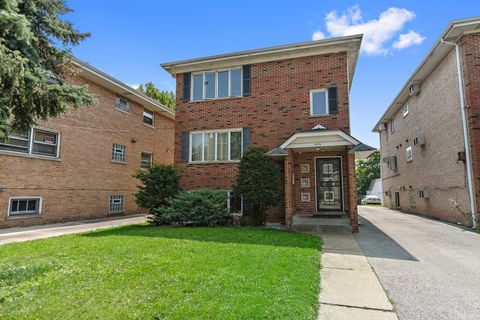
Active
$234,900
3
bds
|
2
ba
|
0
sqft
|
built
1960
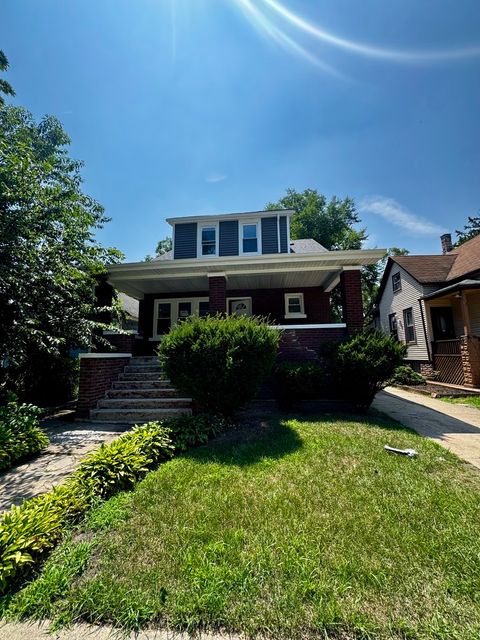
9724 S Princeton Ave, Chicago, IL 60628
$269
Cash flow
6.0%
Cash-on-Cash Return
7.1%
Cap rate
1.0%
Rent to Value Ratio
4,738 out of 5,507 properties for sale in Cook County
Limited Results Shown
Create a free account, or log in to reveal all property listings and enjoy the complete experience.
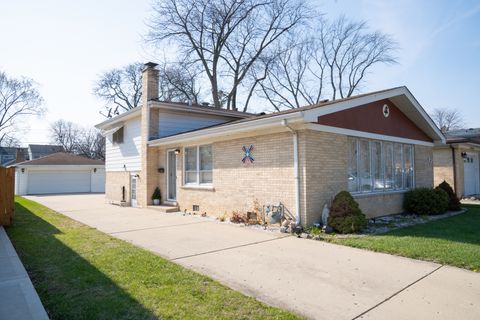
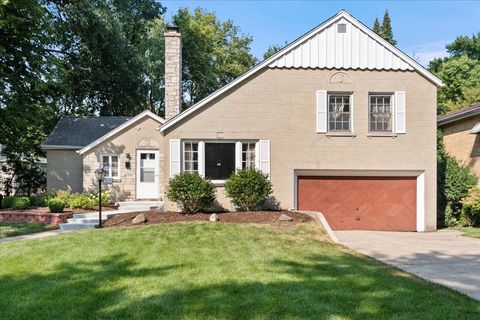
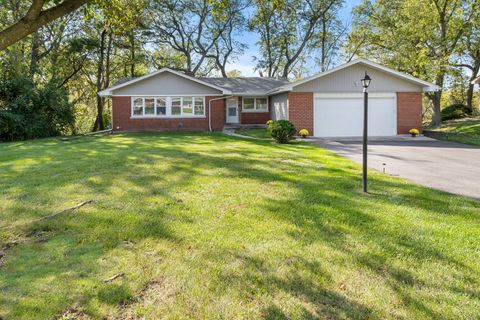
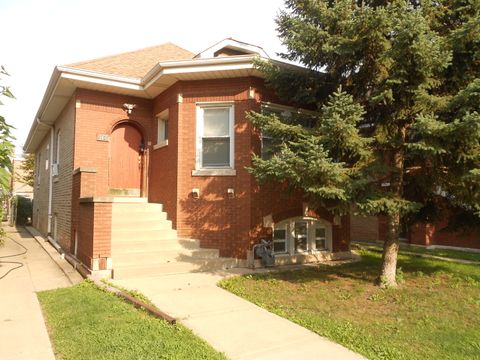
Active
$389,900
3
bds
|
2
ba
|
1,312
sqft
|
built
1965
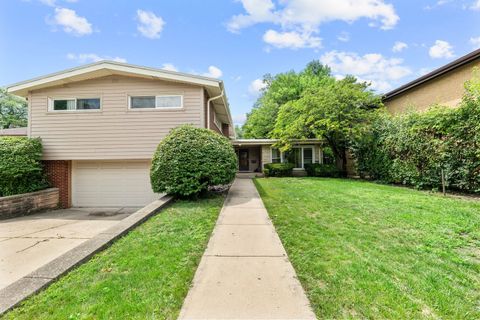
214 S Mount Prospect Rd, Mount Prospect, IL 60056
$-349
Cash flow
-4.7%
Cash-on-Cash Return
4.6%
Cap rate
0.8%
Rent to Value Ratio
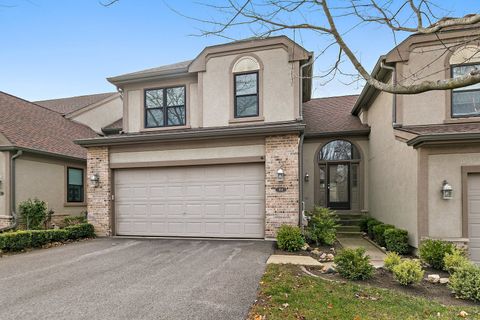
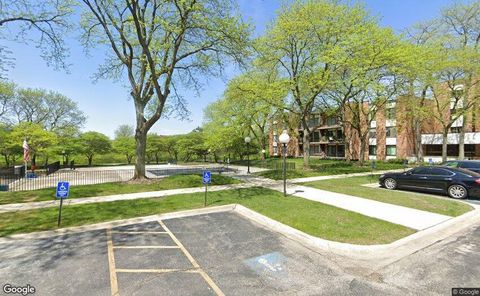
Active
$420,000
2
bds
|
3
ba
|
2,030
sqft
|
built
1987
164 Chatsworth Cir, Schaumburg, IL 60194
$-439
Cash flow
-5.5%
Cash-on-Cash Return
4.4%
Cap rate
0.8%
Rent to Value Ratio
Active
$750,000
3
bds
|
3
ba
|
2,533
sqft
|
built
1946
6745 N Leoti Ave, Chicago, IL 60646
$-1,290
Cash flow
-9.0%
Cash-on-Cash Return
3.6%
Cap rate
0.6%
Rent to Value Ratio
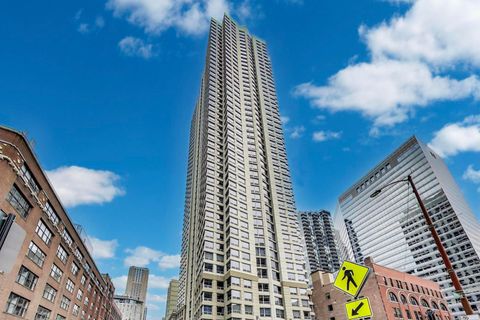
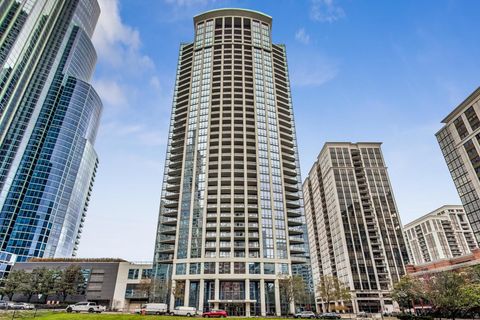
Active
$425,000
2
bds
|
2
ba
|
1,106
sqft
|
built
1992
440 N Wabash Ave, Chicago, IL 60611
$-1,009
Cash flow
-12.4%
Cash-on-Cash Return
2.8%
Cap rate
0.8%
Rent to Value Ratio
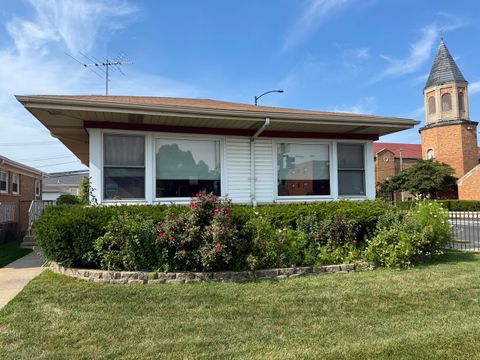
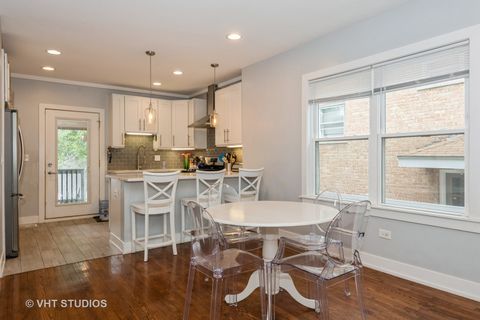
Active
$200,000
3
bds
|
1
ba
|
1,235
sqft
|
built
1947
8400 S Wabash Ave, Chicago, IL 60619
$205
Cash flow
5.3%
Cash-on-Cash Return
6.9%
Cap rate
1.0%
Rent to Value Ratio
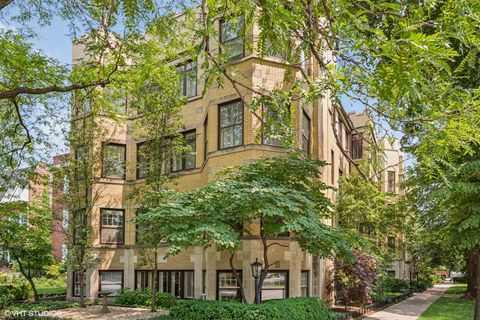
Active
$624,800
3
bds
|
3
ba
|
1,380
sqft
|
built
1955
2800 W Bryn Mawr Ave, Chicago, IL 60659
$-1,228
Cash flow
-10.3%
Cash-on-Cash Return
3.3%
Cap rate
0.6%
Rent to Value Ratio
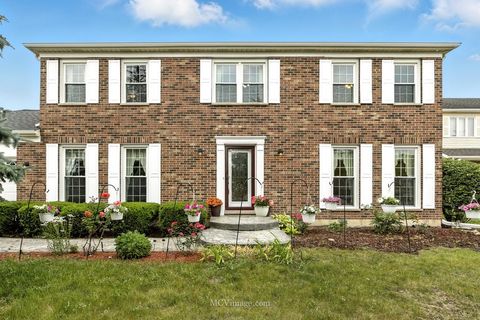
Active
$385,000
3
bds
|
3
ba
|
2,886
sqft
|
built
1955
820 Exmoor Rd, Olympia Fields, IL 60461
$-409
Cash flow
-5.5%
Cash-on-Cash Return
4.4%
Cap rate
0.9%
Rent to Value Ratio
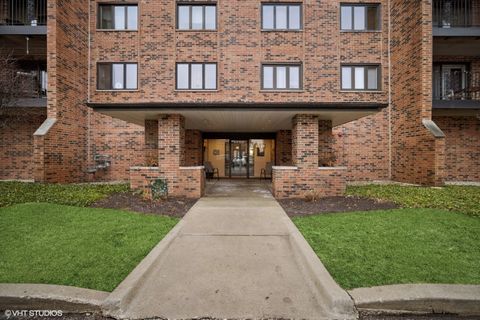
Active
$190,000
2
bds
|
2
ba
|
1,350
sqft
|
built
1973
3505 Lakeview Dr, Hazel Crest, IL 60429
$-1
Cash flow
0.0%
Cash-on-Cash Return
5.7%
Cap rate
1.2%
Rent to Value Ratio
Active
$399,000
4
bds
|
2
ba
|
1,727
sqft
|
built
1922
1409 Harlem Ave, Forest Park, IL 60130
$-474
Cash flow
-6.2%
Cash-on-Cash Return
4.3%
Cap rate
0.7%
Rent to Value Ratio
Active
$675,000
4
bds
|
3
ba
|
2,773
sqft
|
built
1986
3835 Huntington Blvd, Hoffman Estates, IL 60192
$-1,764
Cash flow
-13.6%
Cash-on-Cash Return
2.5%
Cap rate
0.5%
Rent to Value Ratio
Active
$405,000
3
bds
|
3
ba
|
1,742
sqft
|
built
2016
1529 E Arbor Ln, Arlington Heights, IL 60004
$-746
Cash flow
-9.6%
Cash-on-Cash Return
3.5%
Cap rate
0.8%
Rent to Value Ratio
Active
$4,500,000
5
bds
|
7
ba
|
6,434
sqft
|
built
2001
92 Hawthorne Rd, Barrington, IL 60010
$-19,072
Cash flow
-22.1%
Cash-on-Cash Return
0.6%
Cap rate
0.1%
Rent to Value Ratio
Active
$295,000
3
bds
|
2
ba
|
1,700
sqft
|
built
1981
1991 N Williamsburg Dr, Palatine, IL 60074
$-416
Cash flow
-7.4%
Cash-on-Cash Return
4.0%
Cap rate
0.8%
Rent to Value Ratio
Active
$115,000
1
bds
|
1
ba
|
700
sqft
|
built
1968
7234 W North Ave, Elmwood Park, IL 60707
$-264
Cash flow
-12.0%
Cash-on-Cash Return
2.9%
Cap rate
1.4%
Rent to Value Ratio
Active
$334,900
3
bds
|
2
ba
|
1,584
sqft
|
built
2007
4931 S Prairie Ave, Chicago, IL 60615
$-192
Cash flow
-3.0%
Cash-on-Cash Return
5.0%
Cap rate
0.8%
Rent to Value Ratio
Active
$385,000
3
bds
|
2
ba
|
1,916
sqft
|
built
1929
6507 S Vernon Ave, Chicago, IL 60637
$-492
Cash flow
-6.7%
Cash-on-Cash Return
4.1%
Cap rate
0.5%
Rent to Value Ratio
Active
$230,000
4
bds
|
3
ba
|
792
sqft
|
built
1881
6505 S Hamilton Ave, Chicago, IL 60636
$97
Cash flow
2.2%
Cash-on-Cash Return
6.2%
Cap rate
0.8%
Rent to Value Ratio
Active
$449,900
5
bds
|
2
ba
|
0
sqft
|
built
1911
1024 N Lawler Ave, Chicago, IL 60651
$-1,189
Cash flow
-13.8%
Cash-on-Cash Return
2.5%
Cap rate
0.4%
Rent to Value Ratio
Active
$182,000
1
bds
|
1
ba
|
1,000
sqft
|
built
1927
1302 E 56th St, Chicago, IL 60637
$-211
Cash flow
-6.0%
Cash-on-Cash Return
4.3%
Cap rate
1.1%
Rent to Value Ratio
Active
$435,000
2
bds
|
2
ba
|
1,445
sqft
|
built
1982
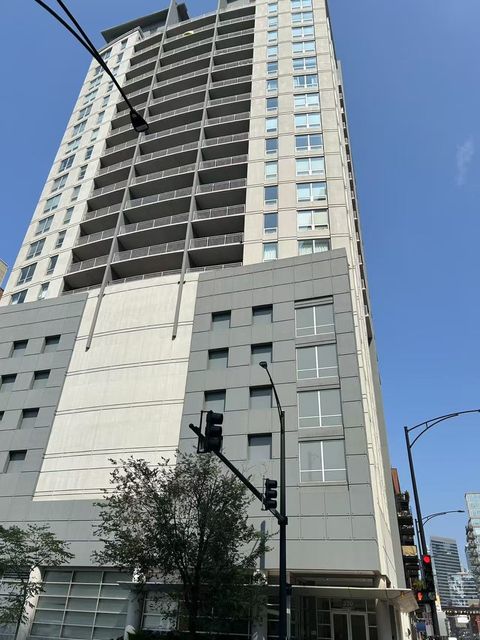
400 E Ohio St, Chicago, IL 60611
$-1,555
Cash flow
-18.7%
Cash-on-Cash Return
1.4%
Cap rate
0.8%
Rent to Value Ratio
Active
$325,000
2
bds
|
1
ba
|
1,200
sqft
|
built
2006
6000 N Cicero Ave, Chicago, IL 60646
$-658
Cash flow
-10.6%
Cash-on-Cash Return
3.2%
Cap rate
0.8%
Rent to Value Ratio
Active
$375,000
3
bds
|
2
ba
|
1,700
sqft
|
built
1968
5201 S Cornell Ave, Chicago, IL 60615
$-1,126
Cash flow
-15.7%
Cash-on-Cash Return
2.1%
Cap rate
1.0%
Rent to Value Ratio
Active
$374,900
2
bds
|
2
ba
|
1,100
sqft
|
built
2005
330 W Grand Ave, Chicago, IL 60654
$-960
Cash flow
-13.4%
Cash-on-Cash Return
2.6%
Cap rate
0.8%
Rent to Value Ratio
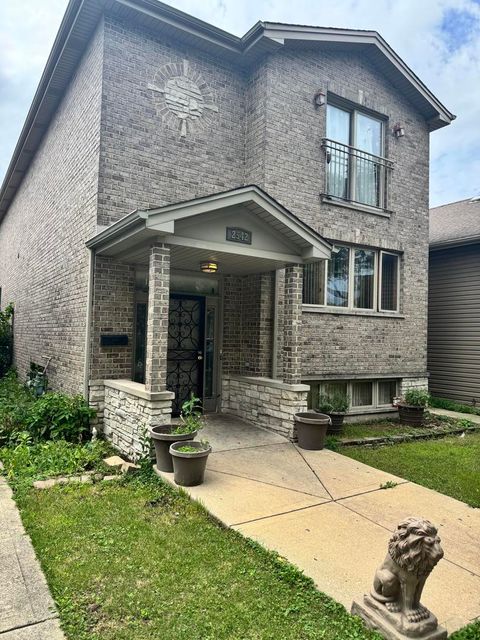
Active
$515,250
4
bds
|
4
ba
|
2,950
sqft
|
built
2008
2542 Budd St, River Grove, IL 60171
$-919
Cash flow
-9.3%
Cash-on-Cash Return
3.5%
Cap rate
0.8%
Rent to Value Ratio
Active
$399,000
3
bds
|
2
ba
|
1,265
sqft
|
built
1961
3652 Hawthorne St, Franklin Park, IL 60131
$-481
Cash flow
-6.3%
Cash-on-Cash Return
4.2%
Cap rate
0.7%
Rent to Value Ratio
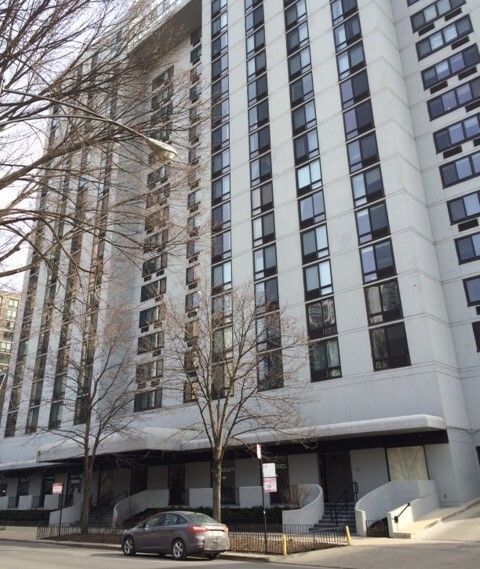
Active
$299,900
2
bds
|
2
ba
|
1,000
sqft
|
built
1972
1221 N Dearborn St, Chicago, IL 60610
$-693
Cash flow
-12.1%
Cash-on-Cash Return
2.9%
Cap rate
1.0%
Rent to Value Ratio
Active
$450,000
2
bds
|
1
ba
|
1,300
sqft
|
built
1997
1411 N Wells St, Chicago, IL 60610
$-765
Cash flow
-8.9%
Cash-on-Cash Return
3.6%
Cap rate
0.8%
Rent to Value Ratio
Active
$319,000
1
bds
|
1
ba
|
966
sqft
|
built
2008
1235 S Prairie Ave, Chicago, IL 60605
$-591
Cash flow
-9.7%
Cash-on-Cash Return
3.5%
Cap rate
0.9%
Rent to Value Ratio
Active
$325,000
8
bds
|
6
ba
|
0
sqft
|
built
1974
1955 Vermont St, Blue Island, IL 60406
$-840
Cash flow
-13.5%
Cash-on-Cash Return
2.6%
Cap rate
0.7%
Rent to Value Ratio
Active
$285,000
3
bds
|
4
ba
|
1,800
sqft
|
built
1923
7658 S Lafayette Ave, Chicago, IL 60620
$-39
Cash flow
-0.7%
Cash-on-Cash Return
5.5%
Cap rate
0.8%
Rent to Value Ratio
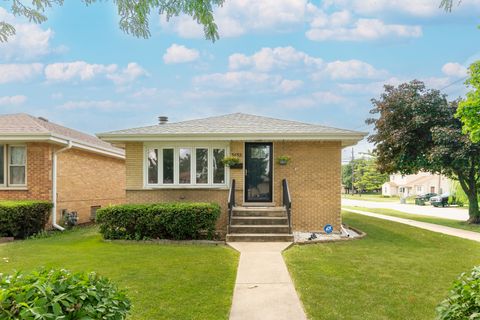
Active
$675,000
4
bds
|
4
ba
|
3,065
sqft
|
built
1955
9016 Kilbourn Ave, Skokie, IL 60076
$-804
Cash flow
-6.2%
Cash-on-Cash Return
4.2%
Cap rate
0.7%
Rent to Value Ratio
Active
$315,000
6
bds
|
3
ba
|
2,051
sqft
|
built
1920
317 E 136th Pl, Chicago, IL 60827
$-306
Cash flow
-5.1%
Cash-on-Cash Return
4.5%
Cap rate
0.6%
Rent to Value Ratio
Active
$424,900
6
bds
|
2
ba
|
0
sqft
|
built
1918
2601 E 78th St, Chicago, IL 60649
$-1,221
Cash flow
-15.0%
Cash-on-Cash Return
2.2%
Cap rate
0.3%
Rent to Value Ratio
Active
$229,000
2
bds
|
1
ba
|
1,000
sqft
|
built
1905
4050 W Cullerton St, Chicago, IL 60623
$139
Cash flow
3.2%
Cash-on-Cash Return
6.4%
Cap rate
0.8%
Rent to Value Ratio
Active
$335,000
5
bds
|
2
ba
|
1,325
sqft
|
built
1927
1813 S 59th Ave, Cicero, IL 60804
$-422
Cash flow
-6.6%
Cash-on-Cash Return
4.2%
Cap rate
0.7%
Rent to Value Ratio
Active
$315,000
2
bds
|
2
ba
|
1,254
sqft
|
built
1925
131 Kedzie St, Evanston, IL 60202
$-734
Cash flow
-12.2%
Cash-on-Cash Return
2.9%
Cap rate
0.9%
Rent to Value Ratio
Active
$229,900
2
bds
|
2
ba
|
1,391
sqft
|
built
1982
9377 Landings Ln, Des Plaines, IL 60016
$-377
Cash flow
-8.6%
Cash-on-Cash Return
3.7%
Cap rate
0.9%
Rent to Value Ratio
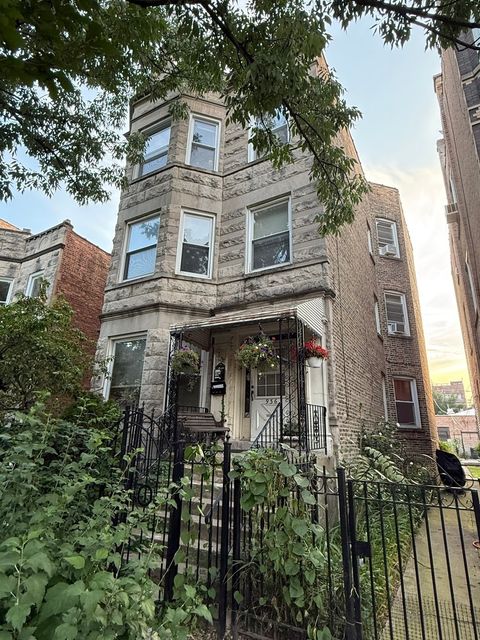
Active
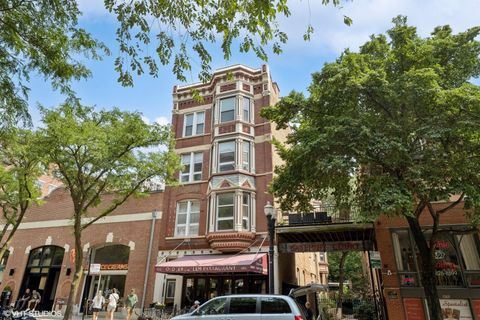
$1,300,000
7
bds
|
3
ba
|
0
sqft
|
built
1898
936 N Fairfield Ave, Chicago, IL 60622
$-5,273
Cash flow
-21.2%
Cash-on-Cash Return
0.8%
Cap rate
0.2%
Rent to Value Ratio