Cook County Investment Properties for Sale
Browse homes for sale and investment properties in Cook County. Refine your search by price, property type, or more.
Best cash flowing properties in Cook County

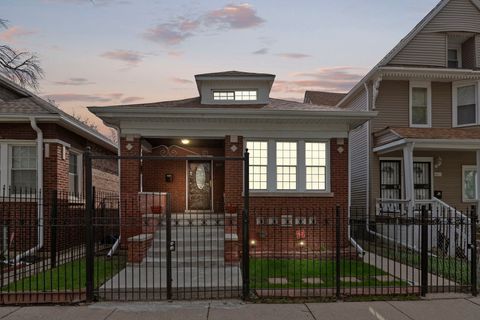
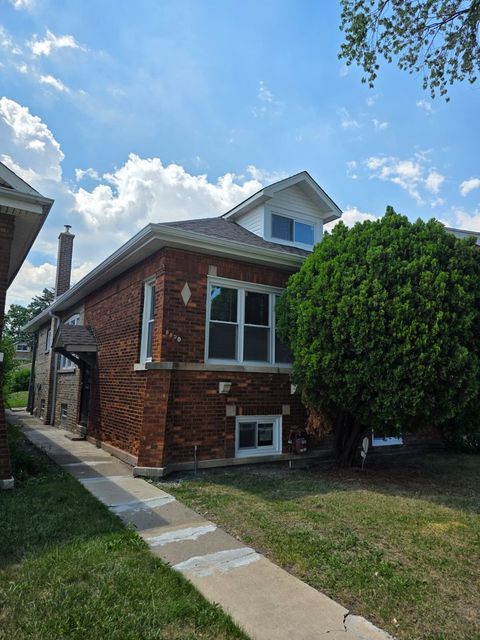
Active
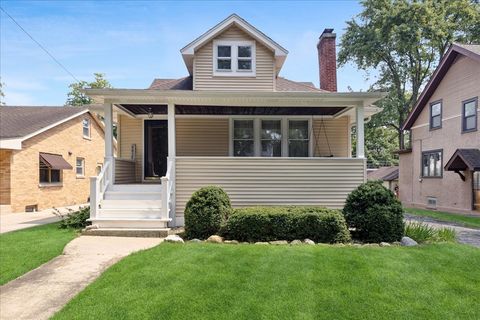
$75,000
4
bds
|
2
ba
|
0
sqft
|
built
1923
7431 S Dante Ave, Chicago, IL 60619
$725
Cash flow
50.4%
Cash-on-Cash Return
17.3%
Cap rate
2.7%
Rent to Value Ratio

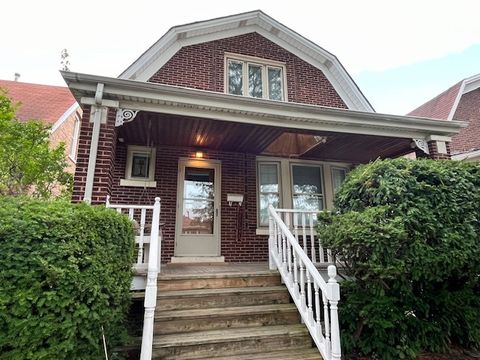
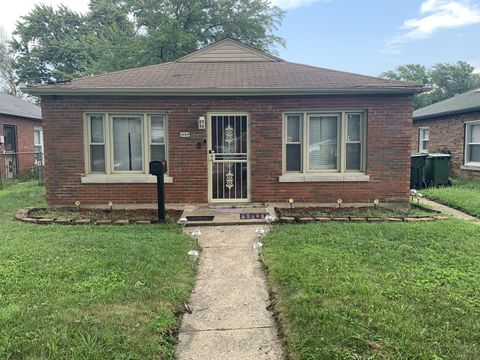
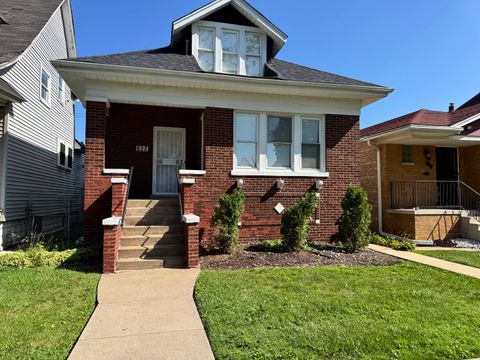
Active
$139,999
3
bds
|
1
ba
|
1,596
sqft
|
built
1910
5252 W Adams St, Chicago, IL 60644
$706
Cash flow
26.3%
Cash-on-Cash Return
11.7%
Cap rate
1.6%
Rent to Value Ratio
4,034 out of 4,728 properties for sale in Cook County
Limited Results Shown
Create a free account, or log in to reveal all property listings and enjoy the complete experience.
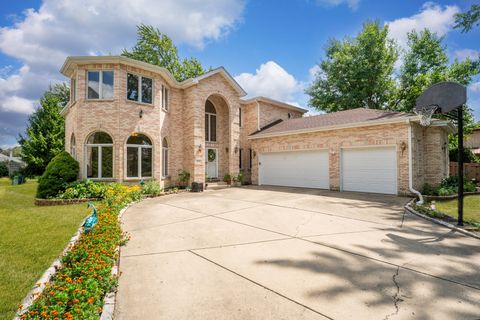
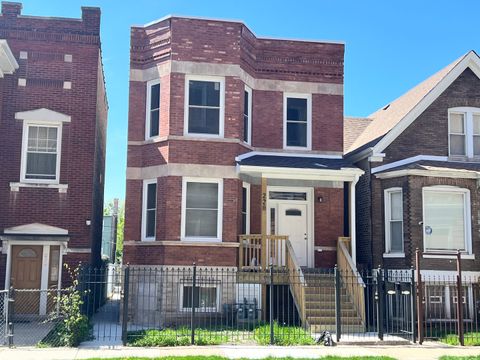
Active
$990,000
4
bds
|
4
ba
|
4,015
sqft
|
built
1999
1007 Wildwood Ln, Mount Prospect, IL 60056
$-2,738
Cash flow
-14.4%
Cash-on-Cash Return
2.4%
Cap rate
0.5%
Rent to Value Ratio
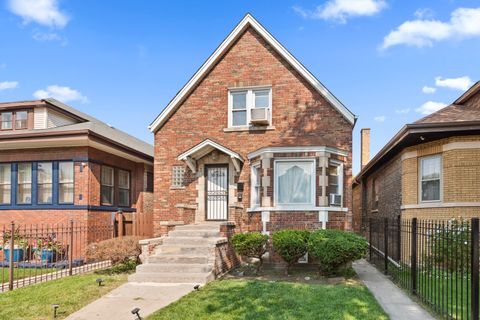
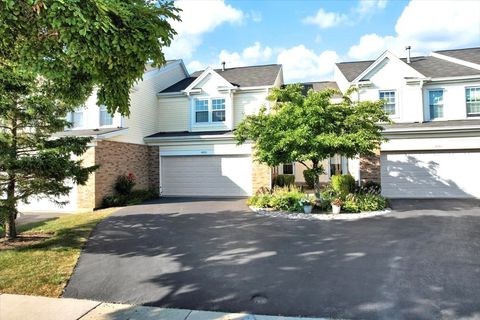
Active
$245,000
5
bds
|
2
ba
|
2,040
sqft
|
built
1950
6935 S Campbell Ave, Chicago, IL 60629
$-62
Cash flow
-1.3%
Cash-on-Cash Return
5.4%
Cap rate
0.8%
Rent to Value Ratio
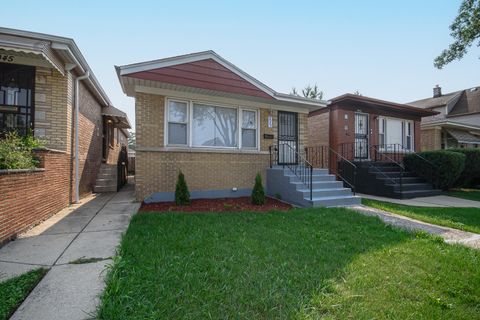
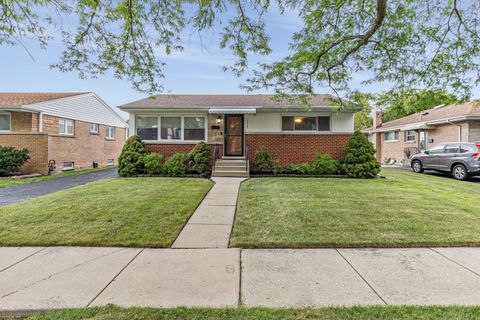
Active
$279,980
3
bds
|
2
ba
|
1,085
sqft
|
built
1960
9049 S Parnell Ave, Chicago, IL 60620
$-77
Cash flow
-1.4%
Cash-on-Cash Return
5.3%
Cap rate
0.7%
Rent to Value Ratio
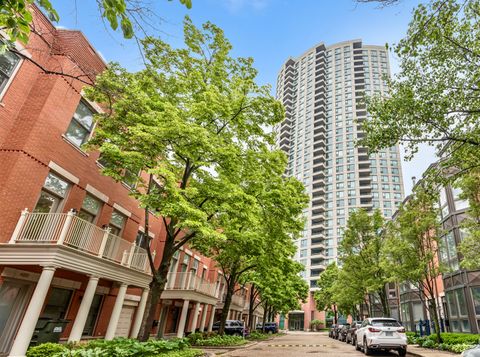
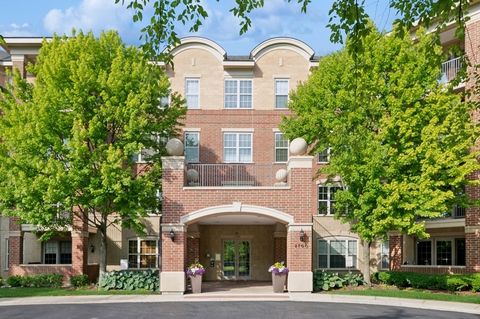
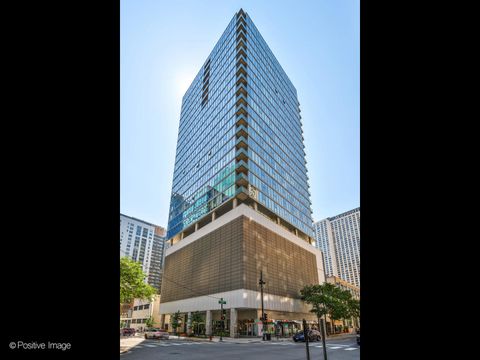
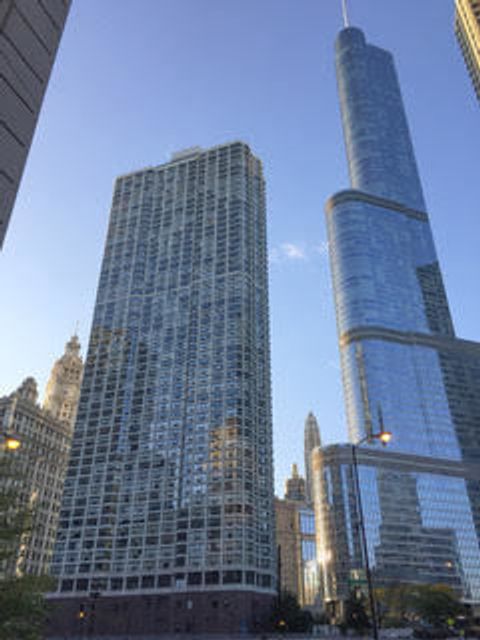
Active
$589,000
2
bds
|
2
ba
|
1,285
sqft
|
built
2000
501 N Clinton St, Chicago, IL 60654
$-1,390
Cash flow
-12.3%
Cash-on-Cash Return
2.8%
Cap rate
0.8%
Rent to Value Ratio

Active
$304,900
5
bds
|
2
ba
|
0
sqft
|
built
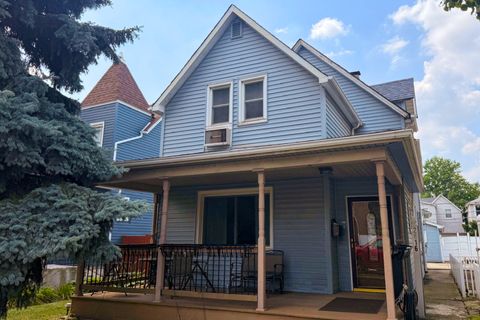
1905
1229 E 71st St, Chicago, IL 60619
$-220
Cash flow
-3.8%
Cash-on-Cash Return
4.8%
Cap rate
0.7%
Rent to Value Ratio
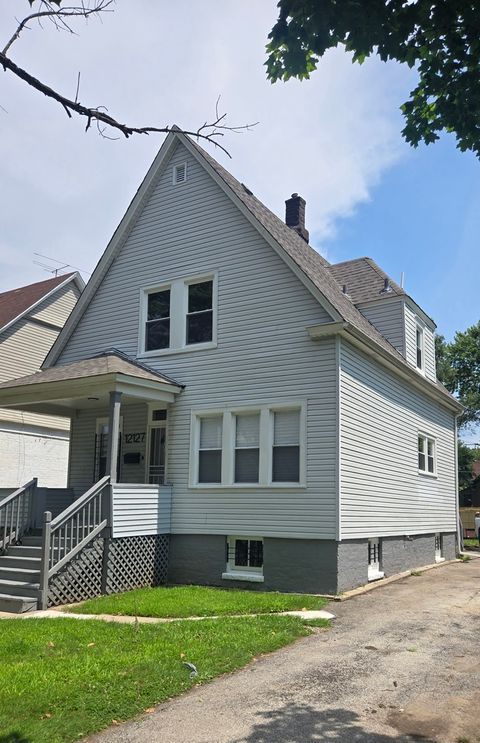
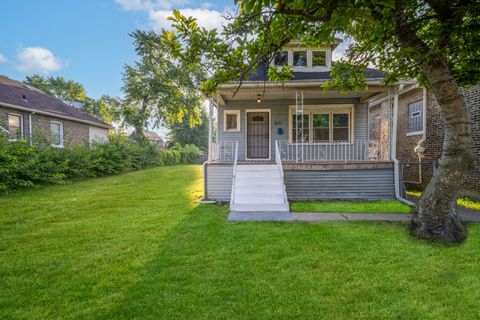
Active
$189,900
3
bds
|
1
ba
|
1,198
sqft
|
built
1903
12127 S Parnell Ave, Chicago, IL 60628
$362
Cash flow
9.9%
Cash-on-Cash Return
8.0%
Cap rate
1.0%
Rent to Value Ratio
Active
$425,000
2
bds
|
2
ba
|
1,400
sqft
|
built
2005
2700 Summit Dr, Glenview, IL 60025
$-1,171
Cash flow
-14.4%
Cash-on-Cash Return
2.4%
Cap rate
0.7%
Rent to Value Ratio
Active
$449,000
2
bds
|
2
ba
|
1,008
sqft
|
built
1957
7226 W Greenleaf St, Niles, IL 60714
$-815
Cash flow
-9.5%
Cash-on-Cash Return
3.5%
Cap rate
0.6%
Rent to Value Ratio
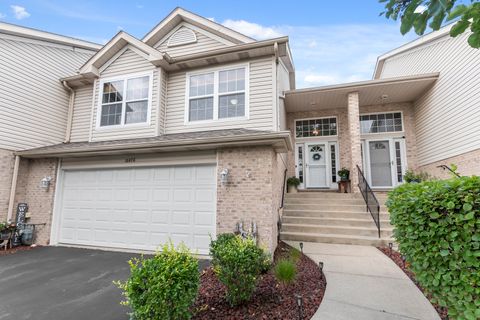
Active
$309,000
3
bds
|
2
ba
|
2,100
sqft
|
built
2003
18478 Bellagio Cir, Tinley Park, IL 60477
$-534
Cash flow
-9.0%
Cash-on-Cash Return
3.6%
Cap rate
1.0%
Rent to Value Ratio

Active
$415,000
3
bds
|
2
ba
|
1,415
sqft
|
built
1968
10420 Washington Ave, Oak Lawn, IL 60453
$-782
Cash flow
-9.8%
Cash-on-Cash Return
3.4%
Cap rate
0.7%
Rent to Value Ratio
Active
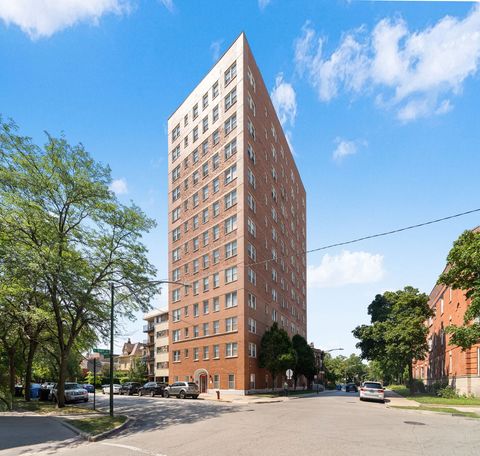
$179,900
1
bds
|
1
ba
|
0
sqft
|
built
1920
5400 S Harper Ave, Chicago, IL 60615
$-382
Cash flow
-11.1%
Cash-on-Cash Return
3.1%
Cap rate
0.9%
Rent to Value Ratio
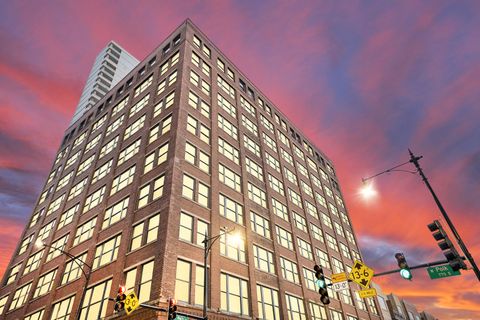
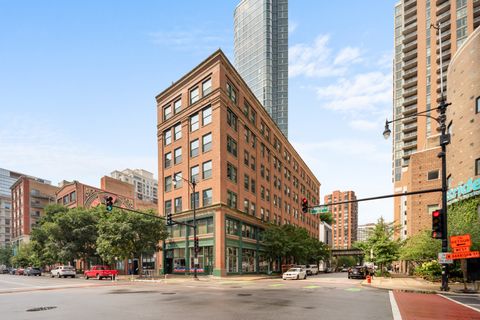
Active
$499,900
3
bds
|
2
ba
|
1,543
sqft
|
built
1912
801 S Wells St, Chicago, IL 60607
$-970
Cash flow
-10.1%
Cash-on-Cash Return
3.4%
Cap rate
0.7%
Rent to Value Ratio
Active
$258,000
3
bds
|
2
ba
|
1,700
sqft
|
built
1921
8805 S Carpenter St, Chicago, IL 60620
$144
Cash flow
2.9%
Cash-on-Cash Return
6.3%
Cap rate
0.9%
Rent to Value Ratio
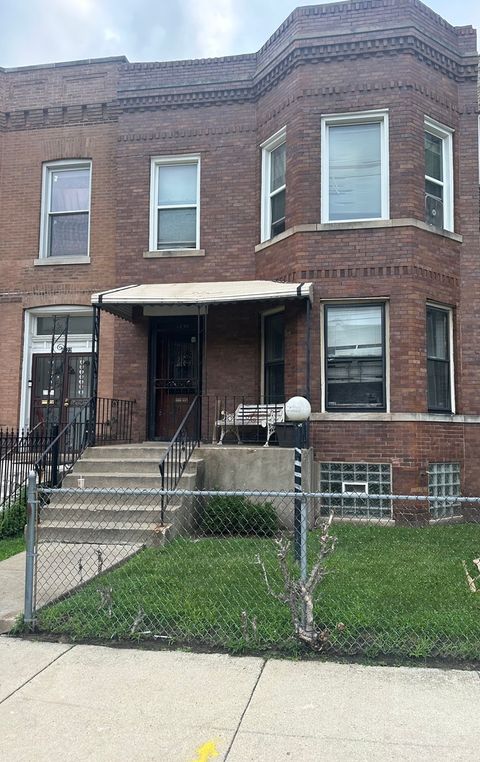
Active
$279,914
4
bds
|
3
ba
|
1,613
sqft
|
built
1920
6135 S Massasoit Ave, Chicago, IL 60638
$98
Cash flow
1.8%
Cash-on-Cash Return
6.1%
Cap rate
0.9%
Rent to Value Ratio
Active
$275,000
4
bds
|
2
ba
|
1,571
sqft
|
built
1888
2816 S Austin Blvd, Cicero, IL 60804
$-166
Cash flow
-3.1%
Cash-on-Cash Return
5.0%
Cap rate
0.8%
Rent to Value Ratio
Active
$599,000
3
bds
|
3
ba
|
1,500
sqft
|
built
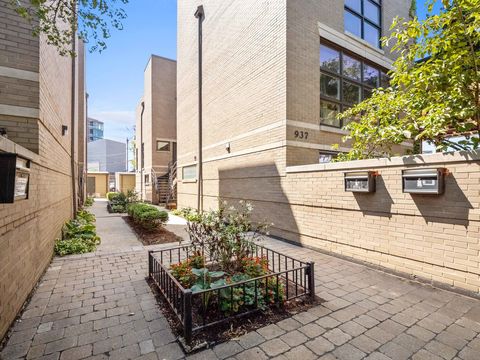
1988
937 W Wrightwood Ave, Chicago, IL 60614
$-834
Cash flow
-7.3%
Cash-on-Cash Return
4.0%
Cap rate
0.8%
Rent to Value Ratio
Active
$299,900
1
bds
|
1
ba
|
0
sqft
|
built
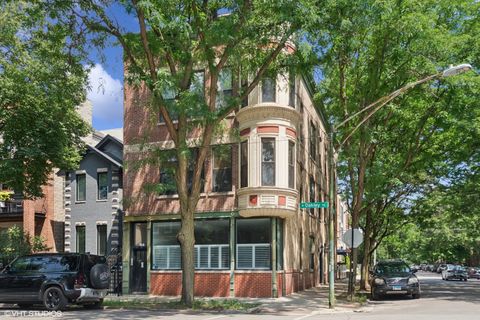
1899
2329 N Oakley Ave, Chicago, IL 60647
$-504
Cash flow
-8.8%
Cash-on-Cash Return
3.7%
Cap rate
0.7%
Rent to Value Ratio
Active
$549,000
4
bds
|
3
ba
|
2,432
sqft
|
built
1956
9406 S Leavitt St, Chicago, IL 60643
$-612
Cash flow
-5.8%
Cash-on-Cash Return
4.3%
Cap rate
0.7%
Rent to Value Ratio
Active
$1,299,000
3
bds
|
3
ba
|
3,200
sqft
|
built
2008
550 N Saint Clair St, Chicago, IL 60611
$-5,996
Cash flow
-24.1%
Cash-on-Cash Return
0.1%
Cap rate
0.6%
Rent to Value Ratio
Active
$280,000
3
bds
|
2
ba
|
1,081
sqft
|
built
1906
9131 S Blackstone Ave, Chicago, IL 60619
$-240
Cash flow
-4.5%
Cash-on-Cash Return
4.7%
Cap rate
0.6%
Rent to Value Ratio
Active
$270,000
2
bds
|
2
ba
|
1,260
sqft
|
built
1988
6300 W Montrose Ave, Chicago, IL 60634
$-73
Cash flow
-1.4%
Cash-on-Cash Return
5.4%
Cap rate
0.9%
Rent to Value Ratio
Active
$340,000
5
bds
|
2
ba
|
0
sqft
|
built
1906
6420 S Evans Ave, Chicago, IL 60637
$-511
Cash flow
-7.8%
Cash-on-Cash Return
3.9%
Cap rate
0.6%
Rent to Value Ratio
Active
$210,000
3
bds
|
1
ba
|
4,389
sqft
|
built
1924
8830 S Bishop St, Chicago, IL 60620
$330
Cash flow
8.2%
Cash-on-Cash Return
7.6%
Cap rate
1.0%
Rent to Value Ratio
Active
$139,900
2
bds
|
1
ba
|
980
sqft
|
built
1950
14819 Champlain Ave, Dolton, IL 60419
$169
Cash flow
6.3%
Cash-on-Cash Return
7.1%
Cap rate
1.3%
Rent to Value Ratio
Active
$550,000
7
bds
|
3
ba
|
0
sqft
|
built
1900
228 N Leclaire Ave, Chicago, IL 60644
$-1,328
Cash flow
-12.6%
Cash-on-Cash Return
2.8%
Cap rate
0.4%
Rent to Value Ratio
Active
$402,000
2
bds
|
3
ba
|
1,798
sqft
|
built
1991
4890 Prestwick Pl, Hoffman Estates, IL 60010
$-938
Cash flow
-12.2%
Cash-on-Cash Return
2.9%
Cap rate
0.7%
Rent to Value Ratio
Active
$500,000
4
bds
|
2
ba
|
1,789
sqft
|
built
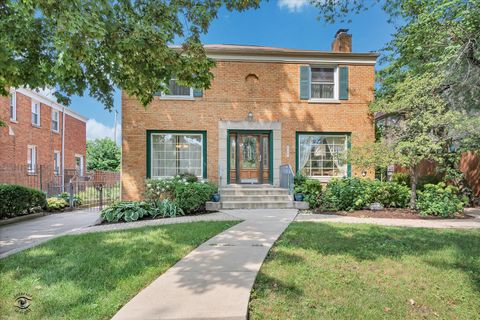
1921
4037 Grand Ave, Western Springs, IL 60558
$-162
Cash flow
-1.7%
Cash-on-Cash Return
5.3%
Cap rate
0.8%
Rent to Value Ratio

Active
$299,000
3
bds
|
1
ba
|
1,058
sqft
|
built
1964
6425 W 83rd Pl, Burbank, IL 60459
$-260
Cash flow
-4.5%
Cash-on-Cash Return
4.6%
Cap rate
0.7%
Rent to Value Ratio
Active
$340,000
4
bds
|
3
ba
|
1,200
sqft
|
built
1925
822 E 87th Pl, Chicago, IL 60619
$682
Cash flow
10.5%
Cash-on-Cash Return
8.1%
Cap rate
1.1%
Rent to Value Ratio
Active
$319,500
1
bds
|
1
ba
|
820
sqft
|
built
1977
405 N Wabash Ave, Chicago, IL 60611
$-674
Cash flow
-11.0%
Cash-on-Cash Return
3.1%
Cap rate
1.0%
Rent to Value Ratio
Active
$280,000
1
bds
|
1
ba
|
1,100
sqft
|
built
1908
900 S Wabash Ave, Chicago, IL 60605
$-634
Cash flow
-11.8%
Cash-on-Cash Return
3.0%
Cap rate
0.9%
Rent to Value Ratio
Active
$110,000
2
bds
|
2
ba
|
960
sqft
|
built
1885
4250 S Cottage Grove Ave, Chicago, IL 60653
$249
Cash flow
11.8%
Cash-on-Cash Return
8.4%
Cap rate
1.7%
Rent to Value Ratio
Active
$220,000
4
bds
|
2
ba
|
1,284
sqft
|
built
1943
10608 S Prairie Ave, Chicago, IL 60628
$248
Cash flow
5.9%
Cash-on-Cash Return
7.0%
Cap rate
1.0%
Rent to Value Ratio
Active
$145,000
2
bds
|
2
ba
|
1,175
sqft
|
built
1978
3100 S King Dr, Chicago, IL 60616
$-44
Cash flow
-1.6%
Cash-on-Cash Return
5.3%
Cap rate
1.7%
Rent to Value Ratio
Active
$245,000
1
bds
|
1
ba
|
0
sqft
|
built
1965
260 E Chestnut St, Chicago, IL 60611
$-613
Cash flow
-13.1%
Cash-on-Cash Return
2.7%
Cap rate
0.8%
Rent to Value Ratio
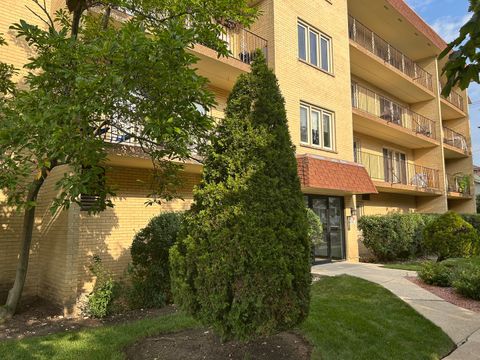
Active
$229,900
2
bds
|
2
ba
|
1,100
sqft
|
built
1990
17960 Royal Oak Ct, Tinley Park, IL 60477
$-251
Cash flow
-5.7%
Cash-on-Cash Return
4.4%
Cap rate
0.9%
Rent to Value Ratio
Active
$239,900
2
bds
|
2
ba
|
1,692
sqft
|
built
2001
22054 Jordan Ln, Richton Park, IL 60471
$-430
Cash flow
-9.4%
Cash-on-Cash Return
3.5%
Cap rate
0.8%
Rent to Value Ratio
Active
$289,900
1
bds
|
1
ba
|
895
sqft
|
built
2008
520 S State St, Chicago, IL 60605
$-808
Cash flow
-14.5%
Cash-on-Cash Return
2.3%
Cap rate
0.8%
Rent to Value Ratio