Cook County Investment Properties for Sale
Browse homes for sale and investment properties in Cook County. Refine your search by price, property type, or more.
Best cash flowing properties in Cook County
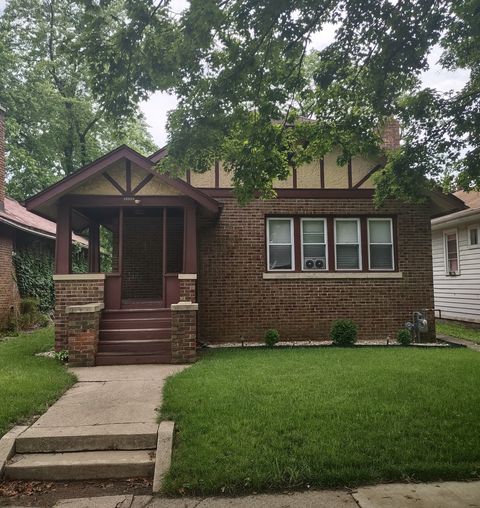
Active
$125,000
3
bds
|
1
ba
|
1,247
sqft
|
built
1927
15515 Marshfield Ave, Harvey, IL 60426
$653
Cash flow
27.3%
Cash-on-Cash Return
12.0%
Cap rate
1.6%
Rent to Value Ratio
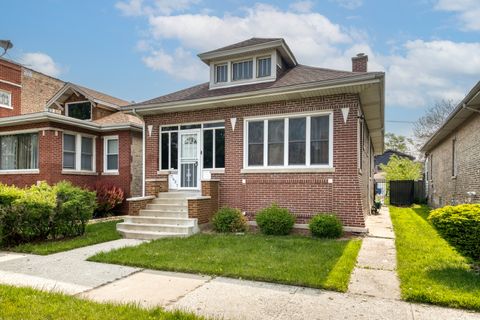
Active
$150,000
2
bds
|
2
ba
|
1,240
sqft
|
built
1920
7637 S Ridgeland Ave, Chicago, IL 60649
$596
Cash flow
20.7%
Cash-on-Cash Return
10.4%
Cap rate
1.5%
Rent to Value Ratio
4,861 out of 5,645 properties for sale in Cook County
Limited Results Shown
Create a free account, or log in to reveal all property listings and enjoy the complete experience.
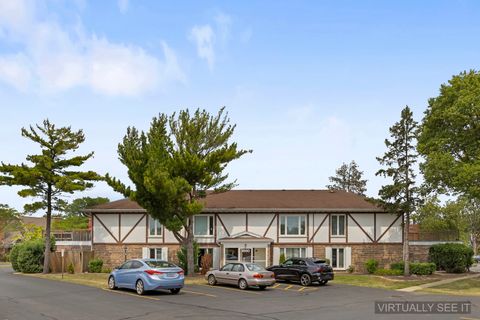
Active
$249,000
2
bds
|
2
ba
|
1,177
sqft
|
built
1978
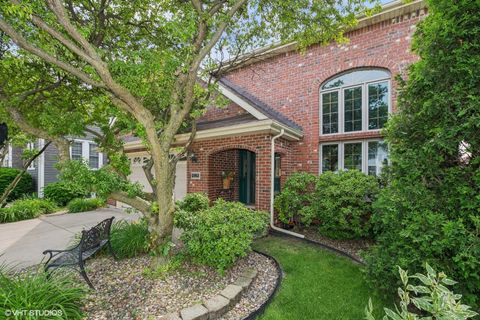
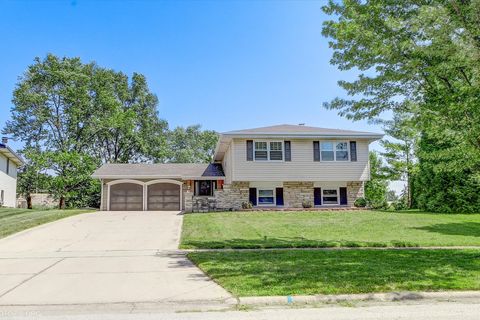
1860 W Surrey Park Ln, Arlington Heights, IL 60005
$-479
Cash flow
-10.0%
Cash-on-Cash Return
3.4%
Cap rate
0.7%
Rent to Value Ratio
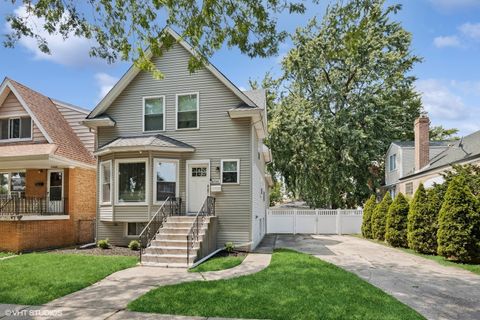
Active
$415,000
4
bds
|
2
ba
|
1,652
sqft
|
built
1911
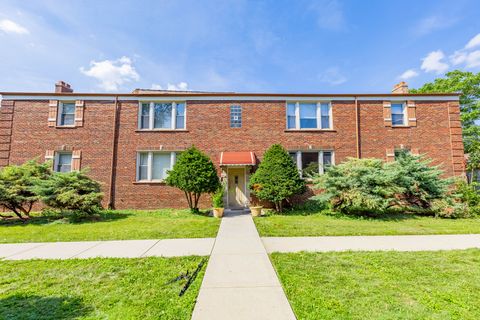
3206 Highland Ave, Berwyn, IL 60402
$-728
Cash flow
-9.2%
Cash-on-Cash Return
3.6%
Cap rate
0.7%
Rent to Value Ratio
Active
$399,900
3
bds
|
3
ba
|
1,848
sqft
|
built
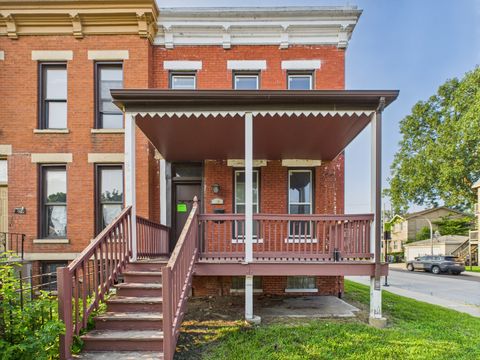
1878
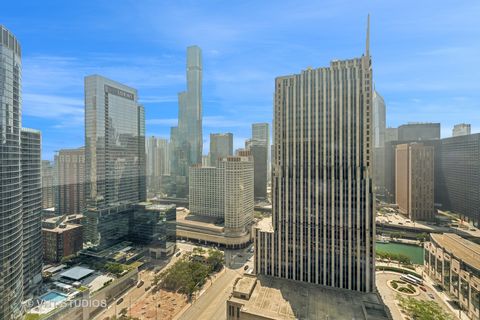
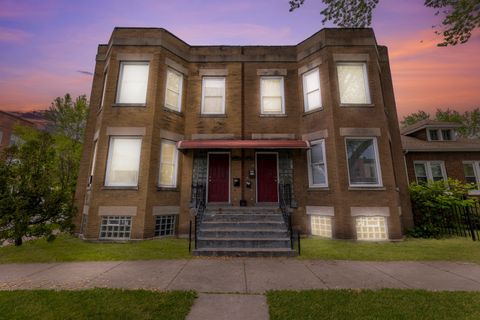
656 E Bowen Ave, Chicago, IL 60653
$82
Cash flow
1.1%
Cash-on-Cash Return
5.9%
Cap rate
0.9%
Rent to Value Ratio
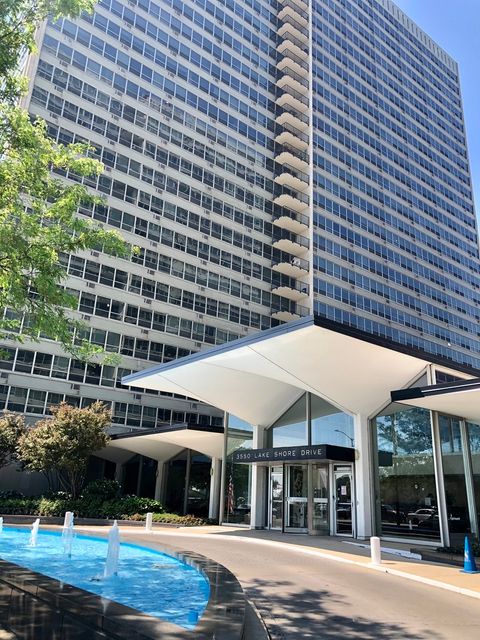
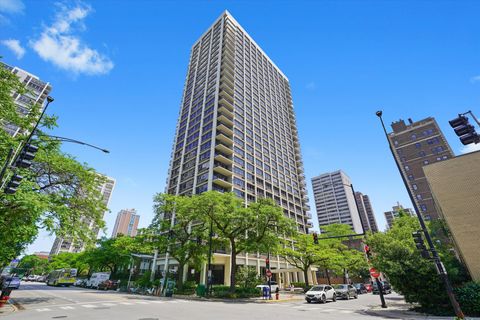
Active
$312,500
2
bds
|
2
ba
|
1,250
sqft
|
built
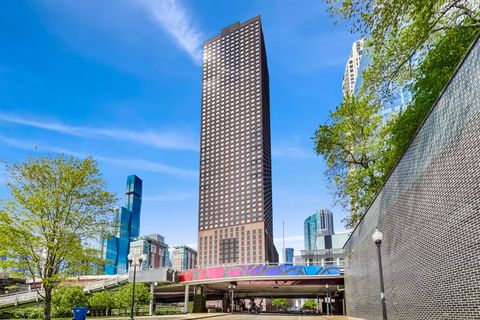
1962
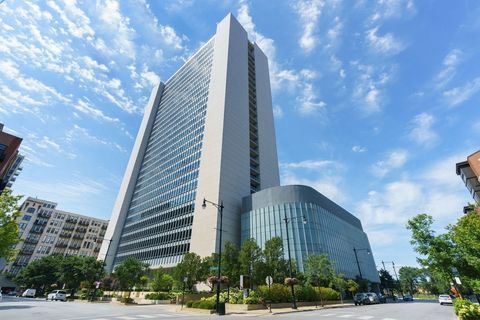
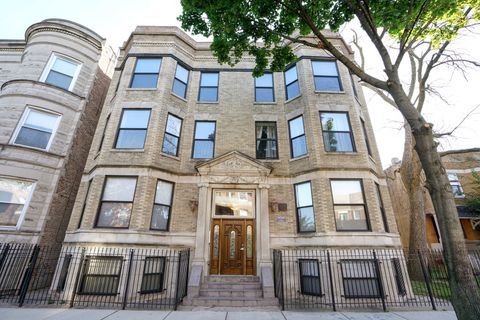
3550 N Lake Shore Dr, Chicago, IL 60657
$-793
Cash flow
-13.2%
Cash-on-Cash Return
2.6%
Cap rate
1.0%
Rent to Value Ratio
Active
$49,900
1
bds
|
1
ba
|
750
sqft
|
built
1923
7205 S Yates Blvd, Chicago, IL 60649
$553
Cash flow
12.9%
Cash-on-Cash Return
13.3%
Cap rate
2.8%
Rent to Value Ratio
Active
$375,000
3
bds
|
2
ba
|
0
sqft
|
built
1927
1217 Hull Ter, Evanston, IL 60202
$-1,157
Cash flow
-16.1%
Cash-on-Cash Return
2.0%
Cap rate
0.6%
Rent to Value Ratio
Active
$425,000
2
bds
|
2
ba
|
1,170
sqft
|
built
1972
500 W Superior St, Chicago, IL 60654
$-1,488
Cash flow
-18.3%
Cash-on-Cash Return
1.5%
Cap rate
1.0%
Rent to Value Ratio
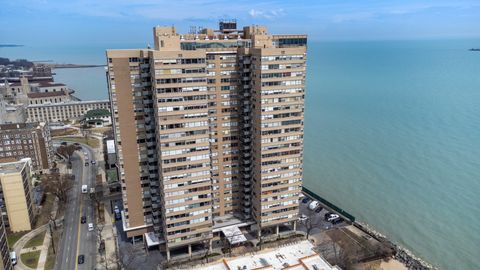
Active
$179,000
1
bds
|
1
ba
|
800
sqft
|
built
1960
6301 N Sheridan Rd, Chicago, IL 60660
$-477
Cash flow
-13.9%
Cash-on-Cash Return
2.5%
Cap rate
1.1%
Rent to Value Ratio
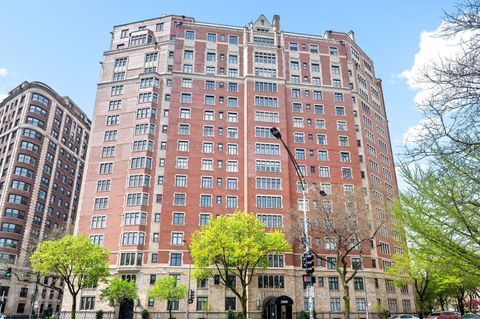
Active
$510,000
3
bds
|
2
ba
|
2,150
sqft
|
built
1927
3800 N Lake Shore Dr, Chicago, IL 60613
$-1,957
Cash flow
-20.0%
Cash-on-Cash Return
1.1%
Cap rate
0.9%
Rent to Value Ratio
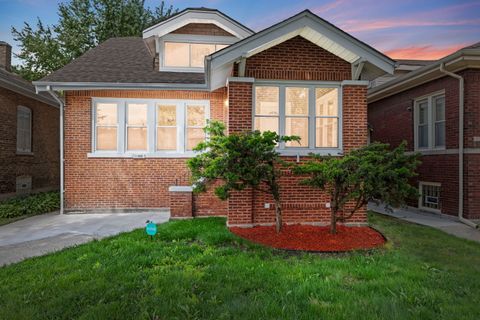
Active
$339,000
5
bds
|
3
ba
|
2,005
sqft
|
built
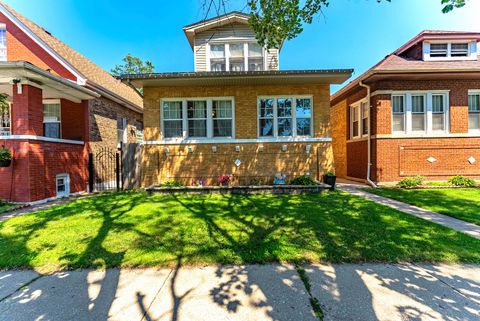
1926
11322 S Lowe Ave, Chicago, IL 60628
$-330
Cash flow
-5.1%
Cash-on-Cash Return
4.5%
Cap rate
0.6%
Rent to Value Ratio
Active
$575,000
5
bds
|
4
ba
|
3,300
sqft
|
built
1996
9228 S 55th Ct, Oak Lawn, IL 60453
$-1,257
Cash flow
-11.4%
Cash-on-Cash Return
3.1%
Cap rate
0.6%
Rent to Value Ratio
Active
$450,000
8
bds
|
5
ba
|
0
sqft
|
built
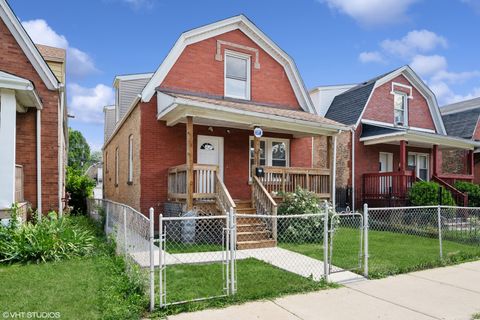
1950
9121 S Bishop St, Chicago, IL 60620
$-1,346
Cash flow
-15.6%
Cash-on-Cash Return
2.1%
Cap rate
0.4%
Rent to Value Ratio
Active
$725,000
2
bds
|
2
ba
|
1,358
sqft
|
built
2007
240 E Illinois St, Chicago, IL 60611
$-2,676
Cash flow
-19.3%
Cash-on-Cash Return
1.2%
Cap rate
0.6%
Rent to Value Ratio
Active
$299,000
3
bds
|
2
ba
|
1,650
sqft
|
built
1907
6615 S Woodlawn Ave, Chicago, IL 60637
$-402
Cash flow
-7.0%
Cash-on-Cash Return
4.1%
Cap rate
0.8%
Rent to Value Ratio
Active
$620,000
5
bds
|
3
ba
|
2,100
sqft
|
built
1938
8449 Kedvale Ave, Skokie, IL 60076
$-1,618
Cash flow
-13.6%
Cash-on-Cash Return
2.5%
Cap rate
0.5%
Rent to Value Ratio
Active
$290,000
2
bds
|
2
ba
|
1,300
sqft
|
built
1974
111 Acacia Dr, Indian Head Park, IL 60525
$-488
Cash flow
-8.8%
Cash-on-Cash Return
3.7%
Cap rate
0.9%
Rent to Value Ratio
Active
$335,000
3
bds
|
2
ba
|
1,350
sqft
|
built
1975
17748 64th Ct, Tinley Park, IL 60477
$-181
Cash flow
-2.8%
Cash-on-Cash Return
5.0%
Cap rate
0.9%
Rent to Value Ratio
Active
$199,999
2
bds
|
2
ba
|
1,000
sqft
|
built
1981
7509 175th St, Tinley Park, IL 60477
$-302
Cash flow
-7.9%
Cash-on-Cash Return
3.9%
Cap rate
0.9%
Rent to Value Ratio
Active
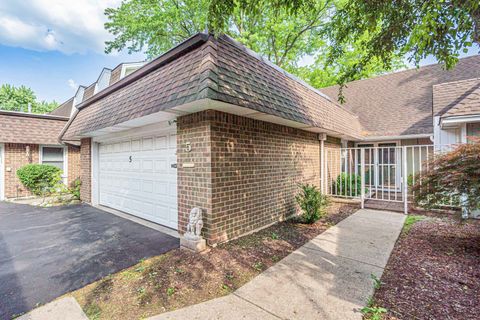
$379,000
2
bds
|
2
ba
|
1,540
sqft
|
built
1971
5 Haverhill On Auburn, Rolling Meadows, IL 60008
$-1,060
Cash flow
-14.6%
Cash-on-Cash Return
2.3%
Cap rate
0.7%
Rent to Value Ratio
Active
$499,000
4
bds
|
4
ba
|
2,578
sqft
|
built
1927
5155 W George St, Chicago, IL 60641
$-1,029
Cash flow
-10.8%
Cash-on-Cash Return
3.2%
Cap rate
0.6%
Rent to Value Ratio
Active
$400,000
2
bds
|
1
ba
|
0
sqft
|
built
1968
88 W Schiller St, Chicago, IL 60610
$-796
Cash flow
-10.4%
Cash-on-Cash Return
3.3%
Cap rate
0.9%
Rent to Value Ratio
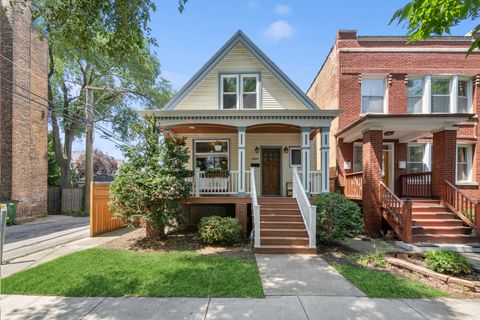
Active
$775,000
4
bds
|
2
ba
|
1,720
sqft
|
built
1893
2614 N Saint Louis Ave, Chicago, IL 60647
$-2,278
Cash flow
-15.3%
Cash-on-Cash Return
2.2%
Cap rate
0.5%
Rent to Value Ratio
Active
$545,000
5
bds
|
3
ba
|
2,930
sqft
|
built
1969
2079 E Parkview Cir, Hoffman Estates, IL 60169
$-740
Cash flow
-7.1%
Cash-on-Cash Return
4.0%
Cap rate
0.7%
Rent to Value Ratio
Active
$475,000
2
bds
|
2
ba
|
2,000
sqft
|
built
1926
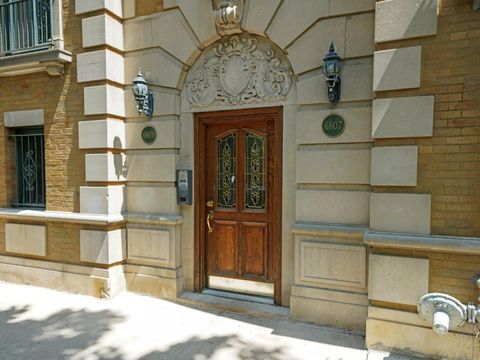
6807 N Lakewood Ave, Chicago, IL 60626
$-1,433
Cash flow
-15.7%
Cash-on-Cash Return
2.1%
Cap rate
0.5%
Rent to Value Ratio
Active
$389,000
9
bds
|
3
ba
|
0
sqft
|
built
1912
6945 S Peoria St, Chicago, IL 60621
$-514
Cash flow
-6.9%
Cash-on-Cash Return
4.1%
Cap rate
0.5%
Rent to Value Ratio
Active
$429,900
2
bds
|
2
ba
|
1,306
sqft
|
built
2004
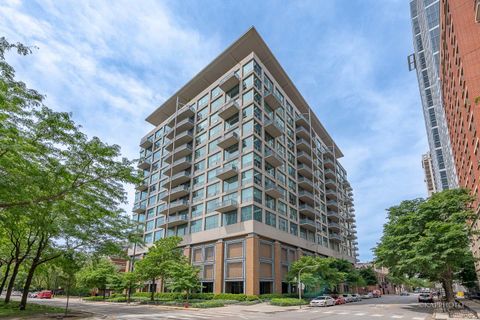
125 E 13th St, Chicago, IL 60605
$-1,197
Cash flow
-14.5%
Cash-on-Cash Return
2.3%
Cap rate
0.7%
Rent to Value Ratio
Active
$475,000
3
bds
|
2
ba
|
1,870
sqft
|
built
1955
7525 N Overhill Ave, Chicago, IL 60631
$-620
Cash flow
-6.8%
Cash-on-Cash Return
4.1%
Cap rate
0.7%
Rent to Value Ratio
Active
$340,000
3
bds
|
3
ba
|
2,000
sqft
|
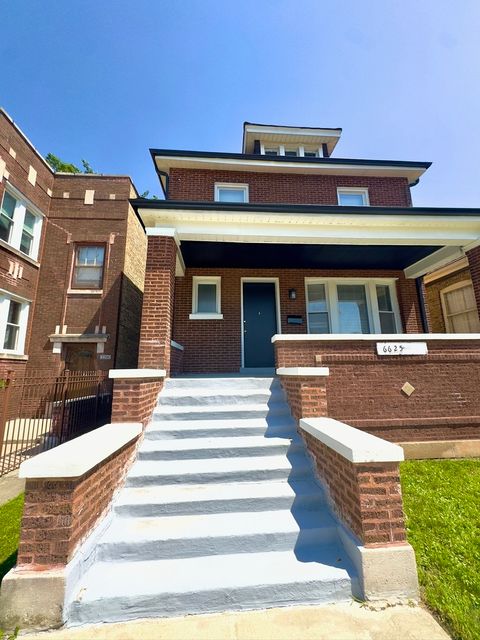
built
1915
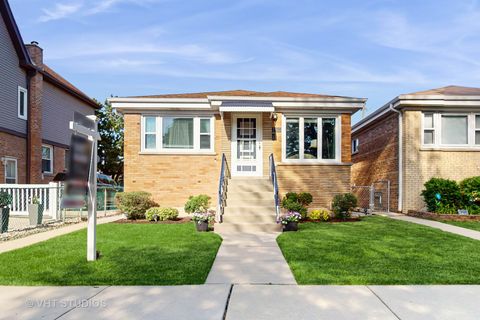
6625 S Campbell Ave, Chicago, IL 60629
$-575
Cash flow
-8.8%
Cash-on-Cash Return
3.6%
Cap rate
0.5%
Rent to Value Ratio
Active
$245,000
3
bds
|
3
ba
|
1,500
sqft
|
built
1919
7635 S Michigan Ave, Chicago, IL 60619
$287
Cash flow
6.1%
Cash-on-Cash Return
7.1%
Cap rate
0.9%
Rent to Value Ratio
Active
$289,900
1
bds
|
1
ba
|
1,080
sqft
|
built
1967
201 E Chestnut St, Chicago, IL 60611
$-695
Cash flow
-12.5%
Cash-on-Cash Return
2.8%
Cap rate
1.0%
Rent to Value Ratio
Active
$324,999
3
bds
|
2
ba
|
1,040
sqft
|
built
1964
1531 Birch Ave, Hanover Park, IL 60133
$-62
Cash flow
-1.0%
Cash-on-Cash Return
5.4%
Cap rate
0.9%
Rent to Value Ratio
Active
$399,000
4
bds
|
2
ba
|
1,245
sqft
|
built
1965
214 W Hintz Rd, Arlington Heights, IL 60004
$-32
Cash flow
-0.4%
Cash-on-Cash Return
5.6%
Cap rate
0.8%
Rent to Value Ratio
Active
$519,000
3
bds
|
2
ba
|
1,500
sqft
|
built
1880
2242 W Taylor St, Chicago, IL 60612
$-651
Cash flow
-6.5%
Cash-on-Cash Return
4.2%
Cap rate
0.6%
Rent to Value Ratio
Active
$998,000
4
bds
|
4
ba
|
2,300
sqft
|
built
2013
1635 Elder Ln, Northfield, IL 60093
$-3,328
Cash flow
-17.4%
Cash-on-Cash Return
1.7%
Cap rate
0.4%
Rent to Value Ratio
Active
$525,000
14
bds
|
4
ba
|
0
sqft
|
built
1897
6601 S Saint Lawrence Ave, Chicago, IL 60637
$-1,112
Cash flow
-11.1%
Cash-on-Cash Return
3.1%
Cap rate
0.5%
Rent to Value Ratio
Active
$300,000
1
bds
|
1
ba
|
740
sqft
|
built
1991
474 N Lake Shore Dr, Chicago, IL 60611
$-1,175
Cash flow
-20.4%
Cash-on-Cash Return
1.0%
Cap rate
0.8%
Rent to Value Ratio
Active
$439,900
4
bds
|
3
ba
|
2,107
sqft
|
built
1923
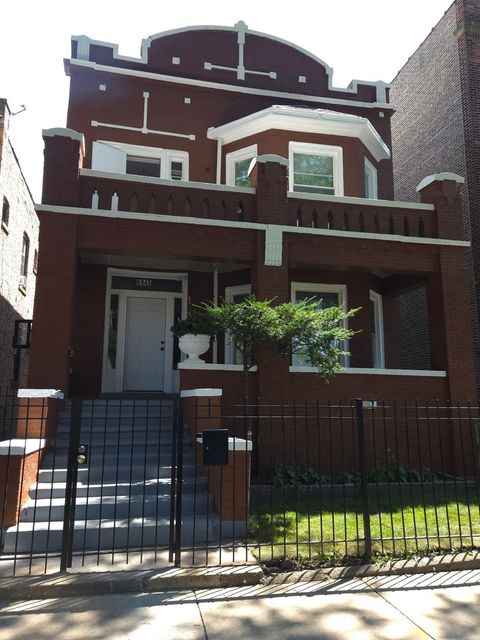
4906 W Deming Pl, Chicago, IL 60639
$-360
Cash flow
-4.3%
Cash-on-Cash Return
4.7%
Cap rate
0.7%
Rent to Value Ratio
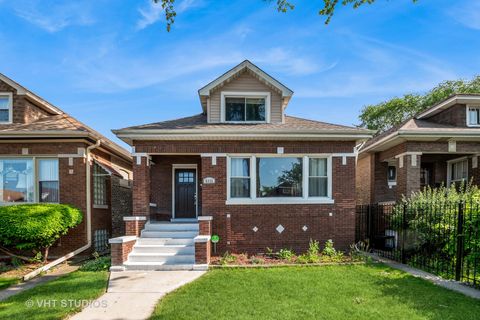
Active
$354,900
5
bds
|
2
ba
|
2,427
sqft
|
built
1910
1047 N Kedvale Ave, Chicago, IL 60651
$-620
Cash flow
-9.1%
Cash-on-Cash Return
3.6%
Cap rate
0.6%
Rent to Value Ratio