Cook County Investment Properties for Sale
Browse homes for sale and investment properties in Cook County. Refine your search by price, property type, or more.
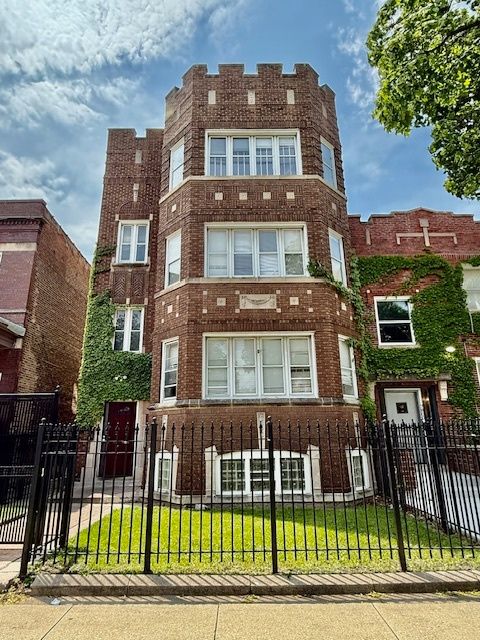
Best cash flowing properties in Cook County
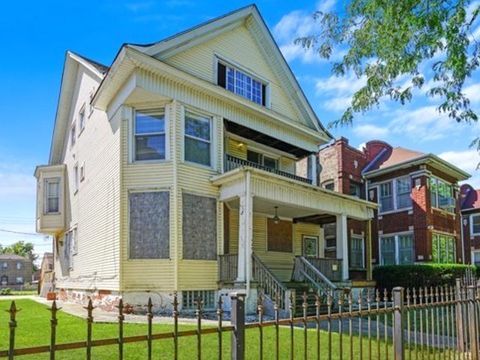
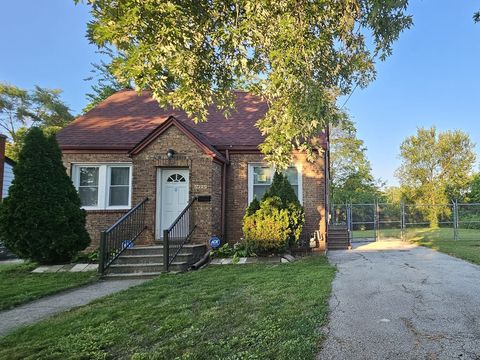
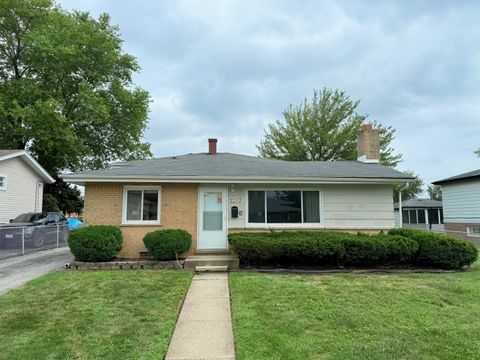
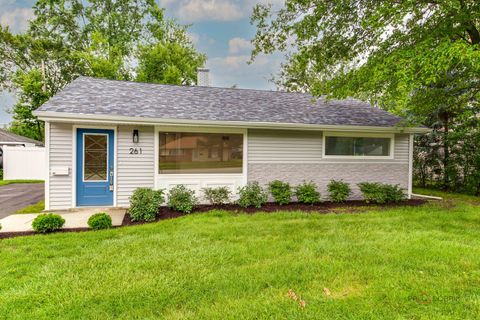
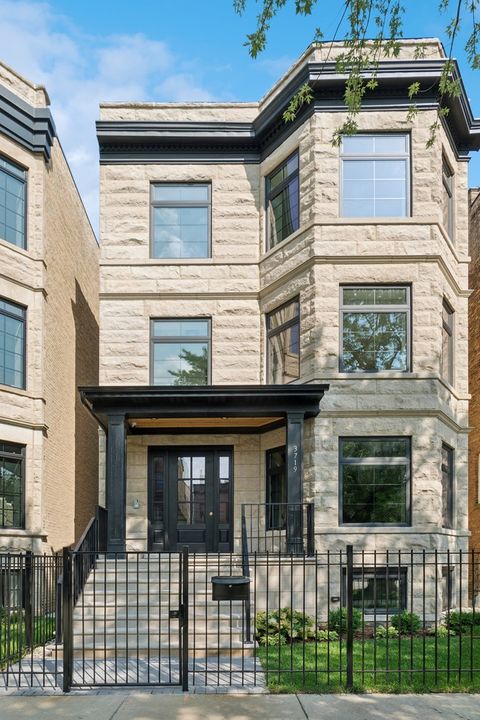
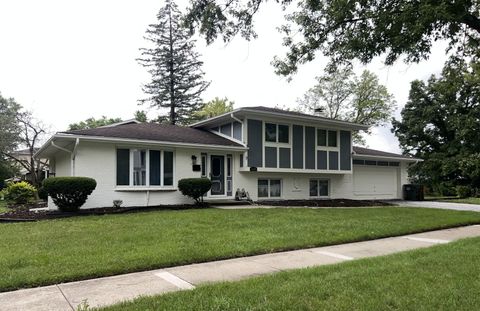
Active
$135,000
6
bds
|
3
ba
|
0
sqft
|
built
1894
2115 E 72nd Pl, Chicago, IL 60649
$736
Cash flow
28.4%
Cash-on-Cash Return
12.2%
Cap rate
1.7%
Rent to Value Ratio
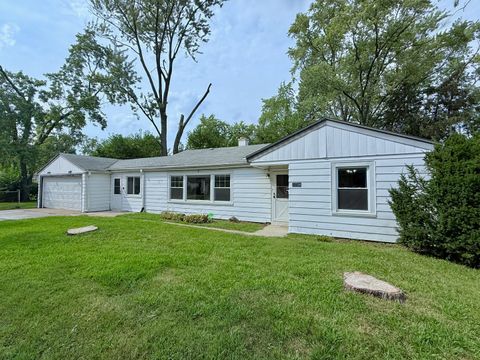
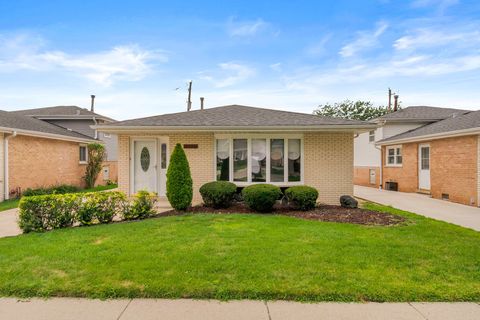
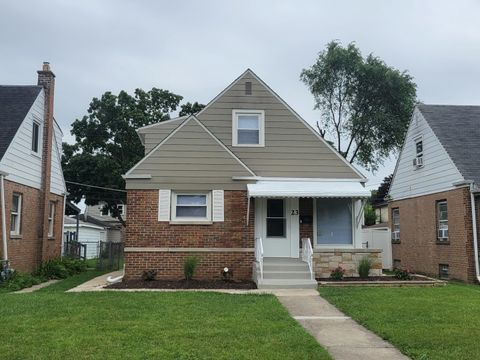
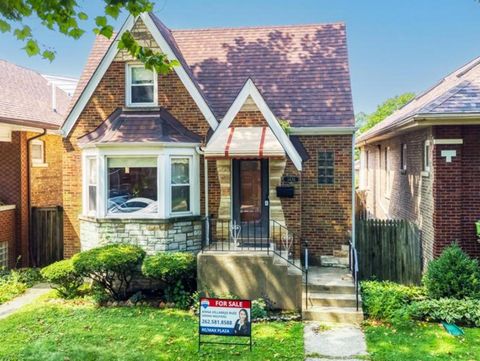
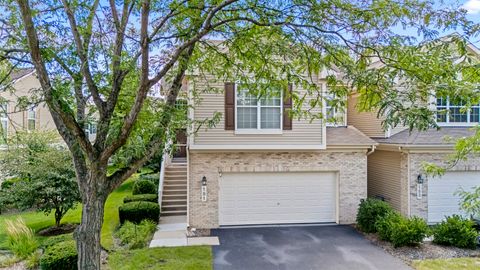
Active
$180,000
3
bds
|
1
ba
|
1,059
sqft
|
built
1951
16784 Crane Ave, Hazel Crest, IL 60429
$358
Cash flow
10.4%
Cash-on-Cash Return
8.1%
Cap rate
1.2%
Rent to Value Ratio
5,191 out of 6,012 properties for sale in Cook County
Limited Results Shown
Create a free account, or log in to reveal all property listings and enjoy the complete experience.
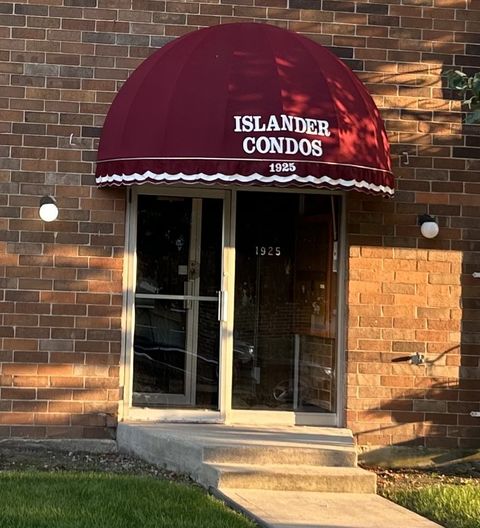
Active
$97,500
2
bds
|
1
ba
|
1,100
sqft
|
built
1979
1925 Canal St, Blue Island, IL 60406
$-68
Cash flow
-3.6%
Cash-on-Cash Return
4.8%
Cap rate
1.4%
Rent to Value Ratio
Active
$799,000
6
bds
|
4
ba
|
3,389
sqft
|
built
1923
5706 N New Hampshire Ave, Chicago, IL 60631
$-1,968
Cash flow
-12.9%
Cash-on-Cash Return
2.7%
Cap rate
0.5%
Rent to Value Ratio
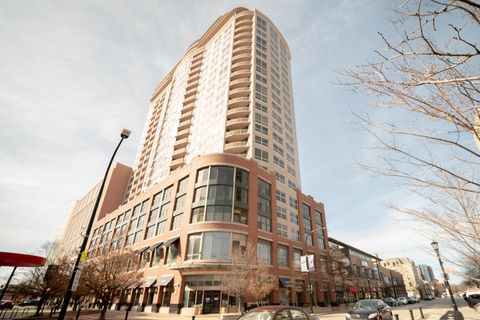
Active
$344,000
1
bds
|
1
ba
|
864
sqft
|
built
2000
330 N Jefferson St, Chicago, IL 60661
$-992
Cash flow
-15.0%
Cash-on-Cash Return
2.2%
Cap rate
0.8%
Rent to Value Ratio
Active
$288,000
1
bds
|
1
ba
|
751
sqft
|
built
2008
1400 S Michigan Ave, Chicago, IL 60605
$-765
Cash flow
-13.9%
Cash-on-Cash Return
2.5%
Cap rate
0.8%
Rent to Value Ratio
Active
$634,900
3
bds
|
5
ba
|
2,143
sqft
|
built
1904
2305 W 111th Pl, Chicago, IL 60643
$-1,322
Cash flow
-10.9%
Cash-on-Cash Return
3.2%
Cap rate
0.5%
Rent to Value Ratio
Active
$750,000
3
bds
|
3
ba
|
3,750
sqft
|
built
1957
850 N Dewitt Pl, Chicago, IL 60611
$-3,920
Cash flow
-27.3%
Cash-on-Cash Return
-0.6%
Cap rate
0.9%
Rent to Value Ratio
Active
$159,999
3
bds
|
2
ba
|
1,100
sqft
|
built
1940
14931 Riverside Dr, South Holland, IL 60473
$201
Cash flow
6.6%
Cash-on-Cash Return
7.2%
Cap rate
1.2%
Rent to Value Ratio

Active
$240,000
6
bds
|
3
ba
|
0
sqft
|
built
1921
8024 S Vernon Ave, Chicago, IL 60619
$-246
Cash flow
-5.3%
Cash-on-Cash Return
4.5%
Cap rate
0.8%
Rent to Value Ratio
Active
$350,000
3
bds
|
2
ba
|
1,872
sqft
|
built
1973
10636 S Christiana Ave, Chicago, IL 60655
$161
Cash flow
2.4%
Cash-on-Cash Return
6.2%
Cap rate
0.9%
Rent to Value Ratio
Active
$499,000
1
bds
|
2
ba
|
1,244
sqft
|
built
2007
340 E Randolph St, Chicago, IL 60601
$-1,362
Cash flow
-14.2%
Cash-on-Cash Return
2.4%
Cap rate
0.8%
Rent to Value Ratio
Active
$225,000
1
bds
|
1
ba
|
900
sqft
|
built
1920
3721 W Byron St, Chicago, IL 60618
$-349
Cash flow
-8.1%
Cash-on-Cash Return
3.8%
Cap rate
0.8%
Rent to Value Ratio
Active
$279,000
2
bds
|
1
ba
|
0
sqft
|
built
1924
4023 N Mozart St, Chicago, IL 60618
$-446
Cash flow
-8.3%
Cash-on-Cash Return
3.8%
Cap rate
0.8%
Rent to Value Ratio
Active
$549,000
3
bds
|
2
ba
|
1,145
sqft
|
built
1925
5653 N Newcastle Ave, Chicago, IL 60631
$-1,234
Cash flow
-11.7%
Cash-on-Cash Return
3.0%
Cap rate
0.6%
Rent to Value Ratio
Active
$250,000
2
bds
|
1
ba
|
0
sqft
|
built
1925
2632 N Springfield Ave, Chicago, IL 60647
$-438
Cash flow
-9.1%
Cash-on-Cash Return
3.6%
Cap rate
0.7%
Rent to Value Ratio
Active
$449,000
3
bds
|
2
ba
|
0
sqft
|
built
2008
4150 N Kenmore Ave, Chicago, IL 60613
$-750
Cash flow
-8.7%
Cash-on-Cash Return
3.7%
Cap rate
0.8%
Rent to Value Ratio
Active
$211,000
3
bds
|
2
ba
|
1,050
sqft
|
built
1963
1287 Arthur St, Calumet City, IL 60409
$-306
Cash flow
-7.6%
Cash-on-Cash Return
3.9%
Cap rate
0.9%
Rent to Value Ratio
Active
$169,000
3
bds
|
2
ba
|
1,281
sqft
|
built
1952
23 166th Pl, Calumet City, IL 60409
$75
Cash flow
2.3%
Cash-on-Cash Return
6.2%
Cap rate
1.2%
Rent to Value Ratio
Active
$649,000
3
bds
|
2
ba
|
1,740
sqft
|
built
1952
4645 Grand Ave, Western Springs, IL 60558
$-1,300
Cash flow
-10.5%
Cash-on-Cash Return
3.3%
Cap rate
0.6%
Rent to Value Ratio
Active
$429,500
3
bds
|
3
ba
|
1,547
sqft
|
built
1929
3902 Rose Ave, Western Springs, IL 60558
$-55
Cash flow
-0.7%
Cash-on-Cash Return
5.5%
Cap rate
0.8%
Rent to Value Ratio
Active
$569,500
2
bds
|
2
ba
|
1,386
sqft
|
built
2006
807 Davis St, Evanston, IL 60201
$-2,156
Cash flow
-19.8%
Cash-on-Cash Return
1.1%
Cap rate
0.6%
Rent to Value Ratio
Active
$394,900
9
bds
|
6
ba
|
0
sqft
|
built
1928
7804 S Burnham Ave, Chicago, IL 60649
$-1,056
Cash flow
-14.0%
Cash-on-Cash Return
2.5%
Cap rate
0.4%
Rent to Value Ratio
Active
$320,000
3
bds
|
2
ba
|
1,600
sqft
|
built
1958
1127 Herbert Ave, Berkeley, IL 60163
$-196
Cash flow
-3.2%
Cash-on-Cash Return
4.9%
Cap rate
0.9%
Rent to Value Ratio
Active
$274,900
4
bds
|
2
ba
|
1,397
sqft
|
built
1967
13601 S End Ln, Crestwood, IL 60418
$7
Cash flow
0.1%
Cash-on-Cash Return
5.7%
Cap rate
0.9%
Rent to Value Ratio
Active
$169,999
2
bds
|
1
ba
|
949
sqft
|
built
1953
261 Blackhawk Dr, Park Forest, IL 60466
$-542
Cash flow
-16.6%
Cash-on-Cash Return
1.8%
Cap rate
0.8%
Rent to Value Ratio
Active
$195,000
2
bds
|
2
ba
|
1,350
sqft
|
built
2003
715 E 62nd St, Chicago, IL 60637
$-85
Cash flow
-2.3%
Cash-on-Cash Return
5.2%
Cap rate
1.0%
Rent to Value Ratio
Active
$389,900
2
bds
|
2
ba
|
1,000
sqft
|
built
1947
5659 S Oak Park Ave, Chicago, IL 60638
$87
Cash flow
1.2%
Cash-on-Cash Return
5.9%
Cap rate
0.7%
Rent to Value Ratio
Active
$285,000
5
bds
|
2
ba
|
1,338
sqft
|
built
1927
8127 S Stewart Ave, Chicago, IL 60620
$114
Cash flow
2.1%
Cash-on-Cash Return
6.2%
Cap rate
0.8%
Rent to Value Ratio
Active
$3,275,000
6
bds
|
7
ba
|
5,419
sqft
|
built
1906
3719 N Magnolia Ave, Chicago, IL 60613
$-14,843
Cash flow
-23.6%
Cash-on-Cash Return
0.2%
Cap rate
0.1%
Rent to Value Ratio
Active
$475,000
4
bds
|
2
ba
|
2,242
sqft
|
built
1951
5836 N Rockwell St, Chicago, IL 60659
$-248
Cash flow
-2.7%
Cash-on-Cash Return
5.1%
Cap rate
0.7%
Rent to Value Ratio
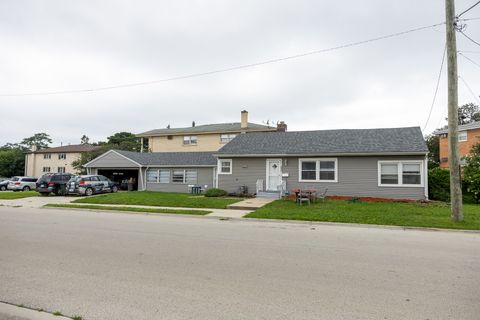
Active
$228,000
4
bds
|
2
ba
|
1,403
sqft
|
built
1957
746 E 157th St, South Holland, IL 60473
$269
Cash flow
6.2%
Cash-on-Cash Return
7.1%
Cap rate
1.2%
Rent to Value Ratio
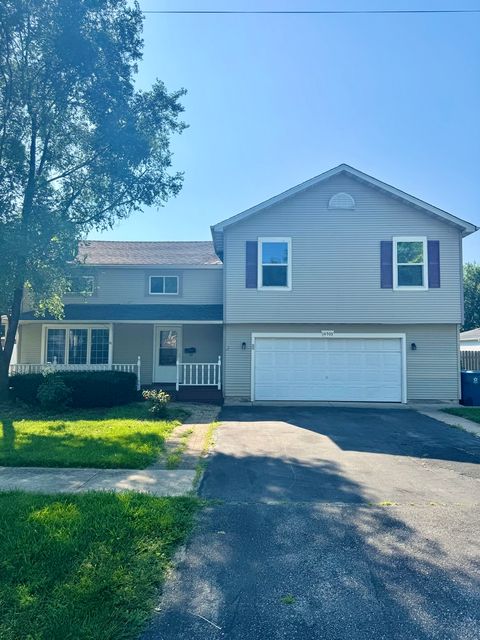
Active
$639,900
4
bds
|
4
ba
|
3,178
sqft
|
built
1996
10745 Lockwood Ave, Oak Lawn, IL 60453
$-1,491
Cash flow
-12.2%
Cash-on-Cash Return
2.9%
Cap rate
0.6%
Rent to Value Ratio
Active
$349,900
3
bds
|
3
ba
|
1,290
sqft
|
built
1983
1115 Birch Rd, Homewood, IL 60430
$-327
Cash flow
-4.9%
Cash-on-Cash Return
4.6%
Cap rate
0.9%
Rent to Value Ratio
Active
$399,500
3
bds
|
4
ba
|
1,782
sqft
|
built
2007
151 Fountain Grass Cir, Bartlett, IL 60103
$-987
Cash flow
-12.9%
Cash-on-Cash Return
2.7%
Cap rate
0.7%
Rent to Value Ratio
Active
$499,000
3
bds
|
2
ba
|
1,488
sqft
|
built
1936
18145 Harlem Ave, Tinley Park, IL 60477
$-886
Cash flow
-9.3%
Cash-on-Cash Return
3.5%
Cap rate
0.6%
Rent to Value Ratio
Active
$194,000
3
bds
|
1
ba
|
1,204
sqft
|
built
1958
1212 E 151st St, Dolton, IL 60419
$152
Cash flow
4.1%
Cash-on-Cash Return
6.6%
Cap rate
1.2%
Rent to Value Ratio
Active
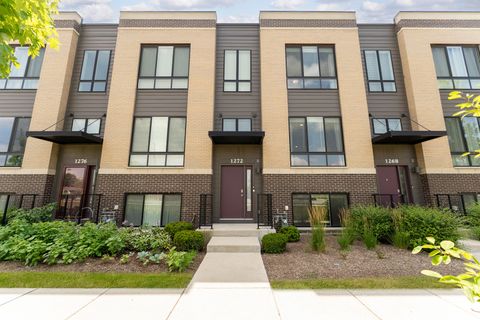
$587,000
3
bds
|
3
ba
|
1,782
sqft
|
built
2021
1272 Quadrant Ln, Schaumburg, IL 60173
$-1,420
Cash flow
-12.6%
Cash-on-Cash Return
2.8%
Cap rate
0.7%
Rent to Value Ratio
Active
$299,000
4
bds
|
1
ba
|
1,546
sqft
|
built
1953
4422 Custer Ave, Brookfield, IL 60513
$-277
Cash flow
-4.8%
Cash-on-Cash Return
4.6%
Cap rate
0.8%
Rent to Value Ratio
Active
$309,000
4
bds
|
2
ba
|
2,400
sqft
|
built
1938
14503 Waverly Ave, Midlothian, IL 60445
$-242
Cash flow
-4.1%
Cash-on-Cash Return
4.7%
Cap rate
0.8%
Rent to Value Ratio