Cook County Investment Properties for Sale
Browse homes for sale and investment properties in Cook County. Refine your search by price, property type, or more.
Best cash flowing properties in Cook County
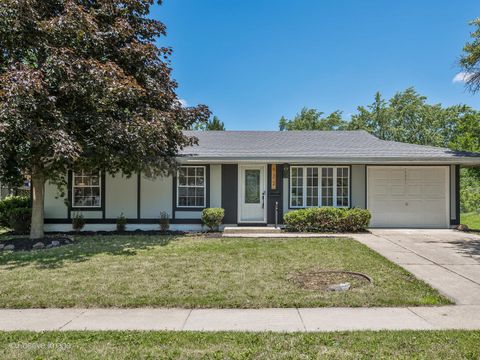
Active
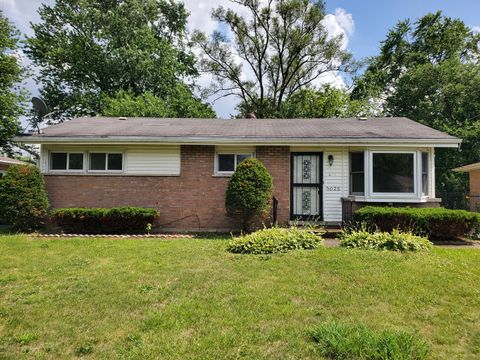
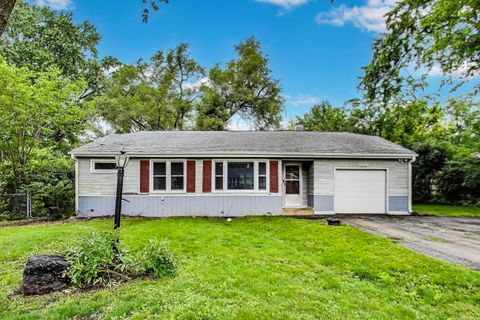
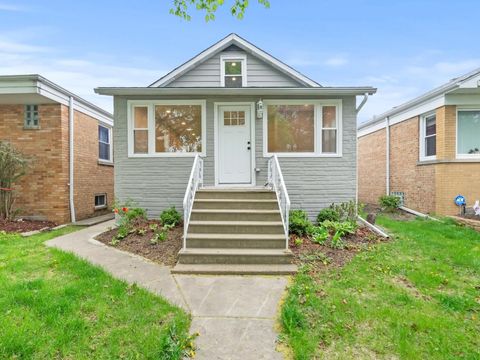
$114,900
3
bds
|
2
ba
|
1,048
sqft
|
built
1956
3025 Sherwood Ave, Markham, IL 60428
$551
Cash flow
25.0%
Cash-on-Cash Return
12.0%
Cap rate
1.9%
Rent to Value Ratio
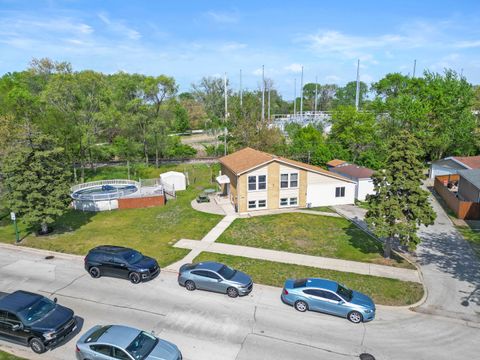
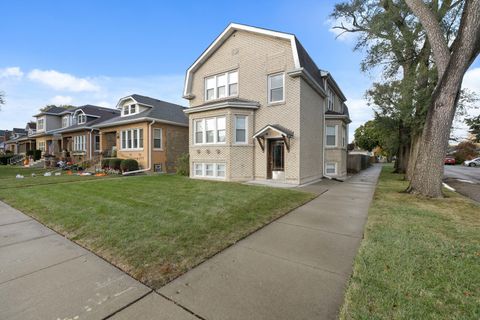
Active
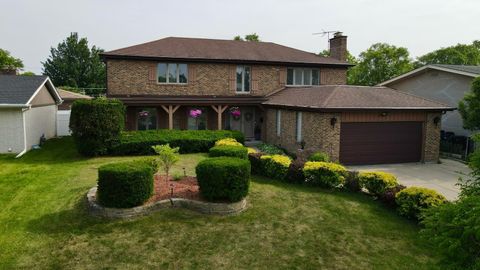
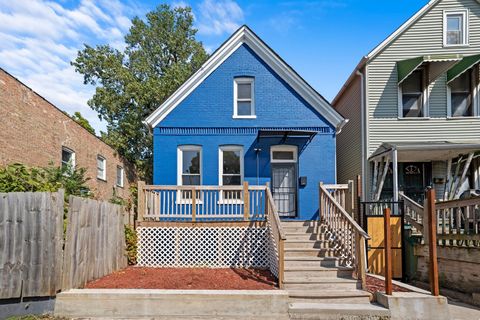
$278,900
5
bds
|
2
ba
|
1,850
sqft
|
built
1964
12713 S Escanaba Ave, Chicago, IL 60633
$371
Cash flow
6.9%
Cash-on-Cash Return
7.3%
Cap rate
1.0%
Rent to Value Ratio
6,687 out of 8,128 properties for sale in Cook County
Limited Results Shown
Create a free account, or log in to reveal all property listings and enjoy the complete experience.
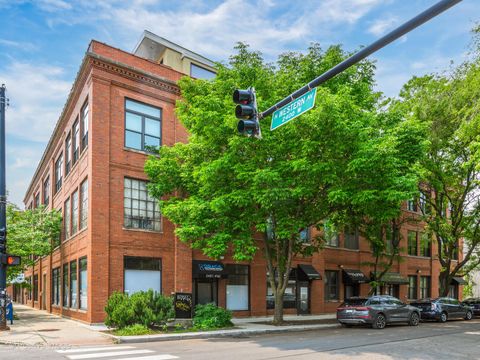
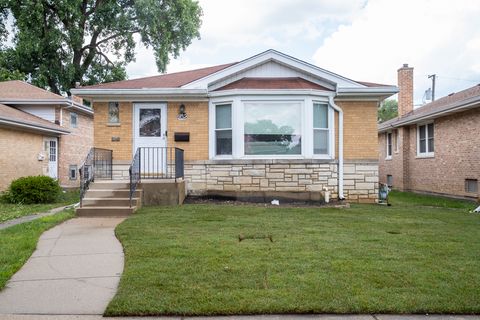
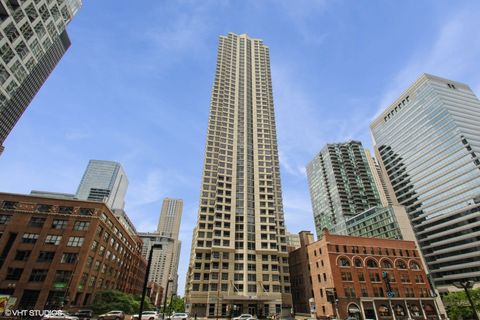
Active
$325,000
1
bds
|
1
ba
|
1,250
sqft
|
built
1909
2401 W Ohio St, Chicago, IL 60612
$-604
Cash flow
-9.7%
Cash-on-Cash Return
4.0%
Cap rate
0.9%
Rent to Value Ratio
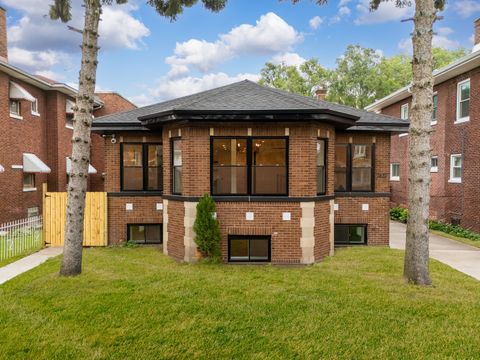
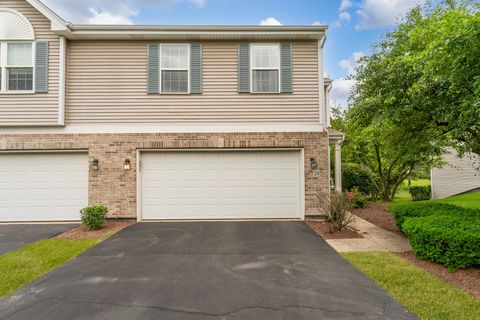
Active
$625,000
3
bds
|
4
ba
|
2,580
sqft
|
built
1925
7427 S Oglesby Ave, Chicago, IL 60649
$-2,041
Cash flow
-17.0%
Cash-on-Cash Return
2.3%
Cap rate
0.4%
Rent to Value Ratio

Active
$220,000
4
bds
|
2
ba
|
0
sqft
|
built
1892
14430 Martin Luther King Jr Dr, Dolton, IL 60419
$-320
Cash flow
-7.6%
Cash-on-Cash Return
3.9%
Cap rate
0.8%
Rent to Value Ratio
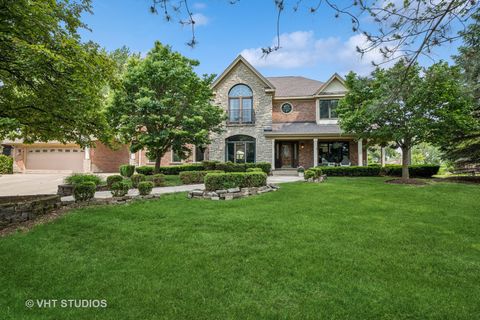
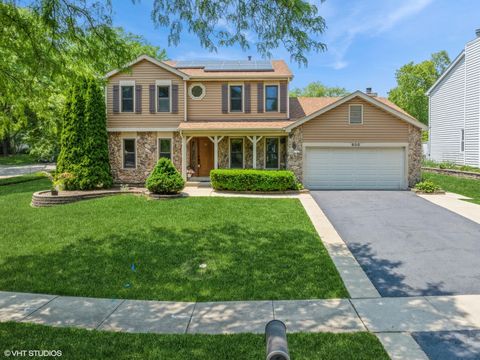
Active
$1,150,000
4
bds
|
5
ba
|
4,185
sqft
|
built
2001
540 Harvard Ave, Barrington, IL 60010
$-3,237
Cash flow
-14.7%
Cash-on-Cash Return
2.3%
Cap rate
0.4%
Rent to Value Ratio
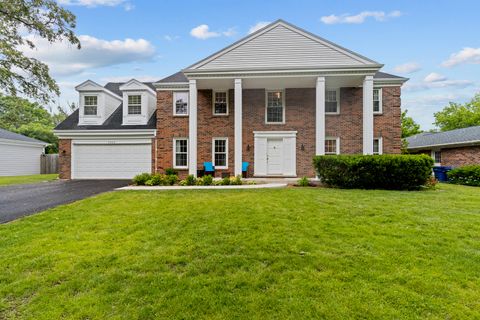
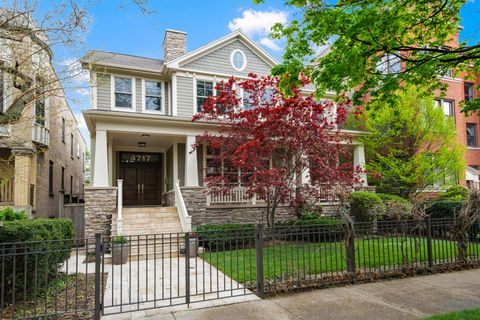
Active
$759,828
3
bds
|
3
ba
|
2,000
sqft
|
built
2016
20 S Fairview Ave, Park Ridge, IL 60068
$-1,887
Cash flow
-13.0%
Cash-on-Cash Return
2.7%
Cap rate
0.7%
Rent to Value Ratio
Active
$1,089,000
5
bds
|
3
ba
|
3,000
sqft
|
built
1972
3622 Dauphine Ave, Northbrook, IL 60062
$-3,225
Cash flow
-15.5%
Cash-on-Cash Return
2.1%
Cap rate
0.4%
Rent to Value Ratio
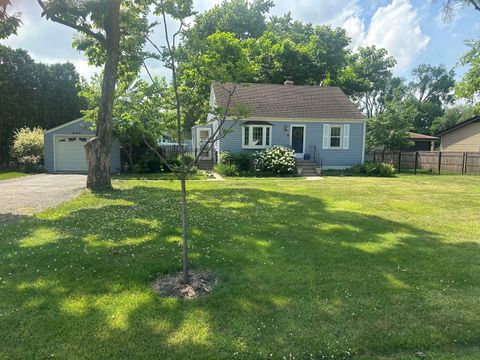
Active
$359,000
3
bds
|
1
ba
|
1,560
sqft
|
built
1954
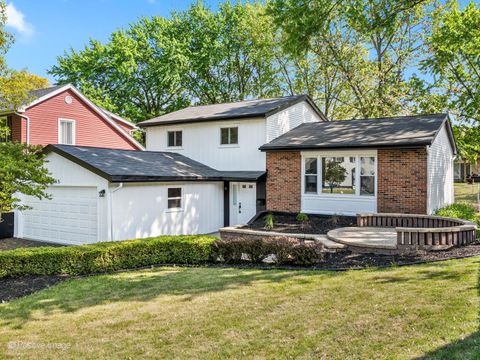
652 N Maple Ave, Palatine, IL 60067
$-409
Cash flow
-5.9%
Cash-on-Cash Return
4.3%
Cap rate
0.6%
Rent to Value Ratio
Active
$269,000
3
bds
|
1
ba
|
1,201
sqft
|
built
1957
2030 Cedar Ave, Hanover Park, IL 60133
$-243
Cash flow
-4.7%
Cash-on-Cash Return
5.2%
Cap rate
0.9%
Rent to Value Ratio
Active
$799,999
4
bds
|
3
ba
|
4,062
sqft
|
built
1974
7707 Lake St, Morton Grove, IL 60053
$-1,965
Cash flow
-12.8%
Cash-on-Cash Return
2.7%
Cap rate
0.5%
Rent to Value Ratio
Active
$429,000
3
bds
|
2
ba
|
1,162
sqft
|
built
1954
5010 Jarvis Ave, Skokie, IL 60077
$-731
Cash flow
-8.9%
Cash-on-Cash Return
3.6%
Cap rate
0.7%
Rent to Value Ratio
Active
$319,900
2
bds
|
4
ba
|
1,734
sqft
|
built
2001
59 Colonial Ct, Streamwood, IL 60107
$-537
Cash flow
-8.8%
Cash-on-Cash Return
3.7%
Cap rate
0.8%
Rent to Value Ratio
Active
$220,000
2
bds
|
2
ba
|
1,300
sqft
|
built
2000
10228 Southwest Hwy, Chicago Ridge, IL 60415
$-429
Cash flow
-10.2%
Cash-on-Cash Return
3.9%
Cap rate
0.9%
Rent to Value Ratio
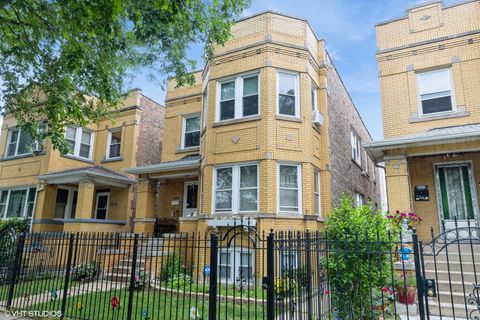
Active
$278,900
5
bds
|
2
ba
|
1,850
sqft
|
built
1964
12713 S Escanaba Ave, Chicago, IL 60633
$371
Cash flow
6.9%
Cash-on-Cash Return
7.3%
Cap rate
1.0%
Rent to Value Ratio
Active
$989,000
4
bds
|
3
ba
|
0
sqft
|
built
1961
2340 Pomona Ln, Wilmette, IL 60091
$-1,933
Cash flow
-10.2%
Cash-on-Cash Return
3.3%
Cap rate
0.6%
Rent to Value Ratio
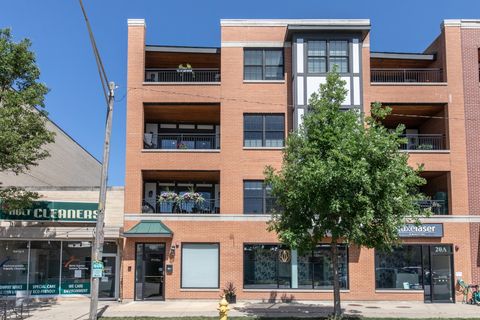
Active
$410,000
2
bds
|
3
ba
|
1,600
sqft
|
built
2003
1917 S State St, Chicago, IL 60616
$-841
Cash flow
-10.7%
Cash-on-Cash Return
3.2%
Cap rate
0.8%
Rent to Value Ratio

Active
$469,900
3
bds
|
2
ba
|
2,400
sqft
|
built
1959
6034 W 60th St, Chicago, IL 60638
$222
Cash flow
2.5%
Cash-on-Cash Return
6.2%
Cap rate
0.8%
Rent to Value Ratio
Active
$534,500
3
bds
|
3
ba
|
2,750
sqft
|
built
1967
9526 S Kilbourn Ave, Oak Lawn, IL 60453
$-1,303
Cash flow
-12.7%
Cash-on-Cash Return
2.8%
Cap rate
0.5%
Rent to Value Ratio
Active
$399,900
4
bds
|
2
ba
|
2,200
sqft
|
built
1908
3734 Lombard Ave, Berwyn, IL 60402
$-404
Cash flow
-5.3%
Cash-on-Cash Return
4.5%
Cap rate
0.8%
Rent to Value Ratio
Active
$259,900
4
bds
|
3
ba
|
1,000
sqft
|
built
1890
6929 S Loomis Blvd, Chicago, IL 60636
$313
Cash flow
6.3%
Cash-on-Cash Return
7.1%
Cap rate
0.9%
Rent to Value Ratio
Active
$600,000
5
bds
|
3
ba
|
2,537
sqft
|
built
1984
600 N Brookdale Dr, Schaumburg, IL 60194
$-1,382
Cash flow
-12.0%
Cash-on-Cash Return
2.9%
Cap rate
0.6%
Rent to Value Ratio
Active
$3,195,000
6
bds
|
8
ba
|
7,120
sqft
|
built
2010
4717 N Paulina St, Chicago, IL 60640
$-11,208
Cash flow
-18.3%
Cash-on-Cash Return
1.5%
Cap rate
0.3%
Rent to Value Ratio

Active
$459,900
4
bds
|
3
ba
|
2,093
sqft
|
built
1990
15 Harrison Ln, Streamwood, IL 60107
$-799
Cash flow
-9.1%
Cash-on-Cash Return
3.6%
Cap rate
0.7%
Rent to Value Ratio
Active
$249,900
3
bds
|
2
ba
|
1,600
sqft
|
built
1971
4155 176th Pl, Country Club Hills, IL 60478
$1
Cash flow
0.0%
Cash-on-Cash Return
5.7%
Cap rate
1.0%
Rent to Value Ratio
Active
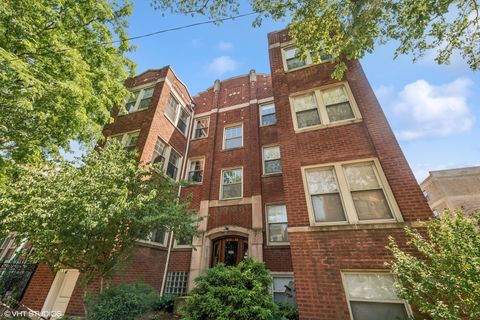
$375,000
2
bds
|
1
ba
|
0
sqft
|
built
1911
1471 W Foster Ave, Chicago, IL 60640
$-1,270
Cash flow
-17.7%
Cash-on-Cash Return
2.2%
Cap rate
0.5%
Rent to Value Ratio
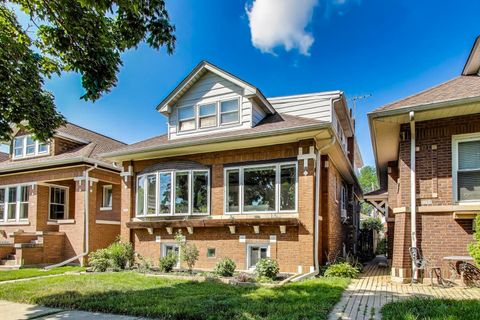
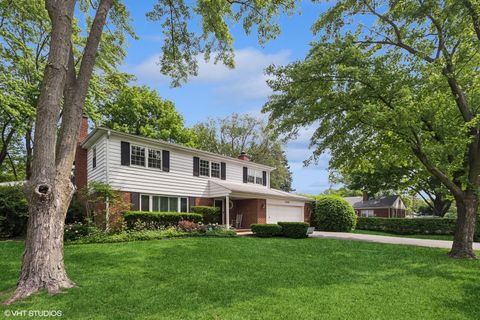
Active
$580,000
4
bds
|
4
ba
|
2,000
sqft
|
built
1926
5262 N Lind Ave, Chicago, IL 60630
$-1,035
Cash flow
-9.3%
Cash-on-Cash Return
4.1%
Cap rate
0.7%
Rent to Value Ratio
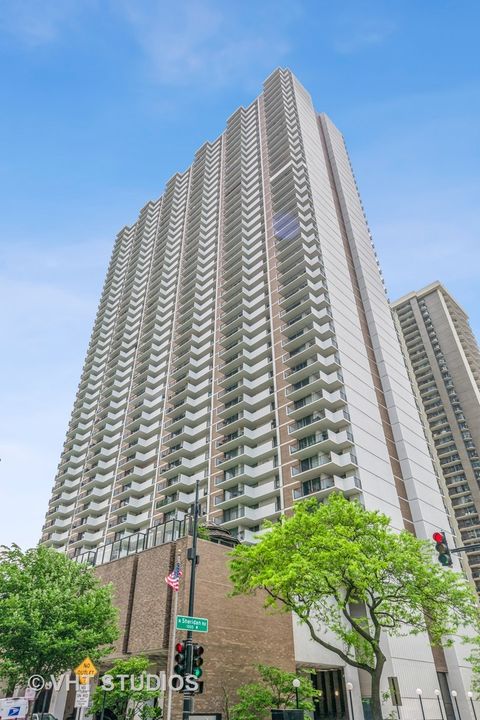
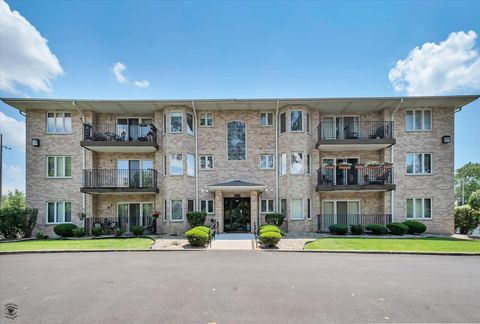
Active
$390,000
2
bds
|
2
ba
|
1,519
sqft
|
built
1971
6033 N Sheridan Rd, Chicago, IL 60660
$-1,295
Cash flow
-17.3%
Cash-on-Cash Return
2.3%
Cap rate
0.7%
Rent to Value Ratio
Active
$149,900
0
bds
|
1
ba
|
550
sqft
|
built
1952
2909 N Sheridan Rd, Chicago, IL 60657
$-230
Cash flow
-8.0%
Cash-on-Cash Return
4.4%
Cap rate
1.1%
Rent to Value Ratio
Active
$227,000
4
bds
|
3
ba
|
1,895
sqft
|
built
1916
53 W 123rd St, Chicago, IL 60628
$120
Cash flow
2.8%
Cash-on-Cash Return
6.9%
Cap rate
1.0%
Rent to Value Ratio
Active
$499,000
4
bds
|
3
ba
|
0
sqft
|
built
1930
5310 W Parker Ave, Chicago, IL 60639
$-1,710
Cash flow
-17.9%
Cash-on-Cash Return
2.2%
Cap rate
0.4%
Rent to Value Ratio
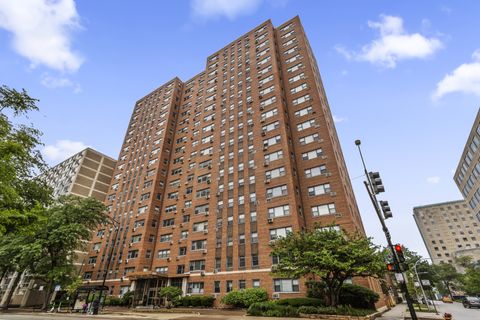
Active
$619,000
3
bds
|
3
ba
|
2,300
sqft
|
built
1969
1110 N Lake Shore Dr, Chicago, IL 60611
$-3,944
Cash flow
-33.2%
Cash-on-Cash Return
-1.4%
Cap rate
0.7%
Rent to Value Ratio
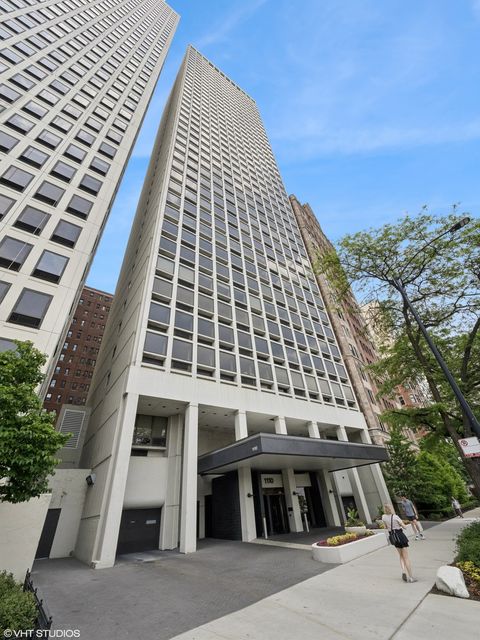
Active
$225,000
1
bds
|
1
ba
|
849
sqft
|
built
1992
440 N Wabash Ave, Chicago, IL 60611
$-607
Cash flow
-14.1%
Cash-on-Cash Return
3.0%
Cap rate
0.9%
Rent to Value Ratio
Active
$869,900
5
bds
|
3
ba
|
0
sqft
|
built
1931
5901 N Navarre Ave, Chicago, IL 60631
$-2,901
Cash flow
-17.4%
Cash-on-Cash Return
2.3%
Cap rate
0.4%
Rent to Value Ratio
Active
$484,500
4
bds
|
3
ba
|
2,000
sqft
|
built
1974
507 Wingate Dr, Schaumburg, IL 60193
$-808
Cash flow
-8.7%
Cash-on-Cash Return
3.7%
Cap rate
0.7%
Rent to Value Ratio
Active
$349,900
3
bds
|
2
ba
|
1,598
sqft
|
built
1968
622 Pleasant Pl, Streamwood, IL 60107
$-402
Cash flow
-6.0%
Cash-on-Cash Return
4.3%
Cap rate
0.7%
Rent to Value Ratio
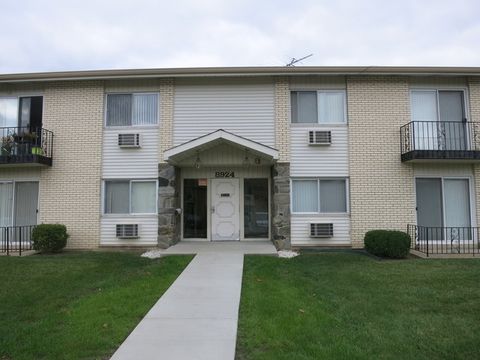
Active
$149,900
1
bds
|
1
ba
|
680
sqft
|
built
1974
8924 Kenneth Dr, Des Plaines, IL 60016
$-27
Cash flow
-0.9%
Cash-on-Cash Return
5.5%
Cap rate
1.1%
Rent to Value Ratio
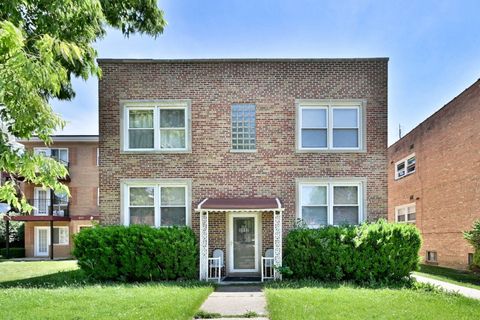
Active
$419,900
2
bds
|
1
ba
|
1,266
sqft
|
built
1954
5049 Birchwood Ave, Skokie, IL 60077
$-403
Cash flow
-5.0%
Cash-on-Cash Return
4.5%
Cap rate
0.8%
Rent to Value Ratio
Active
$849,900
8
bds
|
4
ba
|
0
sqft
|
built
1950
8117 Keating Ave, Skokie, IL 60076
$-3,742
Cash flow
-23.0%
Cash-on-Cash Return
0.4%
Cap rate
0.3%
Rent to Value Ratio
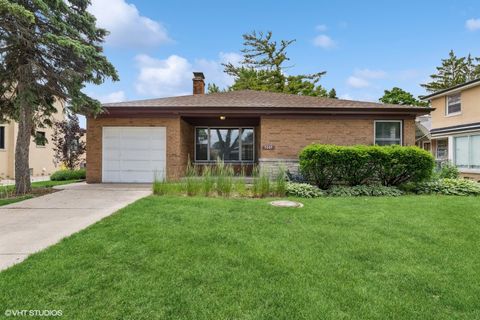
Active
$249,000
3
bds
|
1
ba
|
1,279
sqft
|
built
1925
14603 Kenton Ave, Midlothian, IL 60445
$65
Cash flow
1.4%
Cash-on-Cash Return
6.6%
Cap rate
1.0%
Rent to Value Ratio
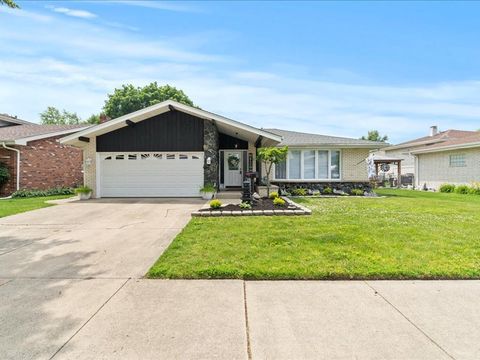
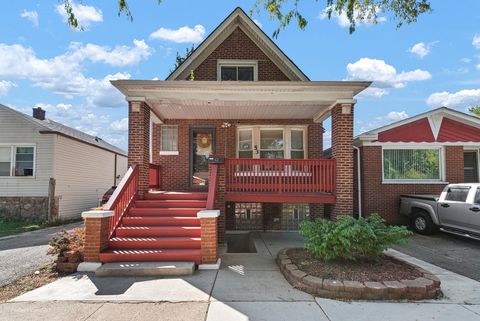
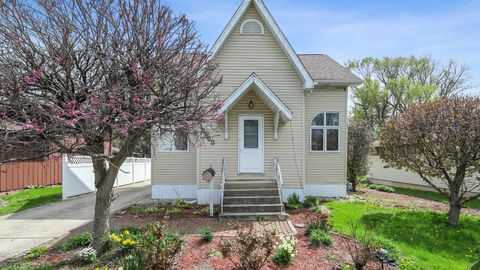
Active
$114,900
3
bds
|
2
ba
|
1,048
sqft
|
built
1956
3025 Sherwood Ave, Markham, IL 60428
$551
Cash flow
25.0%
Cash-on-Cash Return
12.0%
Cap rate
1.9%
Rent to Value Ratio
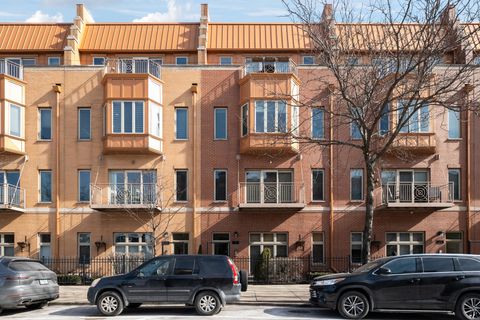
Active
$689,000
3
bds
|
2
ba
|
1,905
sqft
|
built
2017
650 N Morgan St, Chicago, IL 60642
$-1,424
Cash flow
-10.8%
Cash-on-Cash Return
3.2%
Cap rate
0.7%
Rent to Value Ratio