Cook County Investment Properties for Sale
Browse homes for sale and investment properties in Cook County. Refine your search by price, property type, or more.
Best cash flowing properties in Cook County
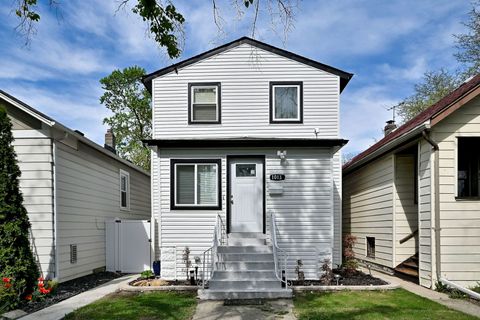
Active
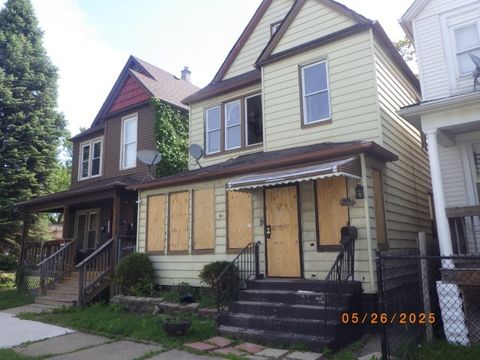
$54,100
4
bds
|
2
ba
|
0
sqft
|
built
1878
11815 S Sangamon St, Chicago, IL 60643
$1,230
Cash flow
26.5%
Cash-on-Cash Return
27.3%
Cap rate
3.3%
Rent to Value Ratio
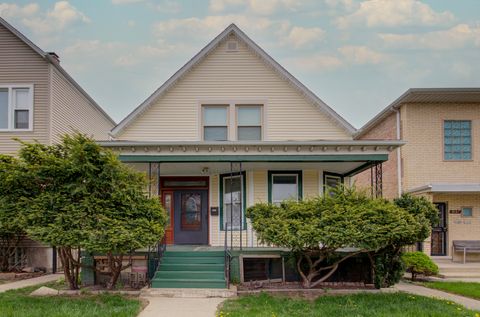
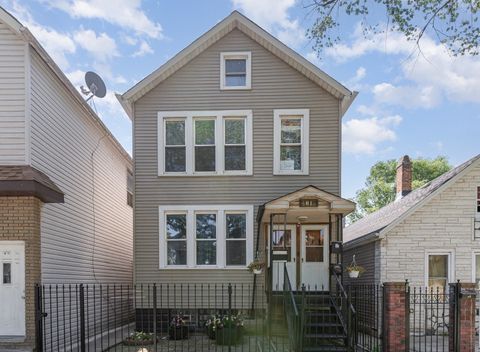
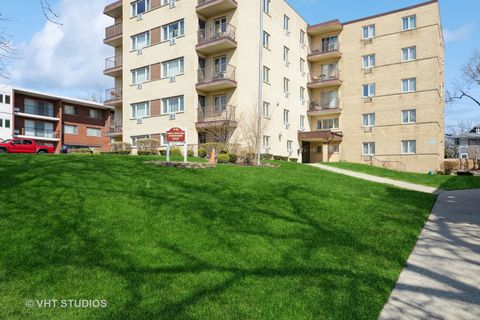
Active
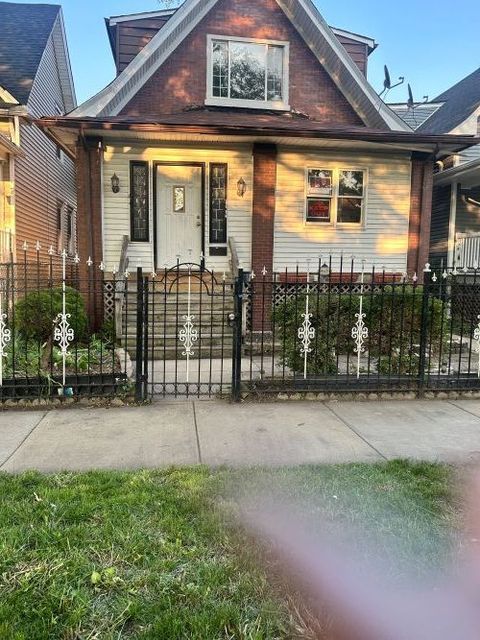
$200,000
4
bds
|
3
ba
|
2,019
sqft
|
built
1908
949 N Lawler Ave, Chicago, IL 60651
$450
Cash flow
11.7%
Cash-on-Cash Return
9.0%
Cap rate
1.3%
Rent to Value Ratio
6,262 out of 8,468 properties for sale in Cook County
Limited Results Shown
Create a free account, or log in to reveal all property listings and enjoy the complete experience.
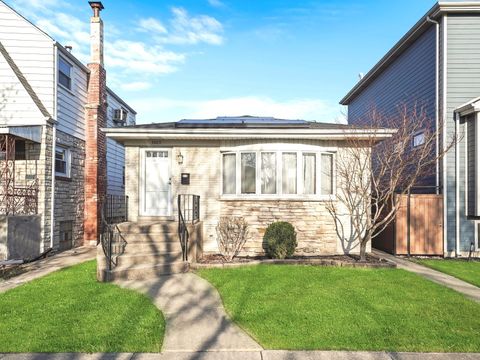
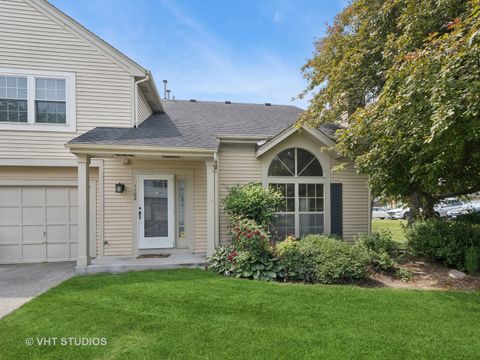
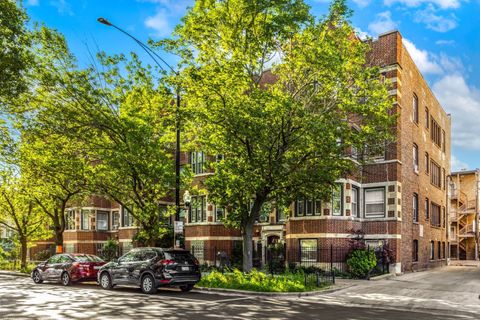
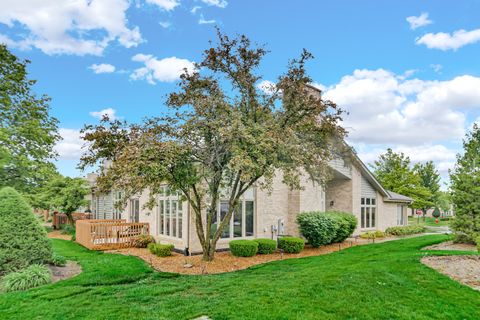
Active
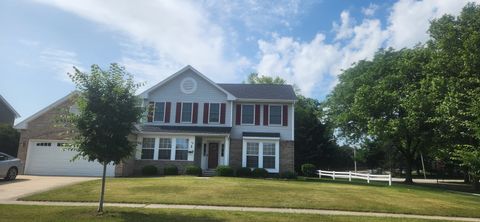
$475,000
4
bds
|
4
ba
|
2,661
sqft
|
built
1995
95 Brentwood Trl, Elgin, IL 60120
$-973
Cash flow
-10.7%
Cash-on-Cash Return
3.8%
Cap rate
0.7%
Rent to Value Ratio
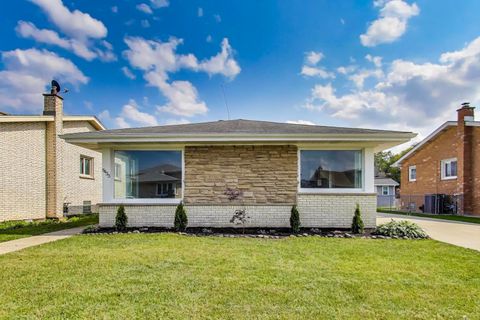
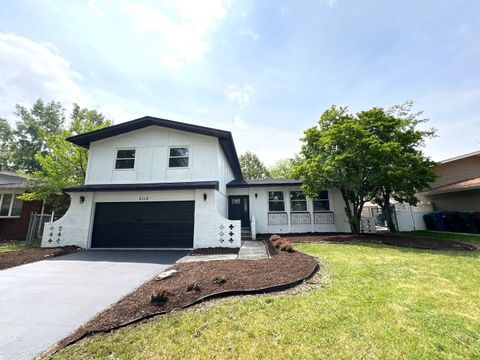
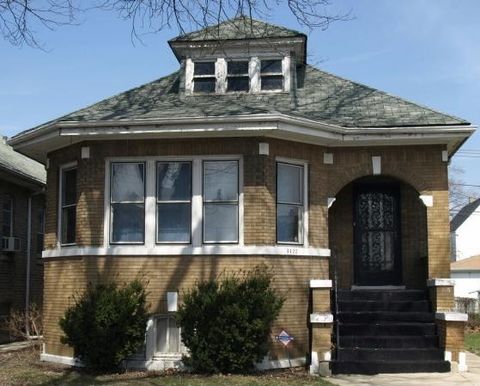
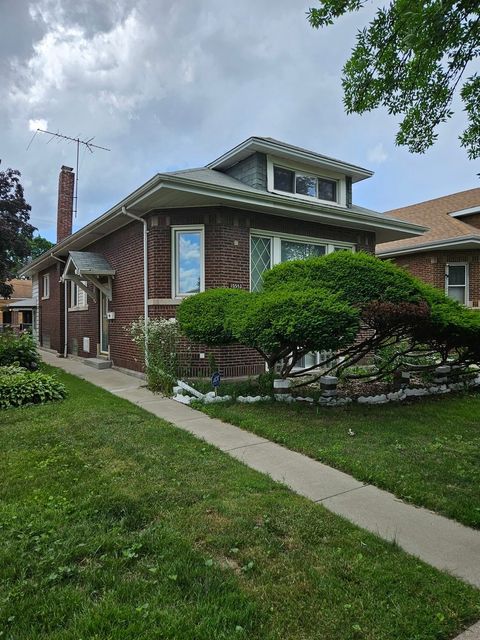
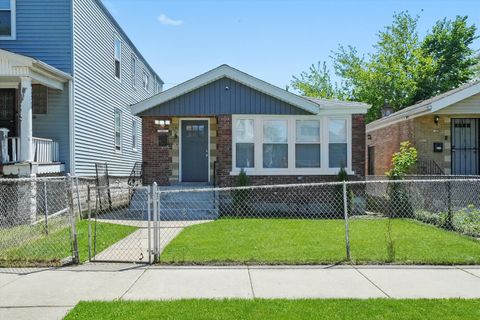
Active
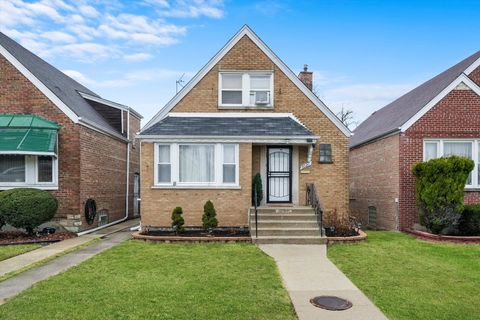
$269,999
4
bds
|
3
ba
|
1,337
sqft
|
built
1949
8020 S Mozart St, Chicago, IL 60652
$-28
Cash flow
-0.5%
Cash-on-Cash Return
5.6%
Cap rate
0.9%
Rent to Value Ratio
Active
$499,000
3
bds
|
3
ba
|
1,600
sqft
|
built
1925
1013 Ferdinand Ave, Forest Park, IL 60130
$-1,367
Cash flow
-14.3%
Cash-on-Cash Return
2.4%
Cap rate
0.4%
Rent to Value Ratio
Active
$325,000
5
bds
|
2
ba
|
1,968
sqft
|
built
1912
5145 S Troy St, Chicago, IL 60632
$-220
Cash flow
-3.5%
Cash-on-Cash Return
4.9%
Cap rate
0.6%
Rent to Value Ratio
Active
$409,900
3
bds
|
2
ba
|
1,176
sqft
|
built
1966
3405 N Osage Ave, Chicago, IL 60634
$-197
Cash flow
-2.5%
Cash-on-Cash Return
5.1%
Cap rate
0.7%
Rent to Value Ratio
Active
$548,500
4
bds
|
3
ba
|
2,200
sqft
|
built
1967
8433 W Betty Ter, Niles, IL 60714
$-571
Cash flow
-5.4%
Cash-on-Cash Return
4.4%
Cap rate
0.6%
Rent to Value Ratio
Active
$279,000
2
bds
|
2
ba
|
1,155
sqft
|
built
1986
1102 N Knollwood Dr, Palatine, IL 60067
$-520
Cash flow
-9.7%
Cash-on-Cash Return
3.4%
Cap rate
0.8%
Rent to Value Ratio
Active
$255,000
1
bds
|
1
ba
|
835
sqft
|
built
1974
5415 N Sheridan Rd, Chicago, IL 60640
$-806
Cash flow
-16.5%
Cash-on-Cash Return
1.9%
Cap rate
0.9%
Rent to Value Ratio
Active
$350,000
3
bds
|
3
ba
|
2,400
sqft
|
built
1979
5115 Roberta Ln, Richton Park, IL 60471
$-893
Cash flow
-13.3%
Cash-on-Cash Return
2.6%
Cap rate
0.7%
Rent to Value Ratio
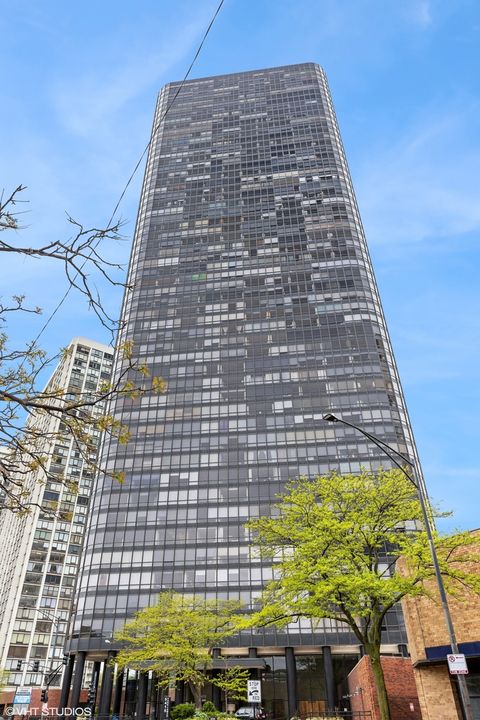
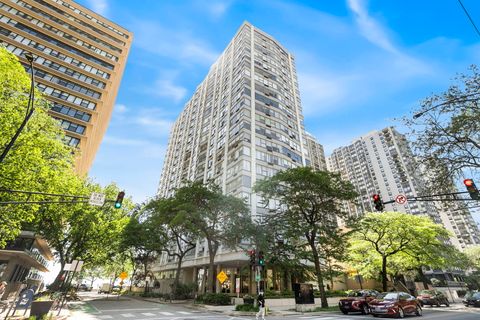
Active
$575,000
1
bds
|
2
ba
|
1,068
sqft
|
built
2008
240 E Illinois St, Chicago, IL 60611
$-1,700
Cash flow
-15.4%
Cash-on-Cash Return
2.1%
Cap rate
0.7%
Rent to Value Ratio
Active
$349,000
9
bds
|
5
ba
|
0
sqft
|
built
1888
4810 S Elizabeth St, Chicago, IL 60609
$-378
Cash flow
-5.7%
Cash-on-Cash Return
5.0%
Cap rate
0.6%
Rent to Value Ratio
Active
$199,999
2
bds
|
1
ba
|
1,367
sqft
|
built
1923
4422 W Iowa St, Chicago, IL 60651
$387
Cash flow
10.1%
Cash-on-Cash Return
8.6%
Cap rate
1.3%
Rent to Value Ratio
Active
$250,000
2
bds
|
1
ba
|
1,000
sqft
|
built
1918
1252 W Pratt Blvd, Chicago, IL 60626
$-725
Cash flow
-15.1%
Cash-on-Cash Return
2.8%
Cap rate
0.7%
Rent to Value Ratio
Active
$250,000
2
bds
|
2
ba
|
0
sqft
|
built
1968
5757 N Sheridan Rd, Chicago, IL 60660
$-1,391
Cash flow
-29.0%
Cash-on-Cash Return
-0.4%
Cap rate
0.8%
Rent to Value Ratio
Active
$1,799,900
4
bds
|
5
ba
|
4,000
sqft
|
built
1987
1957 N Maud Ave, Chicago, IL 60614
$-7,229
Cash flow
-21.0%
Cash-on-Cash Return
1.4%
Cap rate
0.3%
Rent to Value Ratio
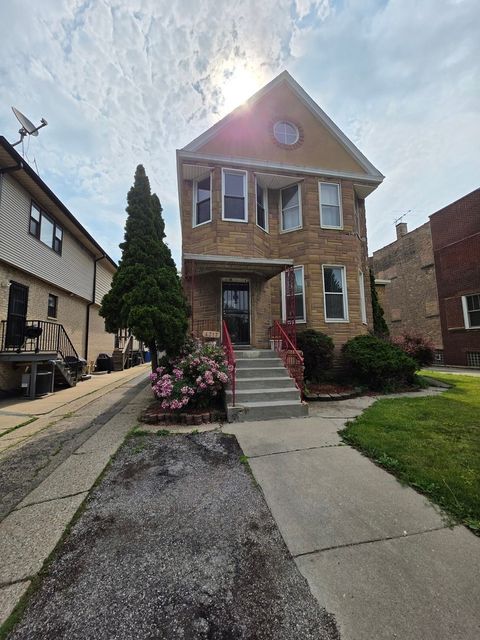
Active
$200,000
4
bds
|
3
ba
|
2,019
sqft
|
built
1908
949 N Lawler Ave, Chicago, IL 60651
$450
Cash flow
11.7%
Cash-on-Cash Return
9.0%
Cap rate
1.3%
Rent to Value Ratio
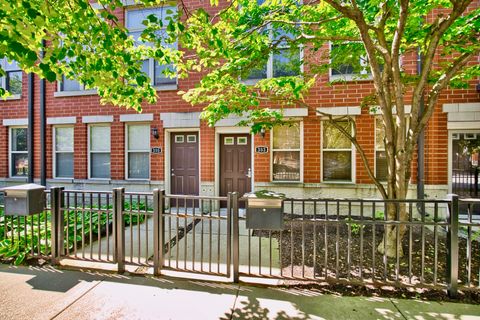
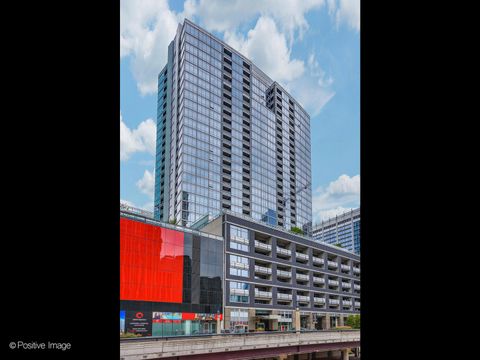
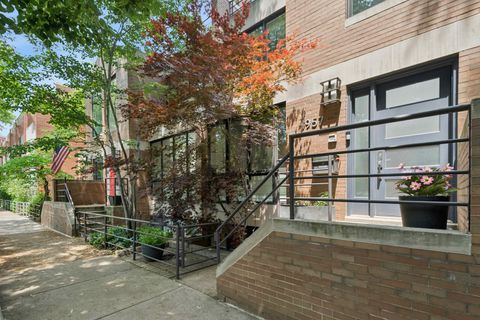
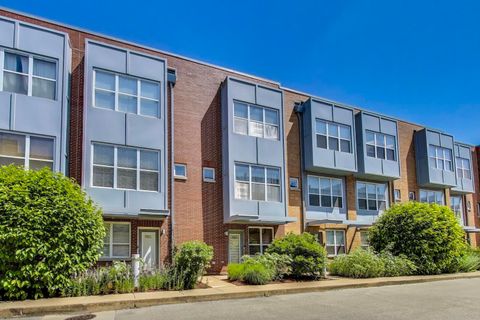
Active
$479,000
2
bds
|
3
ba
|
2,000
sqft
|
built
2005
353 E Eastgate Pl, Chicago, IL 60616
$-1,104
Cash flow
-12.0%
Cash-on-Cash Return
3.5%
Cap rate
0.8%
Rent to Value Ratio
Active
$899,995
4
bds
|
4
ba
|
0
sqft
|
built
2001
1749 W Roscoe St, Chicago, IL 60657
$-2,176
Cash flow
-12.6%
Cash-on-Cash Return
3.4%
Cap rate
0.6%
Rent to Value Ratio
Active
$335,000
1
bds
|
1
ba
|
0
sqft
|
built
1910
1720 N Marshfield Ave, Chicago, IL 60622
$-430
Cash flow
-6.7%
Cash-on-Cash Return
4.7%
Cap rate
1.0%
Rent to Value Ratio
Active
$499,900
2
bds
|
2
ba
|
1,900
sqft
|
built
2000
3209 N Drake Ave, Chicago, IL 60618
$-1,054
Cash flow
-11.0%
Cash-on-Cash Return
3.7%
Cap rate
0.7%
Rent to Value Ratio
Active
$54,100
4
bds
|
2
ba
|
0
sqft
|
built
1878
11815 S Sangamon St, Chicago, IL 60643
$1,230
Cash flow
26.5%
Cash-on-Cash Return
27.3%
Cap rate
3.3%
Rent to Value Ratio
Active
$620,000
4
bds
|
3
ba
|
0
sqft
|
built
1898
4317 N Kedvale Ave, Chicago, IL 60641
$-2,460
Cash flow
-20.7%
Cash-on-Cash Return
1.5%
Cap rate
0.4%
Rent to Value Ratio
Active
$245,000
2
bds
|
2
ba
|
2,391
sqft
|
built
1928
10552 S Normal Ave, Chicago, IL 60628
$133
Cash flow
2.8%
Cash-on-Cash Return
6.9%
Cap rate
0.9%
Rent to Value Ratio
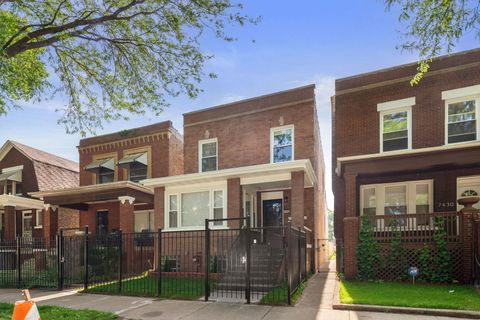
Active
$359,000
4
bds
|
3
ba
|
2,200
sqft
|
built
1903
7432 S King Dr, Chicago, IL 60619
$-480
Cash flow
-7.0%
Cash-on-Cash Return
4.7%
Cap rate
0.6%
Rent to Value Ratio
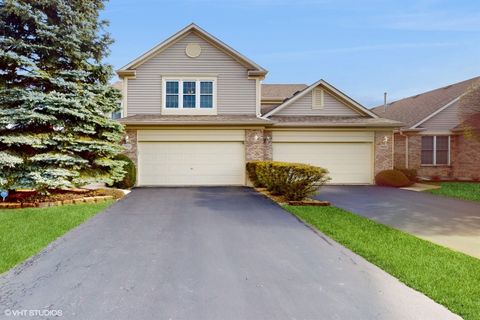
Active
$359,000
3
bds
|
3
ba
|
0
sqft
|
built
2006
14143 John Humphrey Dr, Orland Park, IL 60462
$-846
Cash flow
-12.3%
Cash-on-Cash Return
3.4%
Cap rate
0.7%
Rent to Value Ratio
Active
$415,000
2
bds
|
2
ba
|
0
sqft
|
built
2001
2307 W Wolfram St, Chicago, IL 60618
$-1,125
Cash flow
-14.1%
Cash-on-Cash Return
2.4%
Cap rate
0.7%
Rent to Value Ratio
Active
$285,000
1
bds
|
2
ba
|
2,421
sqft
|
built
1975
4 Cour La Salle, Palos Hills, IL 60465
$66
Cash flow
1.2%
Cash-on-Cash Return
6.0%
Cap rate
1.1%
Rent to Value Ratio
Active
$334,900
3
bds
|
2
ba
|
1,745
sqft
|
built
1956
2936 Willow Rd, Homewood, IL 60430
$-416
Cash flow
-6.5%
Cash-on-Cash Return
4.2%
Cap rate
0.7%
Rent to Value Ratio
Active
$114,900
1
bds
|
1
ba
|
0
sqft
|
built
1975
2030 W 111th St, Chicago, IL 60643
$231
Cash flow
10.5%
Cash-on-Cash Return
8.1%
Cap rate
1.3%
Rent to Value Ratio
Active
$249,900
3
bds
|
2
ba
|
1,500
sqft
|
built
1955
1467 W 73rd St, Chicago, IL 60636
$39
Cash flow
0.8%
Cash-on-Cash Return
5.9%
Cap rate
0.8%
Rent to Value Ratio
Active
$449,900
3
bds
|
3
ba
|
2,042
sqft
|
built
1993
19 W Bay Rd, Palos Heights, IL 60463
$-1,107
Cash flow
-12.8%
Cash-on-Cash Return
2.7%
Cap rate
0.6%
Rent to Value Ratio

Active
$187,000
2
bds
|
1
ba
|
927
sqft
|
built
1926
6457 N California Ave, Chicago, IL 60645
$-422
Cash flow
-11.8%
Cash-on-Cash Return
3.0%
Cap rate
0.9%
Rent to Value Ratio
Active
$364,900
3
bds
|
3
ba
|
2,178
sqft
|
built
1997
7852 Bristol Park Dr, Tinley Park, IL 60477
$-485
Cash flow
-6.9%
Cash-on-Cash Return
4.1%
Cap rate
0.8%
Rent to Value Ratio
Active
$189,900
2
bds
|
1
ba
|
1,000
sqft
|
built
1921
1624 W Farwell Ave, Chicago, IL 60626
$-135
Cash flow
-3.7%
Cash-on-Cash Return
4.8%
Cap rate
0.9%
Rent to Value Ratio
Active
$675,000
2
bds
|
2
ba
|
1,288
sqft
|
built
2020
5748 N Hermitage Ave, Chicago, IL 60660
$-1,561
Cash flow
-12.1%
Cash-on-Cash Return
3.5%
Cap rate
0.8%
Rent to Value Ratio
Active
$500,000
3
bds
|
2
ba
|
1,550
sqft
|
built
1960
360 W Wellington Ave, Chicago, IL 60657
$-1,081
Cash flow
-11.3%
Cash-on-Cash Return
3.7%
Cap rate
0.9%
Rent to Value Ratio
Active
$225,000
3
bds
|
2
ba
|
1,354
sqft
|
built
1923
7724 S Chappel Ave, Chicago, IL 60649
$-72
Cash flow
-1.7%
Cash-on-Cash Return
5.9%
Cap rate
0.9%
Rent to Value Ratio
Active
$300,000
1
bds
|
1
ba
|
769
sqft
|
built
2006
700 N Larrabee St, Chicago, IL 60654
$-883
Cash flow
-15.4%
Cash-on-Cash Return
2.7%
Cap rate
0.8%
Rent to Value Ratio
Active
$775,000
3
bds
|
3
ba
|
0
sqft
|
built
2015
3004 W Lyndale St, Chicago, IL 60647
$-2,171
Cash flow
-14.6%
Cash-on-Cash Return
2.9%
Cap rate
0.6%
Rent to Value Ratio

Active
$409,999
5
bds
|
4
ba
|
2,126
sqft
|
built
1932
629 E 87th Pl, Chicago, IL 60619
$-782
Cash flow
-10.0%
Cash-on-Cash Return
4.0%
Cap rate
0.6%
Rent to Value Ratio