Cook County Investment Properties for Sale
Browse homes for sale and investment properties in Cook County. Refine your search by price, property type, or more.
Best cash flowing properties in Cook County
Active
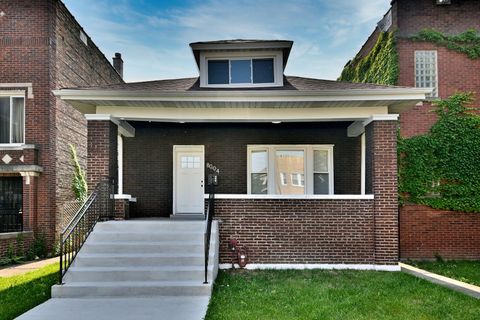
$278,900
3
bds
|
2
ba
|
2,300
sqft
|
built
1916
8004 S Ada St, Chicago, IL 60620
$538
Cash flow
10.1%
Cash-on-Cash Return
8.0%
Cap rate
1.0%
Rent to Value Ratio
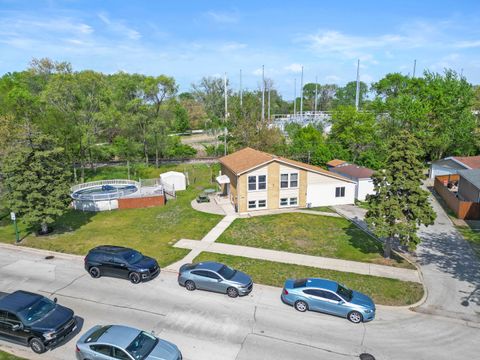
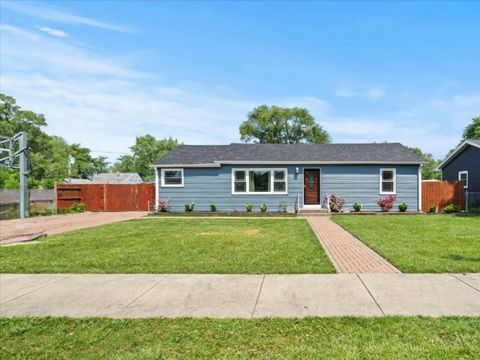
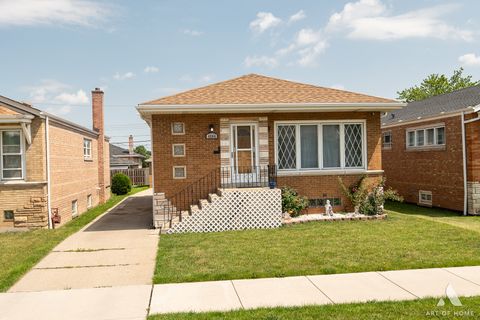
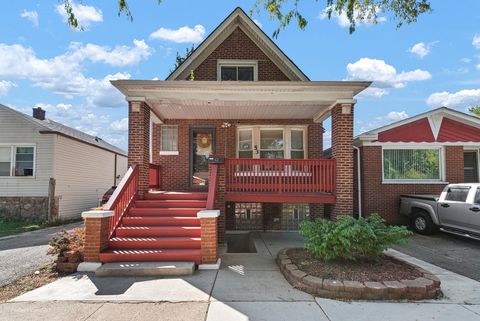
Active
$278,900
5
bds
|
2
ba
|
1,850
sqft
|
built
1964
12713 S Escanaba Ave, Chicago, IL 60633
$371
Cash flow
6.9%
Cash-on-Cash Return
7.3%
Cap rate
1.0%
Rent to Value Ratio
6,273 out of 8,479 properties for sale in Cook County
Limited Results Shown
Create a free account, or log in to reveal all property listings and enjoy the complete experience.
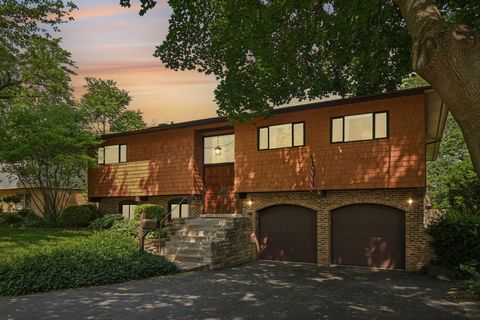
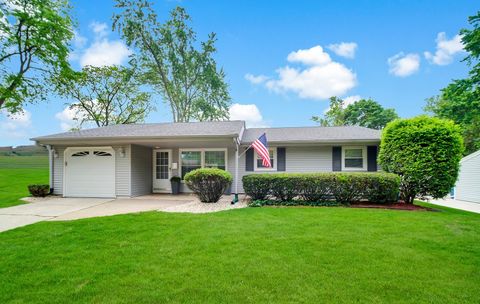
Active
$725,000
4
bds
|
4
ba
|
2,600
sqft
|
built
1965
129 Kainer Ave, Barrington, IL 60010
$-1,344
Cash flow
-9.7%
Cash-on-Cash Return
3.5%
Cap rate
0.6%
Rent to Value Ratio
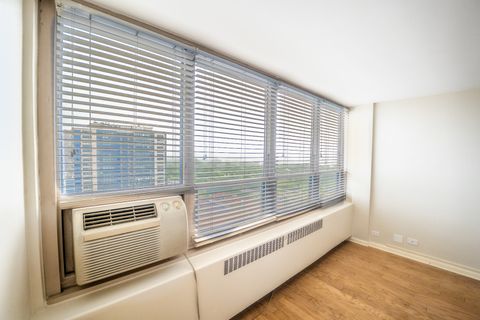
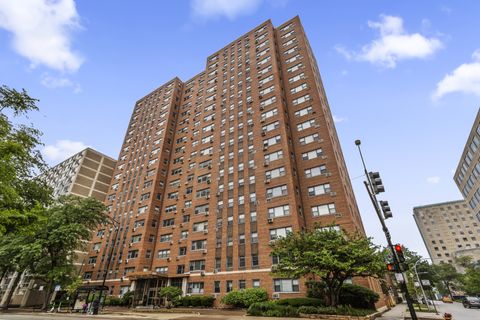
Active
$260,000
2
bds
|
1
ba
|
950
sqft
|
built
1956
3950 N Lake Shore Dr, Chicago, IL 60613
$-620
Cash flow
-12.4%
Cash-on-Cash Return
2.8%
Cap rate
1.0%
Rent to Value Ratio
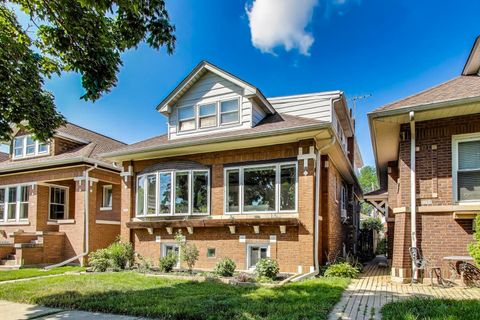
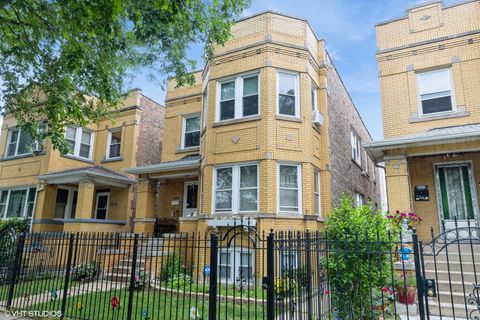
Active
$278,900
3
bds
|
2
ba
|
2,300
sqft
|
built
1916
8004 S Ada St, Chicago, IL 60620
$538
Cash flow
10.1%
Cash-on-Cash Return
8.0%
Cap rate
1.0%
Rent to Value Ratio
Active
$358,900
3
bds
|
1
ba
|
1,350
sqft
|
built
1951
7937 Lotus Ave, Burbank, IL 60459
$-487
Cash flow
-7.1%
Cash-on-Cash Return
4.0%
Cap rate
0.6%
Rent to Value Ratio
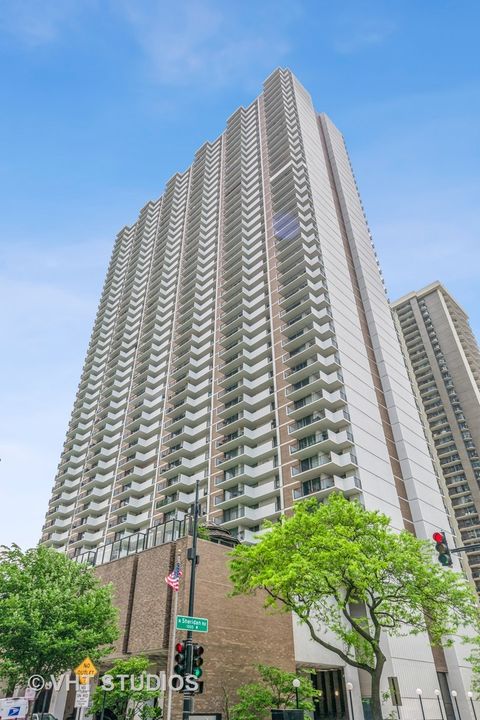
Active
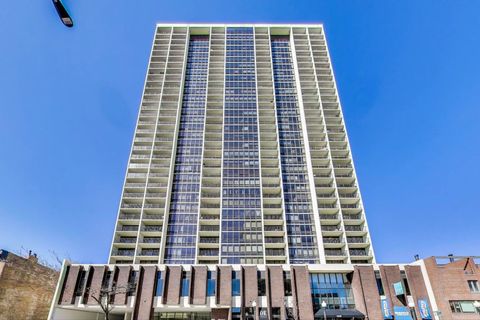
$250,000
1
bds
|
1
ba
|
800
sqft
|
built
1960
2930 N Sheridan Rd, Chicago, IL 60657
$-690
Cash flow
-14.4%
Cash-on-Cash Return
2.4%
Cap rate
0.9%
Rent to Value Ratio
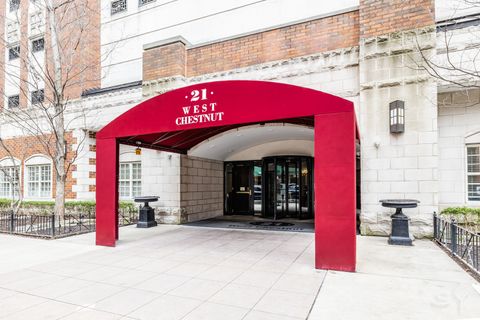
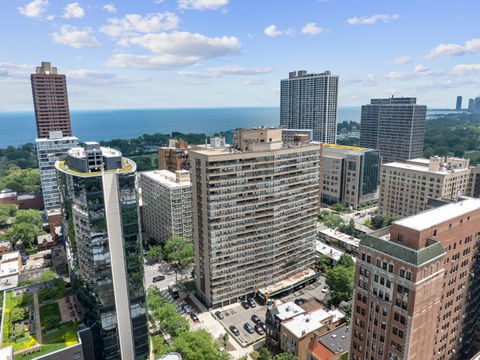
Active
$299,900
1
bds
|
1
ba
|
0
sqft
|
built
1999
21 W Chestnut St, Chicago, IL 60610
$-553
Cash flow
-9.6%
Cash-on-Cash Return
3.5%
Cap rate
0.8%
Rent to Value Ratio
Active
$850,000
4
bds
|
3
ba
|
3,111
sqft
|
built
1966
2310 Malik Ct, Glenview, IL 60025
$-1,716
Cash flow
-10.5%
Cash-on-Cash Return
3.3%
Cap rate
0.6%
Rent to Value Ratio
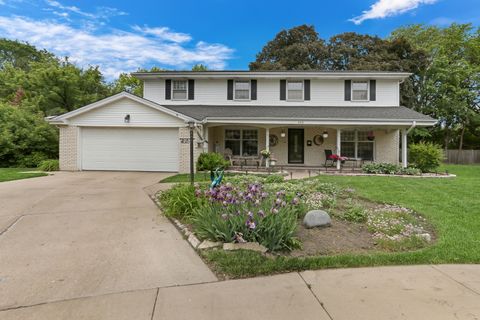
Active
$365,000
3
bds
|
1
ba
|
1,100
sqft
|
built
1963
1607 Warwick Ln, Schaumburg, IL 60193
$-528
Cash flow
-7.5%
Cash-on-Cash Return
3.9%
Cap rate
0.7%
Rent to Value Ratio
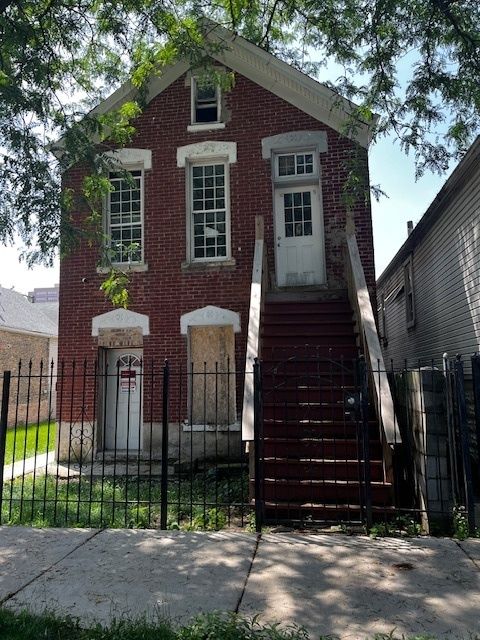
Active
$480,000
bds
|
0
ba
|
0
sqft
|
built
1880
2911 W 25th St, Chicago, IL 60623
$-1,460
Cash flow
-15.9%
Cash-on-Cash Return
2.6%
Cap rate
0.4%
Rent to Value Ratio
Active
$329,000
4
bds
|
2
ba
|
1,800
sqft
|
built
1923
2620 E 91st St, Chicago, IL 60617
$-532
Cash flow
-8.4%
Cash-on-Cash Return
4.3%
Cap rate
0.6%
Rent to Value Ratio
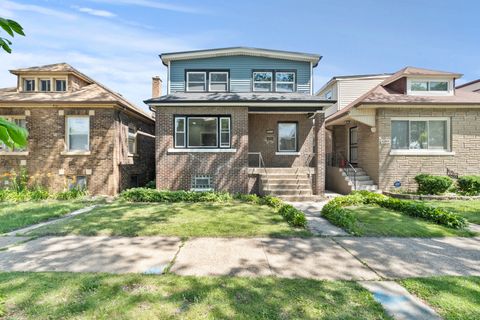
Active
$649,000
2
bds
|
2
ba
|
0
sqft
|
built
2013
948 N Honore St, Chicago, IL 60622
$-1,436
Cash flow
-11.5%
Cash-on-Cash Return
3.6%
Cap rate
0.7%
Rent to Value Ratio
Active
$314,900
1
bds
|
1
ba
|
804
sqft
|
built
1971
1636 N Wells St, Chicago, IL 60614
$-1,131
Cash flow
-18.7%
Cash-on-Cash Return
2.0%
Cap rate
0.8%
Rent to Value Ratio
Active
$359,900
3
bds
|
2
ba
|
1,170
sqft
|
built
1958
4504 W 65th Pl, Chicago, IL 60629
$-427
Cash flow
-6.2%
Cash-on-Cash Return
4.8%
Cap rate
0.7%
Rent to Value Ratio
Active
$149,900
2
bds
|
2
ba
|
950
sqft
|
built
1965
1451 E 55th Pl, Chicago, IL 60637
$-611
Cash flow
-21.3%
Cash-on-Cash Return
1.4%
Cap rate
1.4%
Rent to Value Ratio
Active
$650,000
7
bds
|
3
ba
|
0
sqft
|
built
1919
6208 N Artesian Ave, Chicago, IL 60659
$-2,235
Cash flow
-17.9%
Cash-on-Cash Return
2.1%
Cap rate
0.4%
Rent to Value Ratio
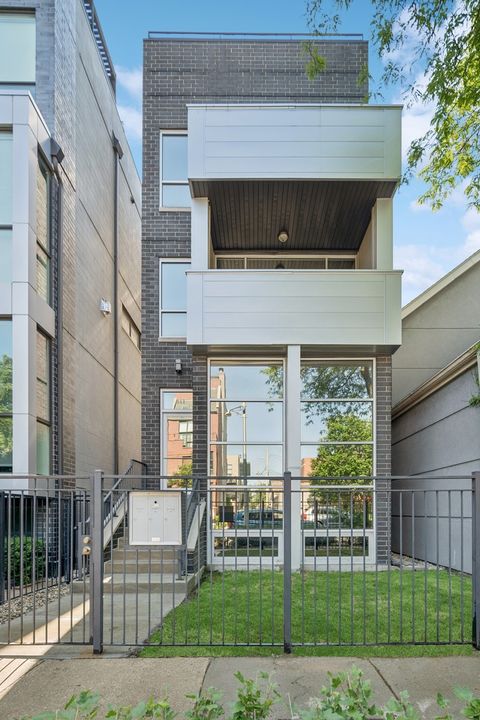
Active
$725,000
2
bds
|
2
ba
|
0
sqft
|
built
2015
2125 N Mozart St, Chicago, IL 60647
$-1,704
Cash flow
-12.3%
Cash-on-Cash Return
3.4%
Cap rate
0.6%
Rent to Value Ratio
Active
$269,900
2
bds
|
2
ba
|
0
sqft
|
built
1927
1550 S Blue Island Ave, Chicago, IL 60608
$-923
Cash flow
-17.8%
Cash-on-Cash Return
2.2%
Cap rate
0.8%
Rent to Value Ratio
Active
$199,900
2
bds
|
2
ba
|
1,350
sqft
|
built
2005
6938 S Dorchester Ave, Chicago, IL 60637
$167
Cash flow
4.4%
Cash-on-Cash Return
7.3%
Cap rate
1.0%
Rent to Value Ratio
Active
$349,900
2
bds
|
2
ba
|
980
sqft
|
built
1920
1070 W 15th St, Chicago, IL 60608
$-1,053
Cash flow
-15.7%
Cash-on-Cash Return
2.7%
Cap rate
0.7%
Rent to Value Ratio
Active
$325,000
1
bds
|
1
ba
|
1,250
sqft
|
built
1909
2401 W Ohio St, Chicago, IL 60612
$-604
Cash flow
-9.7%
Cash-on-Cash Return
4.0%
Cap rate
0.9%
Rent to Value Ratio
Active
$625,000
3
bds
|
4
ba
|
2,580
sqft
|
built
1925
7427 S Oglesby Ave, Chicago, IL 60649
$-2,041
Cash flow
-17.0%
Cash-on-Cash Return
2.3%
Cap rate
0.4%
Rent to Value Ratio
Active
$450,000
3
bds
|
2
ba
|
1,503
sqft
|
built
1954
1820 N 18th Ave, Melrose Park, IL 60160
$-952
Cash flow
-11.0%
Cash-on-Cash Return
3.7%
Cap rate
0.6%
Rent to Value Ratio
Active
$3,195,000
6
bds
|
8
ba
|
7,120
sqft
|
built
2010
4717 N Paulina St, Chicago, IL 60640
$-11,208
Cash flow
-18.3%
Cash-on-Cash Return
1.5%
Cap rate
0.3%
Rent to Value Ratio

Active
$459,900
4
bds
|
3
ba
|
2,093
sqft
|
built
1990
15 Harrison Ln, Streamwood, IL 60107
$-799
Cash flow
-9.1%
Cash-on-Cash Return
3.6%
Cap rate
0.7%
Rent to Value Ratio
Active
$534,500
3
bds
|
3
ba
|
2,750
sqft
|
built
1967
9526 S Kilbourn Ave, Oak Lawn, IL 60453
$-1,303
Cash flow
-12.7%
Cash-on-Cash Return
2.8%
Cap rate
0.5%
Rent to Value Ratio

Active
$469,900
3
bds
|
2
ba
|
2,400
sqft
|
built
1959
6034 W 60th St, Chicago, IL 60638
$222
Cash flow
2.5%
Cash-on-Cash Return
6.2%
Cap rate
0.8%
Rent to Value Ratio
Active
$410,000
2
bds
|
3
ba
|
1,600
sqft
|
built
2003
1917 S State St, Chicago, IL 60616
$-841
Cash flow
-10.7%
Cash-on-Cash Return
3.2%
Cap rate
0.8%
Rent to Value Ratio
Active
$278,900
5
bds
|
2
ba
|
1,850
sqft
|
built
1964
12713 S Escanaba Ave, Chicago, IL 60633
$371
Cash flow
6.9%
Cash-on-Cash Return
7.3%
Cap rate
1.0%
Rent to Value Ratio
Active
$249,900
3
bds
|
2
ba
|
1,600
sqft
|
built
1971
4155 176th Pl, Country Club Hills, IL 60478
$1
Cash flow
0.0%
Cash-on-Cash Return
5.7%
Cap rate
1.0%
Rent to Value Ratio
Active
$600,000
5
bds
|
3
ba
|
2,537
sqft
|
built
1984
600 N Brookdale Dr, Schaumburg, IL 60194
$-1,382
Cash flow
-12.0%
Cash-on-Cash Return
2.9%
Cap rate
0.6%
Rent to Value Ratio
Active
$259,900
4
bds
|
3
ba
|
1,000
sqft
|
built
1890
6929 S Loomis Blvd, Chicago, IL 60636
$313
Cash flow
6.3%
Cash-on-Cash Return
7.1%
Cap rate
0.9%
Rent to Value Ratio
Active
$989,000
4
bds
|
3
ba
|
0
sqft
|
built
1961
2340 Pomona Ln, Wilmette, IL 60091
$-1,933
Cash flow
-10.2%
Cash-on-Cash Return
3.3%
Cap rate
0.6%
Rent to Value Ratio
Active
$399,900
4
bds
|
2
ba
|
2,200
sqft
|
built
1908
3734 Lombard Ave, Berwyn, IL 60402
$-404
Cash flow
-5.3%
Cash-on-Cash Return
4.5%
Cap rate
0.8%
Rent to Value Ratio
Active
$375,000
2
bds
|
1
ba
|
0
sqft
|
built
1911
1471 W Foster Ave, Chicago, IL 60640
$-1,270
Cash flow
-17.7%
Cash-on-Cash Return
2.2%
Cap rate
0.5%
Rent to Value Ratio
Active
$580,000
4
bds
|
4
ba
|
2,000
sqft
|
built
1926
5262 N Lind Ave, Chicago, IL 60630
$-1,035
Cash flow
-9.3%
Cash-on-Cash Return
4.1%
Cap rate
0.7%
Rent to Value Ratio
Active
$390,000
2
bds
|
2
ba
|
1,519
sqft
|
built
1971
6033 N Sheridan Rd, Chicago, IL 60660
$-1,295
Cash flow
-17.3%
Cash-on-Cash Return
2.3%
Cap rate
0.7%
Rent to Value Ratio
Active
$149,900
0
bds
|
1
ba
|
550
sqft
|
built
1952
2909 N Sheridan Rd, Chicago, IL 60657
$-230
Cash flow
-8.0%
Cash-on-Cash Return
4.4%
Cap rate
1.1%
Rent to Value Ratio
Active
$227,000
4
bds
|
3
ba
|
1,895
sqft
|
built
1916
53 W 123rd St, Chicago, IL 60628
$120
Cash flow
2.8%
Cash-on-Cash Return
6.9%
Cap rate
1.0%
Rent to Value Ratio
Active
$499,000
4
bds
|
3
ba
|
0
sqft
|
built
1930
5310 W Parker Ave, Chicago, IL 60639
$-1,710
Cash flow
-17.9%
Cash-on-Cash Return
2.2%
Cap rate
0.4%
Rent to Value Ratio
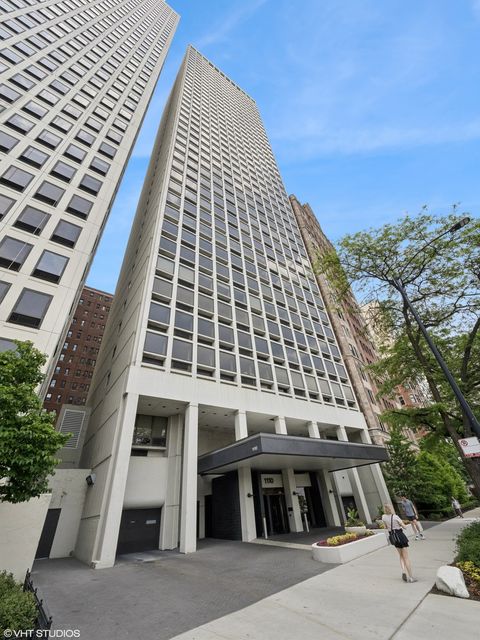
Active
$619,000
3
bds
|
3
ba
|
2,300
sqft
|
built
1969
1110 N Lake Shore Dr, Chicago, IL 60611
$-3,944
Cash flow
-33.2%
Cash-on-Cash Return
-1.4%
Cap rate
0.7%
Rent to Value Ratio