Cook County Investment Properties for Sale
Browse homes for sale and investment properties in Cook County. Refine your search by price, property type, or more.
Best cash flowing properties in Cook County
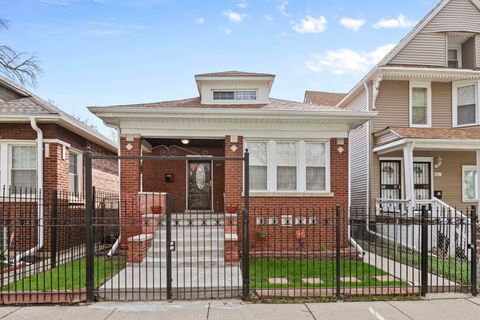
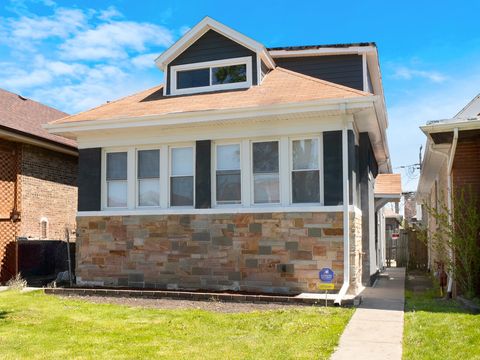
Active
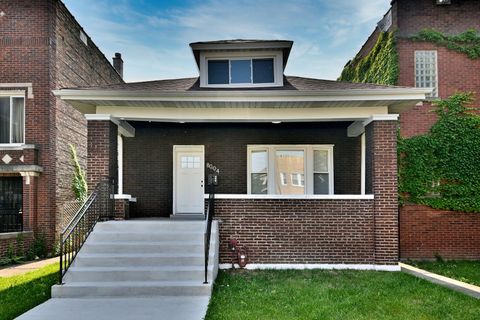
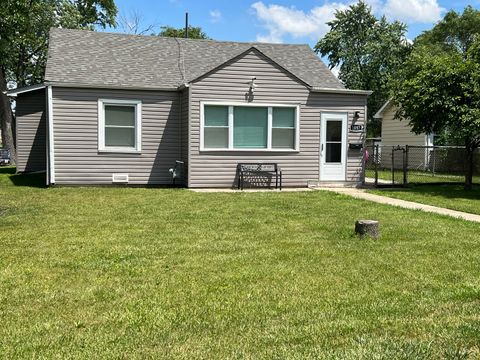
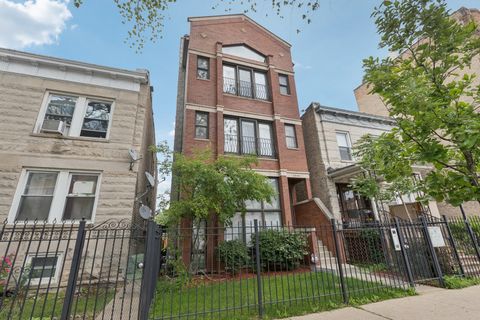
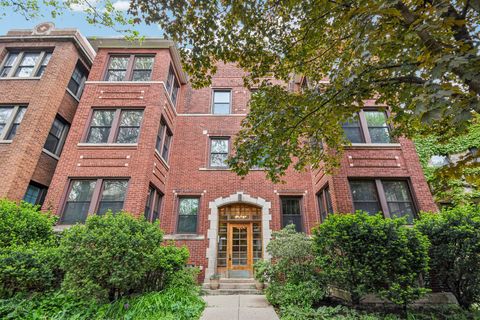
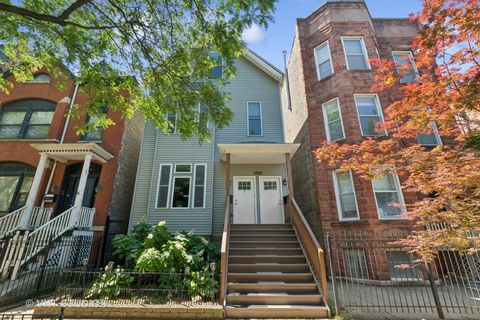
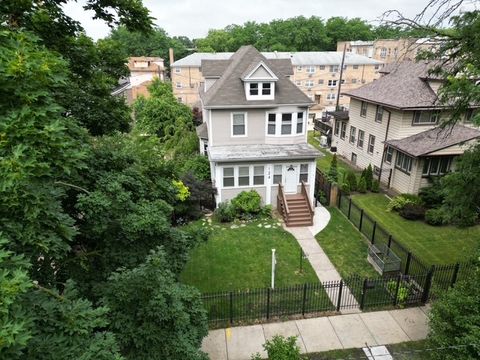
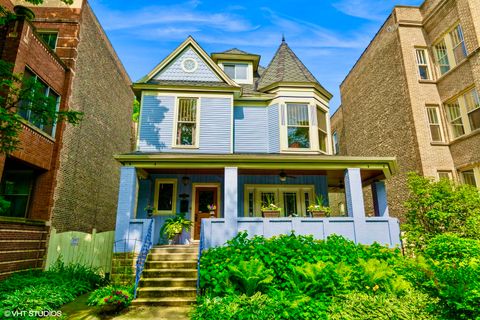
$278,900
3
bds
|
2
ba
|
2,300
sqft
|
built
1916
8004 S Ada St, Chicago, IL 60620
$538
Cash flow
10.1%
Cash-on-Cash Return
8.0%
Cap rate
1.0%
Rent to Value Ratio
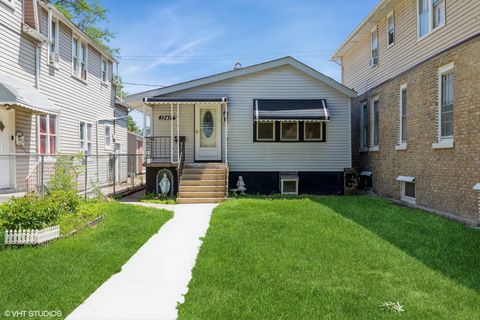
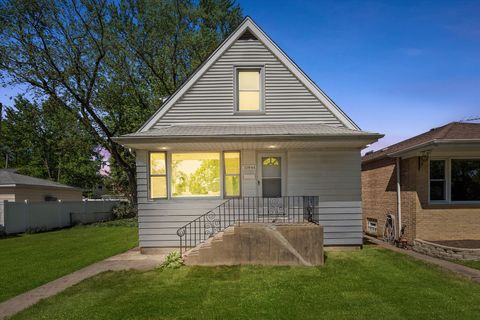
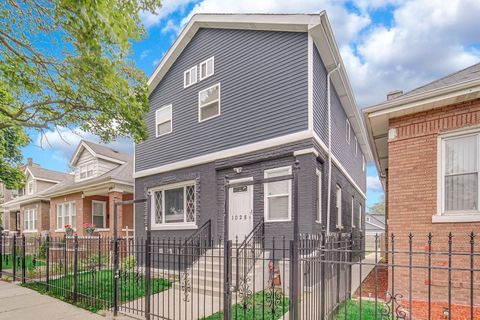
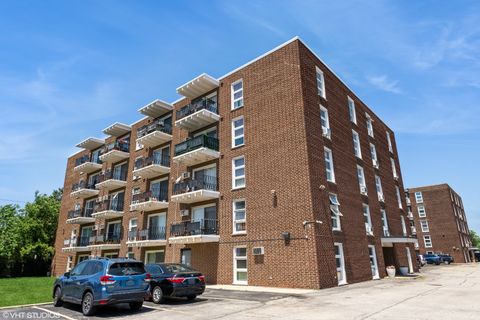
Active
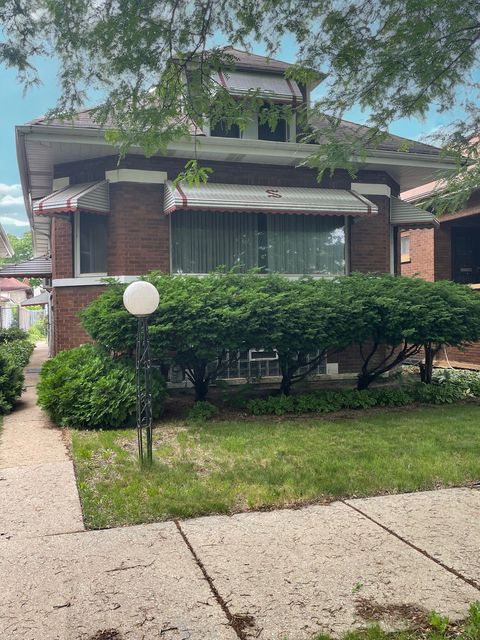
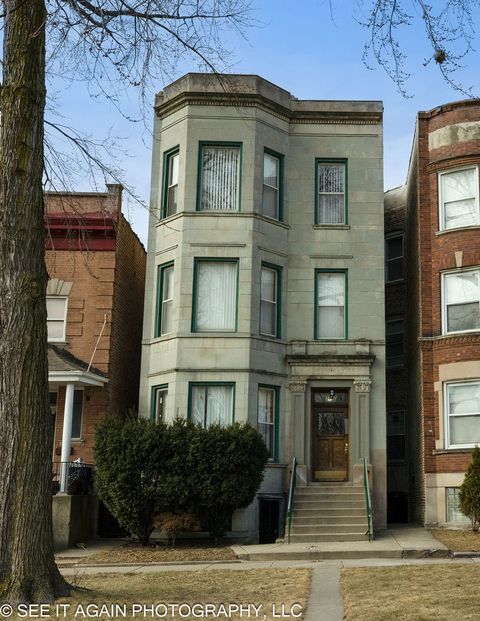
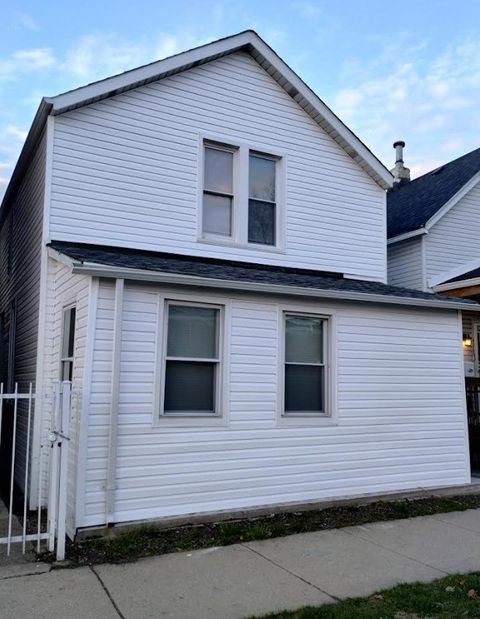
$149,990
4
bds
|
3
ba
|
1,342
sqft
|
built
1926
9412 S Elizabeth St, Chicago, IL 60620
$504
Cash flow
17.5%
Cash-on-Cash Return
10.3%
Cap rate
1.5%
Rent to Value Ratio
6,241 out of 8,483 properties for sale in Cook County
Limited Results Shown
Create a free account, or log in to reveal all property listings and enjoy the complete experience.
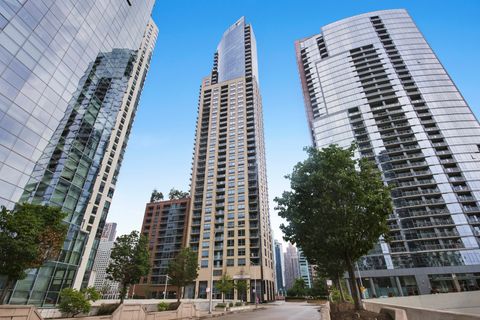
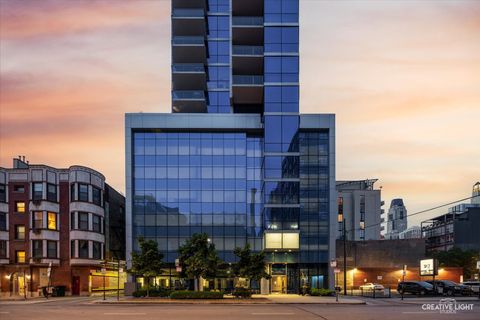
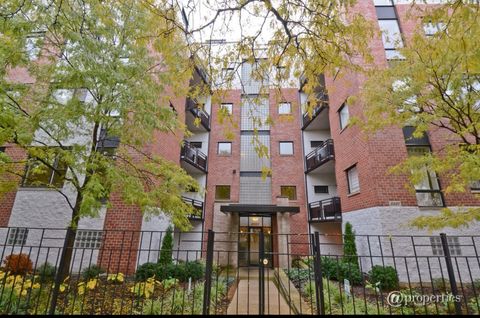
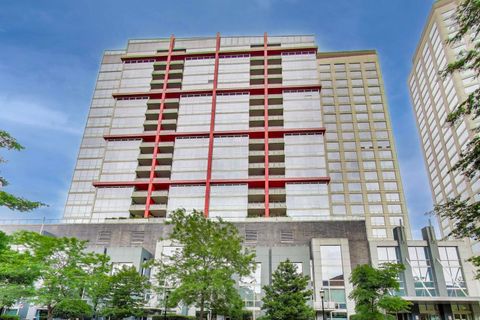
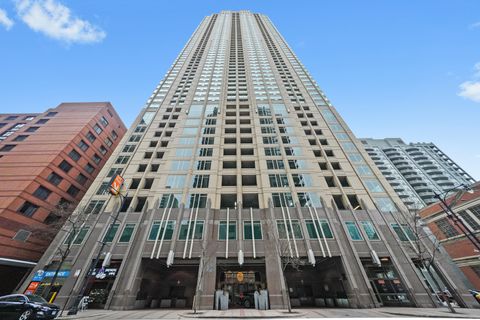
Active
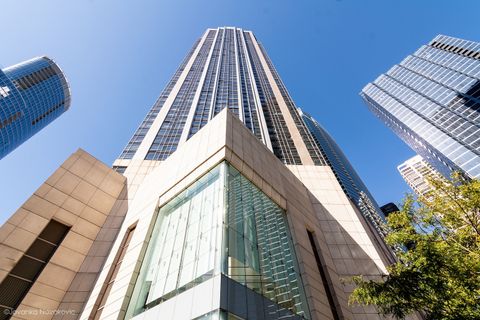
$227,000
bds
|
1
ba
|
673
sqft
|
built
2001
512 N Mc Clurg Ct, Chicago, IL 60611
$-546
Cash flow
-12.5%
Cash-on-Cash Return
3.4%
Cap rate
0.8%
Rent to Value Ratio
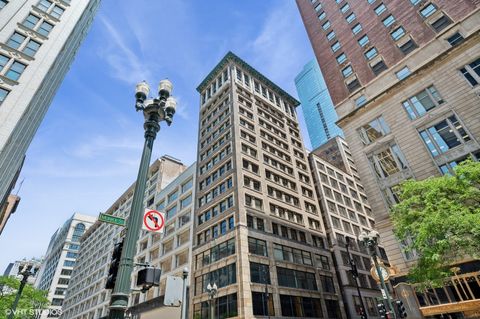
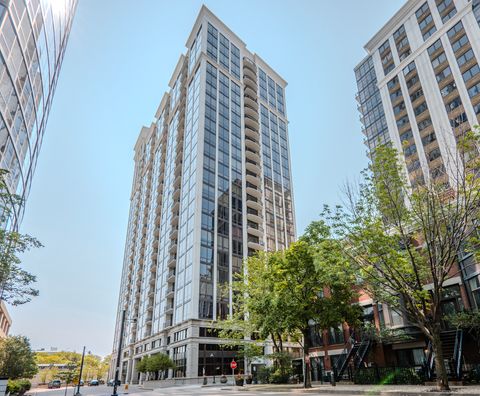
Active
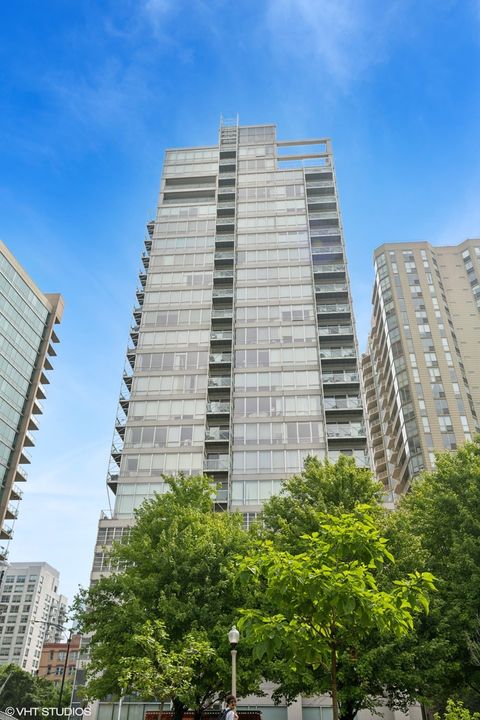
$375,000
1
bds
|
2
ba
|
0
sqft
|
built
2003
653 N Kingsbury St, Chicago, IL 60654
$-1,383
Cash flow
-19.2%
Cash-on-Cash Return
1.8%
Cap rate
0.8%
Rent to Value Ratio
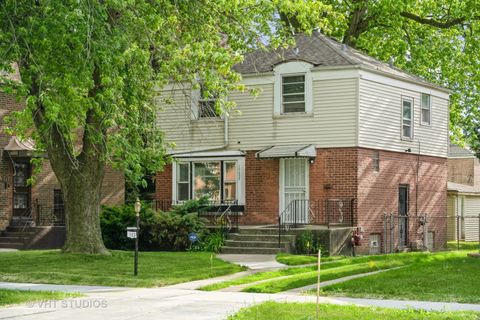
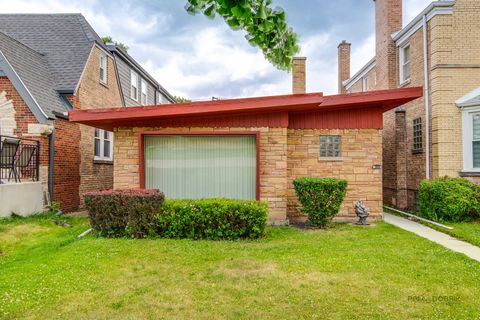
Active
$315,000
3
bds
|
1
ba
|
768
sqft
|
built
1947
2057 Emerson Ave, Melrose Park, IL 60164
$-636
Cash flow
-10.5%
Cash-on-Cash Return
3.8%
Cap rate
0.7%
Rent to Value Ratio
Active
$210,000
3
bds
|
3
ba
|
756
sqft
|
built
1888
13417 S Avenue M, Chicago, IL 60633
$-28
Cash flow
-0.7%
Cash-on-Cash Return
6.1%
Cap rate
0.8%
Rent to Value Ratio
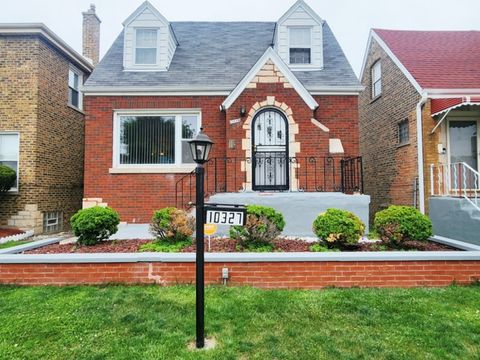
Active
$229,900
4
bds
|
1
ba
|
1,108
sqft
|
built
1940
10327 S Calumet Ave, Chicago, IL 60628
$183
Cash flow
4.2%
Cash-on-Cash Return
7.2%
Cap rate
1.0%
Rent to Value Ratio
Active
$1,850,000
4
bds
|
4
ba
|
4,800
sqft
|
built
2007
2122 W Melrose St, Chicago, IL 60618
$-5,774
Cash flow
-16.3%
Cash-on-Cash Return
1.9%
Cap rate
0.4%
Rent to Value Ratio
Active
$349,900
1
bds
|
1
ba
|
826
sqft
|
built
2006
420 E Waterside Dr, Chicago, IL 60601
$-698
Cash flow
-10.4%
Cash-on-Cash Return
3.3%
Cap rate
0.9%
Rent to Value Ratio
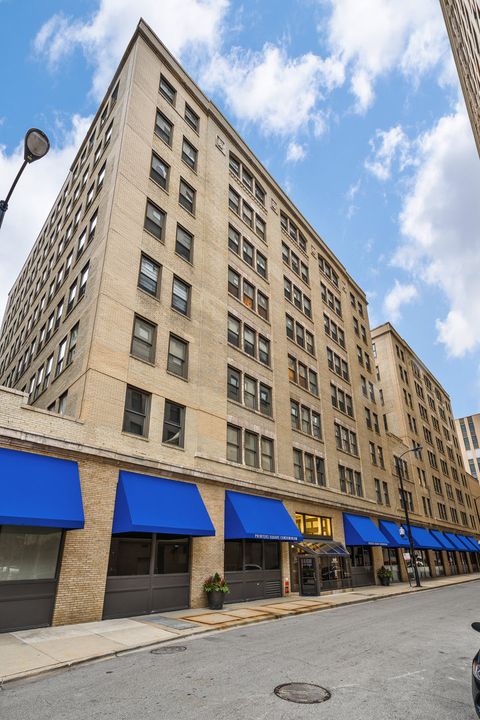
Active
$209,000
1
bds
|
1
ba
|
0
sqft
|
built
1910
640 S Federal St, Chicago, IL 60605
$-524
Cash flow
-13.1%
Cash-on-Cash Return
2.7%
Cap rate
1.1%
Rent to Value Ratio
Active
$270,000
2
bds
|
2
ba
|
1,700
sqft
|
built
1921
8805 S Carpenter St, Chicago, IL 60620
$87
Cash flow
1.7%
Cash-on-Cash Return
6.1%
Cap rate
0.8%
Rent to Value Ratio
Active
$228,000
3
bds
|
2
ba
|
1,280
sqft
|
built
1978
1451 E 55th Pl, Chicago, IL 60637
$-926
Cash flow
-21.2%
Cash-on-Cash Return
0.8%
Cap rate
1.0%
Rent to Value Ratio
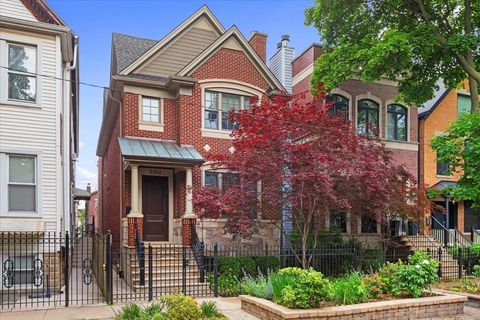
Active
$584,000
3
bds
|
3
ba
|
2,300
sqft
|
built
2003
3041 N California Ave, Chicago, IL 60618
$-1,338
Cash flow
-12.0%
Cash-on-Cash Return
2.9%
Cap rate
0.6%
Rent to Value Ratio
Active
$169,000
1
bds
|
1
ba
|
900
sqft
|
built
1977
1475 Rebecca Dr, Hoffman Estates, IL 60169
$2
Cash flow
0.1%
Cash-on-Cash Return
5.7%
Cap rate
1.1%
Rent to Value Ratio
Active
$410,000
2
bds
|
2
ba
|
1,440
sqft
|
built
2005
453 N May St, Chicago, IL 60642
$-781
Cash flow
-9.9%
Cash-on-Cash Return
3.4%
Cap rate
0.8%
Rent to Value Ratio
Active
$599,900
12
bds
|
4
ba
|
0
sqft
|
built
1898
5942 S Calumet Ave, Chicago, IL 60637
$-1,794
Cash flow
-15.6%
Cash-on-Cash Return
2.1%
Cap rate
0.3%
Rent to Value Ratio
Active
$425,000
3
bds
|
1
ba
|
1,500
sqft
|
built
1925
6329 N Wayne Ave, Chicago, IL 60660
$-853
Cash flow
-10.5%
Cash-on-Cash Return
3.3%
Cap rate
0.7%
Rent to Value Ratio
Active
$389,999
4
bds
|
3
ba
|
2,600
sqft
|
built
1950
10846 S Sacramento Ave, Chicago, IL 60655
$-880
Cash flow
-11.8%
Cash-on-Cash Return
3.0%
Cap rate
0.6%
Rent to Value Ratio
Active
$670,000
2
bds
|
2
ba
|
1,350
sqft
|
built
2009
110 W Superior St, Chicago, IL 60654
$-2,127
Cash flow
-16.6%
Cash-on-Cash Return
2.5%
Cap rate
0.7%
Rent to Value Ratio
Active
$150,000
3
bds
|
1
ba
|
1,176
sqft
|
built
1946
10038 S Luella Ave, Chicago, IL 60617
$353
Cash flow
12.3%
Cash-on-Cash Return
9.1%
Cap rate
1.2%
Rent to Value Ratio
Active
$1,600,000
8
bds
|
6
ba
|
0
sqft
|
built
1895
1037 W Oakdale Ave, Chicago, IL 60657
$-6,694
Cash flow
-21.8%
Cash-on-Cash Return
1.2%
Cap rate
0.3%
Rent to Value Ratio
Active
$299,000
1
bds
|
1
ba
|
0
sqft
|
built
1999
2307 W Wolfram St, Chicago, IL 60618
$-439
Cash flow
-7.7%
Cash-on-Cash Return
4.5%
Cap rate
0.8%
Rent to Value Ratio
Active
$189,500
4
bds
|
1
ba
|
1,100
sqft
|
built
1898
4936 W Harrison St, Chicago, IL 60644
$187
Cash flow
5.1%
Cash-on-Cash Return
7.4%
Cap rate
1.0%
Rent to Value Ratio
Active
$549,999
4
bds
|
2
ba
|
2,070
sqft
|
built
1957
6122 N Central Park Ave, Chicago, IL 60659
$-883
Cash flow
-8.4%
Cash-on-Cash Return
4.3%
Cap rate
0.7%
Rent to Value Ratio
Active
$350,000
3
bds
|
3
ba
|
2,731
sqft
|
built
1895
124 N Mayfield Ave, Chicago, IL 60644
$-297
Cash flow
-4.4%
Cash-on-Cash Return
5.2%
Cap rate
0.7%
Rent to Value Ratio
Active
$849,999
8
bds
|
4
ba
|
0
sqft
|
built
1898
862 N Hermitage Ave, Chicago, IL 60622
$-3,331
Cash flow
-20.4%
Cash-on-Cash Return
1.6%
Cap rate
0.4%
Rent to Value Ratio
Active
$419,999
3
bds
|
4
ba
|
2,400
sqft
|
built
1925
1028 N Lavergne Ave, Chicago, IL 60651
$-278
Cash flow
-3.5%
Cash-on-Cash Return
5.5%
Cap rate
0.8%
Rent to Value Ratio
Active
$149,990
4
bds
|
3
ba
|
1,342
sqft
|
built
1926
9412 S Elizabeth St, Chicago, IL 60620
$504
Cash flow
17.5%
Cash-on-Cash Return
10.3%
Cap rate
1.5%
Rent to Value Ratio
Active
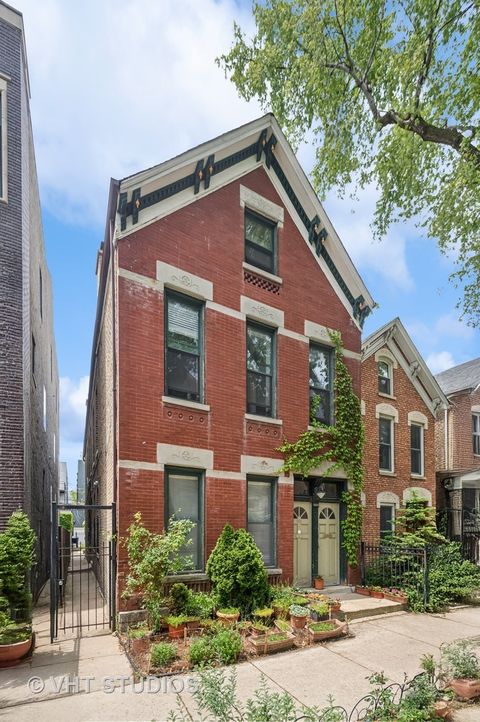
$1,695,000
5
bds
|
4
ba
|
0
sqft
|
built
1905
3715 N Wayne Ave, Chicago, IL 60613
$-6,196
Cash flow
-19.1%
Cash-on-Cash Return
1.9%
Cap rate
0.4%
Rent to Value Ratio
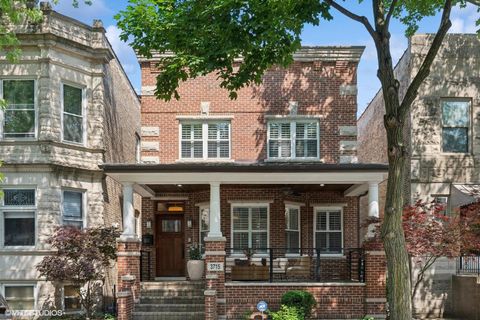
Active
$1,495,000
6
bds
|
5
ba
|
2,700
sqft
|
built
1904
6316 N Magnolia Ave, Chicago, IL 60660
$-4,917
Cash flow
-17.2%
Cash-on-Cash Return
2.3%
Cap rate
0.4%
Rent to Value Ratio
Active
$380,000
2
bds
|
2
ba
|
1,100
sqft
|
built
2006
1841 S Calumet Ave, Chicago, IL 60616
$-1,423
Cash flow
-19.5%
Cash-on-Cash Return
1.8%
Cap rate
0.7%
Rent to Value Ratio
Active
$795,000
2
bds
|
2
ba
|
3,000
sqft
|
built
1906
6 E Monroe St, Chicago, IL 60603
$-5,145
Cash flow
-33.8%
Cash-on-Cash Return
-1.5%
Cap rate
0.5%
Rent to Value Ratio
Active
$275,000
2
bds
|
2
ba
|
1,300
sqft
|
built
1970
7227 W Higgins Ave, Chicago, IL 60656
$-565
Cash flow
-10.7%
Cash-on-Cash Return
3.8%
Cap rate
0.8%
Rent to Value Ratio
Active
$425,000
2
bds
|
2
ba
|
1,350
sqft
|
built
2003
33 W Ontario St, Chicago, IL 60654
$-2,488
Cash flow
-30.5%
Cash-on-Cash Return
-1.3%
Cap rate
0.7%
Rent to Value Ratio
Active
$565,000
2
bds
|
2
ba
|
1,290
sqft
|
built
2005
233 E 13th St, Chicago, IL 60605
$-2,328
Cash flow
-21.5%
Cash-on-Cash Return
0.7%
Cap rate
0.5%
Rent to Value Ratio
Active
$359,900
4
bds
|
3
ba
|
0
sqft
|
built
1923
7755 S Wolcott Ave, Chicago, IL 60620
$-658
Cash flow
-9.5%
Cash-on-Cash Return
3.5%
Cap rate
0.5%
Rent to Value Ratio
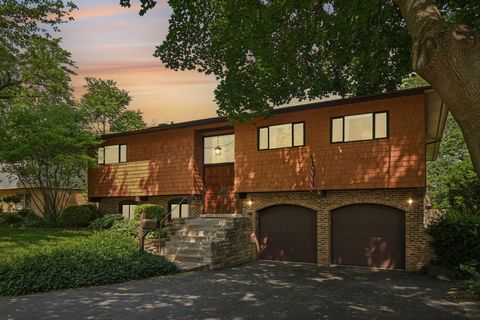
Active
$725,000
4
bds
|
4
ba
|
2,600
sqft
|
built
1965
129 Kainer Ave, Barrington, IL 60010
$-1,344
Cash flow
-9.7%
Cash-on-Cash Return
3.5%
Cap rate
0.6%
Rent to Value Ratio
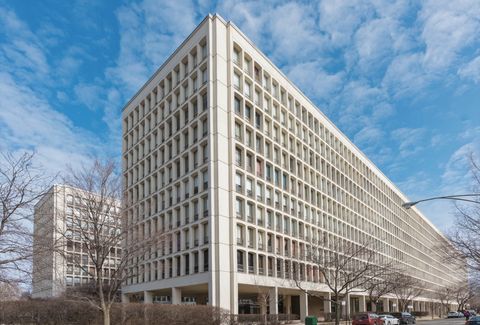
Active
$260,000
2
bds
|
1
ba
|
950
sqft
|
built
1956
3950 N Lake Shore Dr, Chicago, IL 60613
$-620
Cash flow
-12.4%
Cash-on-Cash Return
2.8%
Cap rate
1.0%
Rent to Value Ratio
Active
$278,900
3
bds
|
2
ba
|
2,300
sqft
|
built
1916
8004 S Ada St, Chicago, IL 60620
$538
Cash flow
10.1%
Cash-on-Cash Return
8.0%
Cap rate
1.0%
Rent to Value Ratio
Active
$358,900
3
bds
|
1
ba
|
1,350
sqft
|
built
1951
7937 Lotus Ave, Burbank, IL 60459
$-487
Cash flow
-7.1%
Cash-on-Cash Return
4.0%
Cap rate
0.6%
Rent to Value Ratio
Active
$250,000
1
bds
|
1
ba
|
800
sqft
|
built
1960
2930 N Sheridan Rd, Chicago, IL 60657
$-690
Cash flow
-14.4%
Cash-on-Cash Return
2.4%
Cap rate
0.9%
Rent to Value Ratio
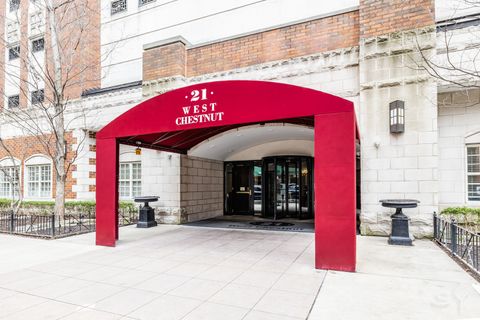
Active
$299,900
1
bds
|
1
ba
|
0
sqft
|
built
1999
21 W Chestnut St, Chicago, IL 60610
$-553
Cash flow
-9.6%
Cash-on-Cash Return
3.5%
Cap rate
0.8%
Rent to Value Ratio