Cook County Investment Properties for Sale
Browse homes for sale and investment properties in Cook County. Refine your search by price, property type, or more.
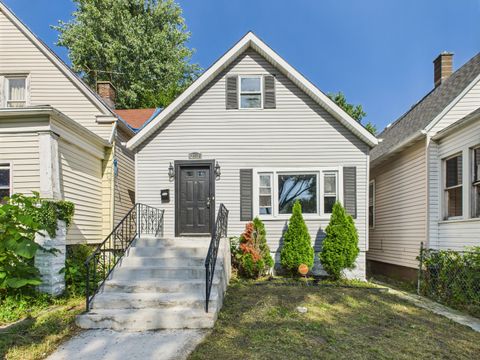
Best cash flowing properties in Cook County
Active
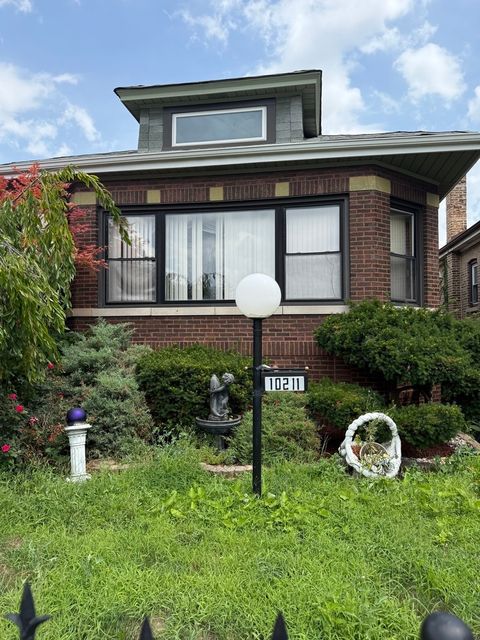
$115,000
2
bds
|
2
ba
|
1,150
sqft
|
built
1925
10211 S Peoria St, Chicago, IL 60643
$1,025
Cash flow
46.5%
Cash-on-Cash Return
16.4%
Cap rate
2.0%
Rent to Value Ratio
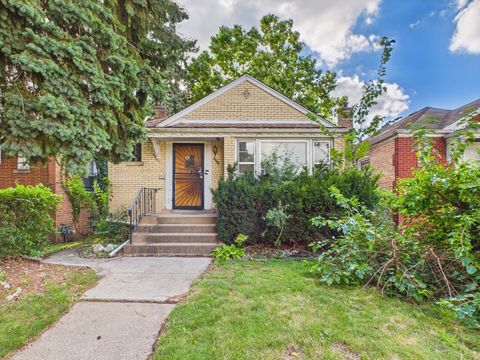
Active
$64,500
2
bds
|
1
ba
|
890
sqft
|
built
1952
14510 S Emerald Ave, Riverdale, IL 60827
$961
Cash flow
17.4%
Cash-on-Cash Return
17.9%
Cap rate
2.8%
Rent to Value Ratio
4,904 out of 5,692 properties for sale in Cook County
Limited Results Shown
Create a free account, or log in to reveal all property listings and enjoy the complete experience.
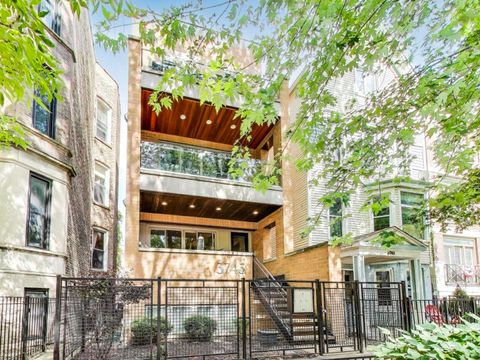
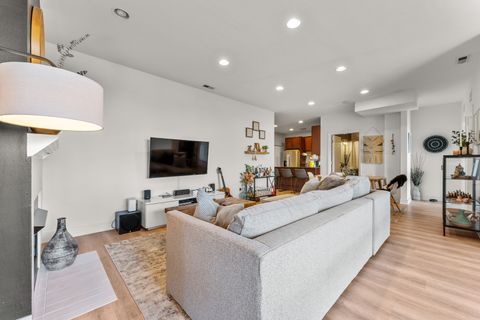
Active
$1,100,000
4
bds
|
3
ba
|
2,416
sqft
|
built
2014
3743 N Kenmore Ave, Chicago, IL 60613
$-2,728
Cash flow
-12.9%
Cash-on-Cash Return
2.7%
Cap rate
0.5%
Rent to Value Ratio
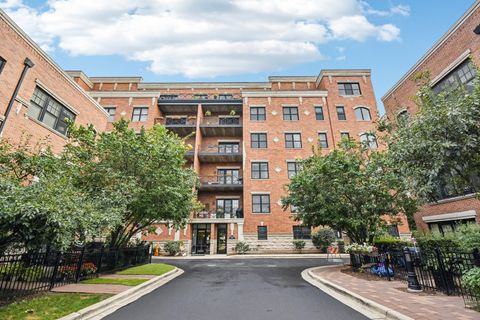
Active
$499,000
2
bds
|
2
ba
|
1,596
sqft
|
built
2010
2811 N Bell Ave, Chicago, IL 60618
$-1,196
Cash flow
-12.5%
Cash-on-Cash Return
2.8%
Cap rate
0.7%
Rent to Value Ratio
Active
$899,000
3
bds
|
3
ba
|
0
sqft
|
built
2003
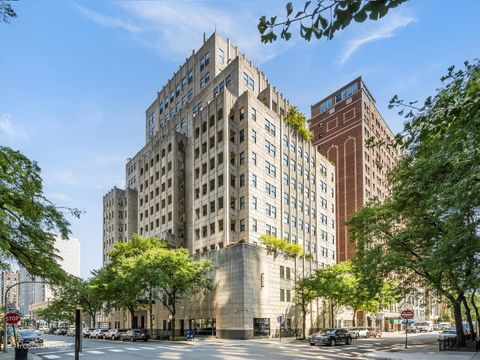
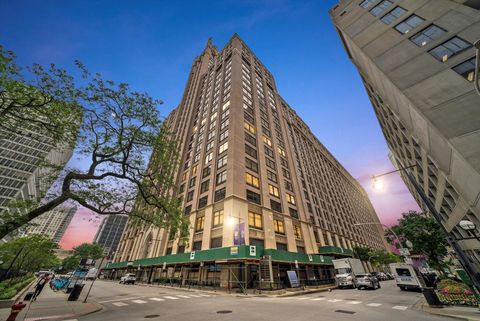
1155 N Dearborn St, Chicago, IL 60610
$-3,771
Cash flow
-21.9%
Cash-on-Cash Return
0.6%
Cap rate
0.7%
Rent to Value Ratio
Active
$350,000
2
bds
|
1
ba
|
0
sqft
|
built
1906
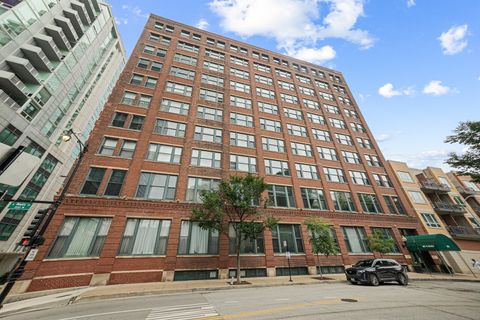
801 S Wells St, Chicago, IL 60607
$-631
Cash flow
-9.4%
Cash-on-Cash Return
3.5%
Cap rate
0.8%
Rent to Value Ratio
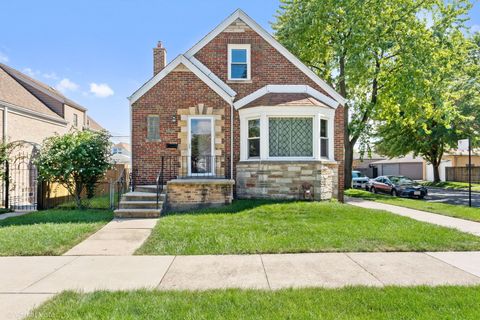
Active
$125,000
4
bds
|
2
ba
|
1,749
sqft
|
built
1947
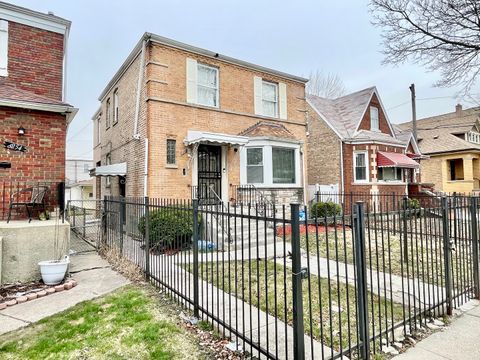
8252 S Marshfield Ave, Chicago, IL 60620
$647
Cash flow
27.0%
Cash-on-Cash Return
11.9%
Cap rate
1.6%
Rent to Value Ratio
Active
$225,000
5
bds
|
2
ba
|
0
sqft
|
built
1908
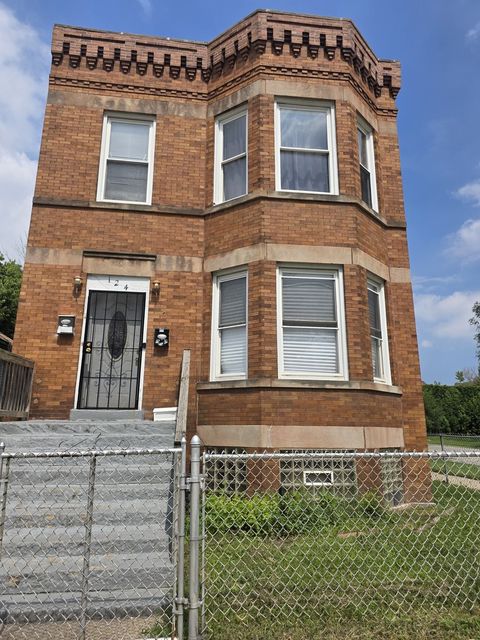
124 E 110th St, Chicago, IL 60628
$80
Cash flow
1.9%
Cash-on-Cash Return
6.1%
Cap rate
0.8%
Rent to Value Ratio
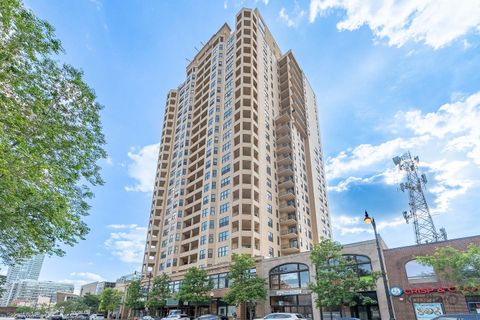
Active
$799,000
2
bds
|
3
ba
|
2,100
sqft
|
built
1925
680 N Lake Shore Dr, Chicago, IL 60611
$-3,196
Cash flow
-20.9%
Cash-on-Cash Return
0.9%
Cap rate
0.6%
Rent to Value Ratio
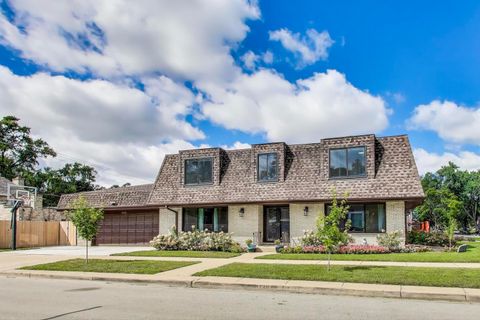
Active
$749,000
5
bds
|
4
ba
|
3,500
sqft
|
built
1980
2100 N 77th Ct, Elmwood Park, IL 60707
$-1,635
Cash flow
-11.4%
Cash-on-Cash Return
3.1%
Cap rate
0.6%
Rent to Value Ratio
Active
$367,000
3
bds
|
3
ba
|
2,400
sqft
|
built
1951
3757 W 65th St, Chicago, IL 60629
$-496
Cash flow
-7.1%
Cash-on-Cash Return
4.1%
Cap rate
0.6%
Rent to Value Ratio
Active
$420,000
3
bds
|
2
ba
|
1,500
sqft
|
built
2007
5300 N Lincoln Ave, Chicago, IL 60625
$-783
Cash flow
-9.7%
Cash-on-Cash Return
3.4%
Cap rate
0.7%
Rent to Value Ratio
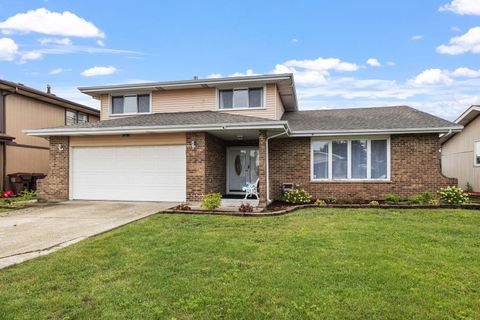
Active
$162,000
2
bds
|
2
ba
|
1,598
sqft
|
built
1951
329 Indianwood Blvd, Park Forest, IL 60466
$787
Cash flow
25.3%
Cash-on-Cash Return
11.5%
Cap rate
1.4%
Rent to Value Ratio
Active
$179,900
2
bds
|
2
ba
|
1,100
sqft
|
built
1991
10512 Ridge Cove Dr, Chicago Ridge, IL 60415
$153
Cash flow
4.4%
Cash-on-Cash Return
6.7%
Cap rate
1.0%
Rent to Value Ratio
Active
$250,000
3
bds
|
2
ba
|
858
sqft
|
built
1942
3125 W 114th St, Merrionette Park, IL 60803
$-45
Cash flow
-0.9%
Cash-on-Cash Return
5.5%
Cap rate
0.8%
Rent to Value Ratio
Active
$255,000
2
bds
|
2
ba
|
0
sqft
|
built
1992
805 Leicester Rd, Elk Grove Village, IL 60007
$-581
Cash flow
-11.9%
Cash-on-Cash Return
2.9%
Cap rate
0.8%
Rent to Value Ratio
Active
$299,900
3
bds
|
1
ba
|
1,200
sqft
|
built
1920
1426 Harvey Ave, Berwyn, IL 60402
$-269
Cash flow
-4.7%
Cash-on-Cash Return
4.6%
Cap rate
0.8%
Rent to Value Ratio
Active
$399,800
2
bds
|
4
ba
|
1,782
sqft
|
built
1997
1535 W Ethans Glen Dr, Palatine, IL 60067
$-785
Cash flow
-10.2%
Cash-on-Cash Return
3.3%
Cap rate
0.7%
Rent to Value Ratio
Active
$425,000
3
bds
|
2
ba
|
1,248
sqft
|
built
1959
2751 Pauline Ave, Glenview, IL 60025
$-355
Cash flow
-4.4%
Cash-on-Cash Return
4.7%
Cap rate
0.8%
Rent to Value Ratio
Active
$287,000
2
bds
|
2
ba
|
1,450
sqft
|
built
1982
7711 W Oak Ridge Ct, Palos Heights, IL 60463
$-498
Cash flow
-9.1%
Cash-on-Cash Return
3.6%
Cap rate
0.9%
Rent to Value Ratio
Active
$249,900
1
bds
|
1
ba
|
725
sqft
|
built
2008
1464 S Michigan Ave, Chicago, IL 60605
$-657
Cash flow
-13.7%
Cash-on-Cash Return
2.5%
Cap rate
0.8%
Rent to Value Ratio
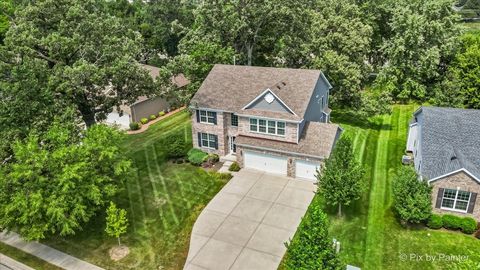
Active
$650,000
4
bds
|
3
ba
|
2,930
sqft
|
built
2018
5844 Bur Oak Dr, Hoffman Estates, IL 60192
$-1,130
Cash flow
-9.1%
Cash-on-Cash Return
3.6%
Cap rate
0.7%
Rent to Value Ratio

Active
$189,900
3
bds
|
1
ba
|
1,342
sqft
|
built
1941
6945 W 96th Pl, Oak Lawn, IL 60453
$486
Cash flow
13.4%
Cash-on-Cash Return
8.8%
Cap rate
1.3%
Rent to Value Ratio
Active
$364,900
3
bds
|
3
ba
|
2,371
sqft
|
built
1980
15725 La Paz Ct, Oak Forest, IL 60452
$-405
Cash flow
-5.8%
Cash-on-Cash Return
4.3%
Cap rate
0.9%
Rent to Value Ratio
Active
$109,900
3
bds
|
1
ba
|
704
sqft
|
built
1908
12337 S Wallace St, Chicago, IL 60628
$540
Cash flow
25.6%
Cash-on-Cash Return
11.6%
Cap rate
1.5%
Rent to Value Ratio
Active
$211,000
3
bds
|
2
ba
|
1,350
sqft
|
built
1971
4700 Salem Ct, Richton Park, IL 60471
$-190
Cash flow
-4.7%
Cash-on-Cash Return
4.6%
Cap rate
0.9%
Rent to Value Ratio
Active
$1,399,000
4
bds
|
5
ba
|
3,000
sqft
|
built
1883
453 W Roslyn Pl, Chicago, IL 60614
$-3,374
Cash flow
-12.6%
Cash-on-Cash Return
2.8%
Cap rate
0.5%
Rent to Value Ratio
Active
$450,000
3
bds
|
3
ba
|
1,540
sqft
|
built
1954
5321 N Moody Ave, Chicago, IL 60630
$-262
Cash flow
-3.0%
Cash-on-Cash Return
5.0%
Cap rate
0.8%
Rent to Value Ratio
Active
$199,000
1
bds
|
1
ba
|
0
sqft
|
built
1952
2909 N Sheridan Rd, Chicago, IL 60657
$-367
Cash flow
-9.6%
Cash-on-Cash Return
3.5%
Cap rate
1.1%
Rent to Value Ratio
Active
$399,000
2
bds
|
2
ba
|
1,502
sqft
|
built
2006
6745 N Clark St, Chicago, IL 60626
$-855
Cash flow
-11.2%
Cash-on-Cash Return
3.1%
Cap rate
0.7%
Rent to Value Ratio
Active
$525,000
3
bds
|
2
ba
|
1,700
sqft
|
built
1914
411 S Sangamon St, Chicago, IL 60607
$-1,440
Cash flow
-14.3%
Cash-on-Cash Return
2.4%
Cap rate
0.8%
Rent to Value Ratio
Active
$459,900
3
bds
|
3
ba
|
1,890
sqft
|
built
1929
1700 W 106th St, Chicago, IL 60643
$-319
Cash flow
-3.6%
Cash-on-Cash Return
4.8%
Cap rate
0.7%
Rent to Value Ratio
Active
$799,000
4
bds
|
4
ba
|
2,650
sqft
|
built
1921
5218 N Liano Ave, Chicago, IL 60630
$-2,263
Cash flow
-14.8%
Cash-on-Cash Return
2.3%
Cap rate
0.3%
Rent to Value Ratio
Active
$649,000
3
bds
|
3
ba
|
0
sqft
|
built
1998
1112 N Paulina St, Chicago, IL 60622
$-1,047
Cash flow
-8.4%
Cash-on-Cash Return
3.7%
Cap rate
0.7%
Rent to Value Ratio
Active
$445,000
2
bds
|
2
ba
|
0
sqft
|
built
1999
2840 N Damen Ave, Chicago, IL 60618
$-697
Cash flow
-8.2%
Cash-on-Cash Return
3.8%
Cap rate
0.7%
Rent to Value Ratio
Active
$299,500
3
bds
|
2
ba
|
1,055
sqft
|
built
1959
10055 Frontage Rd, Skokie, IL 60077
$-27
Cash flow
-0.5%
Cash-on-Cash Return
5.6%
Cap rate
0.8%
Rent to Value Ratio
Active
$365,000
2
bds
|
1
ba
|
801
sqft
|
built
1963
1455 N Sandburg Ter, Chicago, IL 60610
$-1,332
Cash flow
-19.0%
Cash-on-Cash Return
1.3%
Cap rate
0.7%
Rent to Value Ratio
Active
$350,000
3
bds
|
2
ba
|
1,575
sqft
|
built
1998
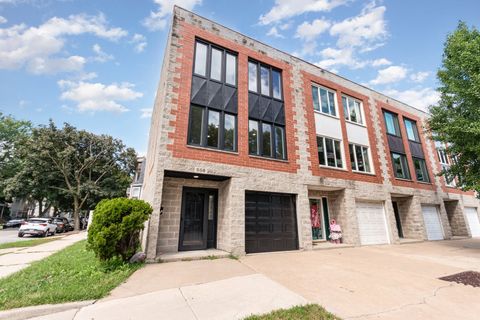
558 W 45th St, Chicago, IL 60609
$-467
Cash flow
-7.0%
Cash-on-Cash Return
4.1%
Cap rate
0.6%
Rent to Value Ratio
Active
$699,000
9
bds
|
2
ba
|
0
sqft
|
built
1927
35 N Mayfield Ave, Chicago, IL 60644
$-2,780
Cash flow
-20.8%
Cash-on-Cash Return
0.9%
Cap rate
0.2%
Rent to Value Ratio
Active
$165,000
bds
|
1
ba
|
500
sqft
|
built
1962
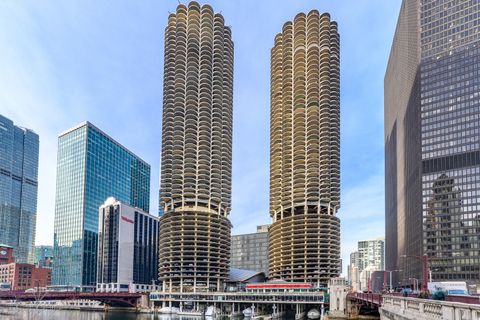
300 N State St, Chicago, IL 60654
$365
Cash flow
11.5%
Cash-on-Cash Return
8.3%
Cap rate
1.6%
Rent to Value Ratio