Cook County Investment Properties for Sale
Browse homes for sale and investment properties in Cook County. Refine your search by price, property type, or more.
Best cash flowing properties in Cook County
Active
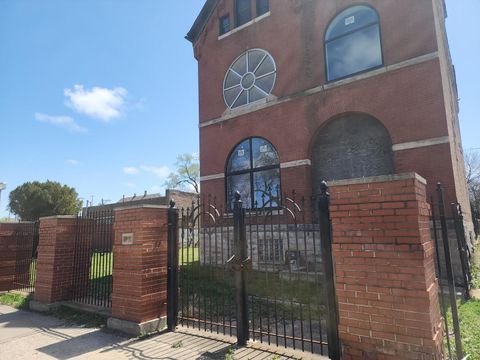
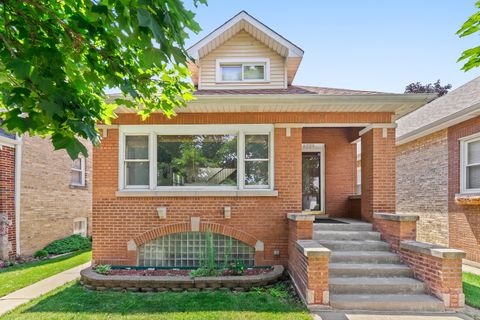
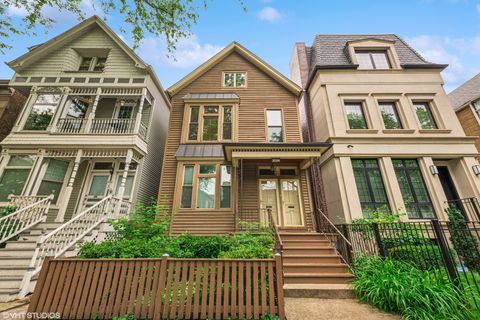
$199,900
6
bds
|
3
ba
|
2,972
sqft
|
built
1875
311 W Garfield Blvd, Chicago, IL 60621
$1,212
Cash flow
31.6%
Cash-on-Cash Return
13.5%
Cap rate
1.8%
Rent to Value Ratio
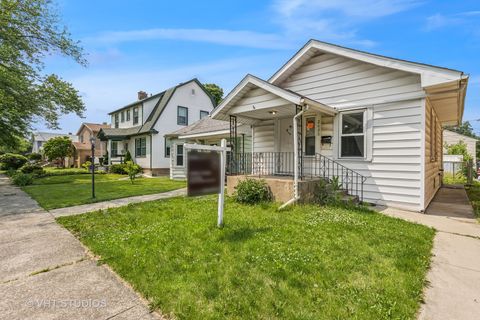
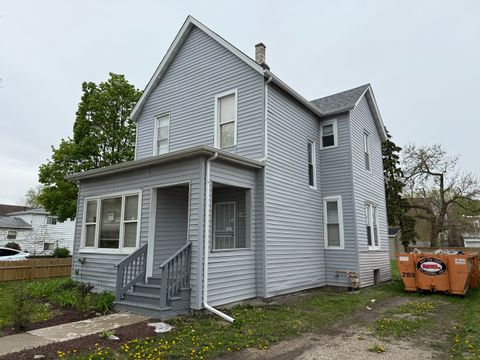
Active
$70,000
2
bds
|
1
ba
|
504
sqft
|
built
1924
2620 Orchard St, Blue Island, IL 60406
$713
Cash flow
11.9%
Cash-on-Cash Return
12.2%
Cap rate
1.9%
Rent to Value Ratio
6,241 out of 8,483 properties for sale in Cook County
Limited Results Shown
Create a free account, or log in to reveal all property listings and enjoy the complete experience.
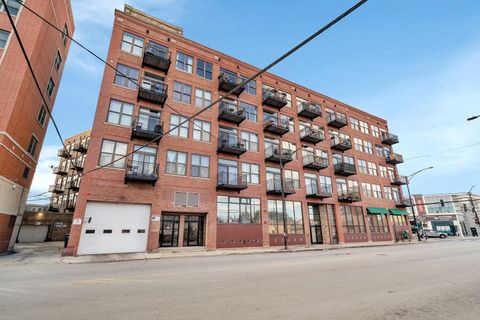
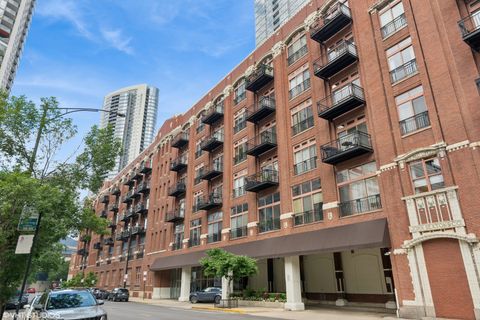
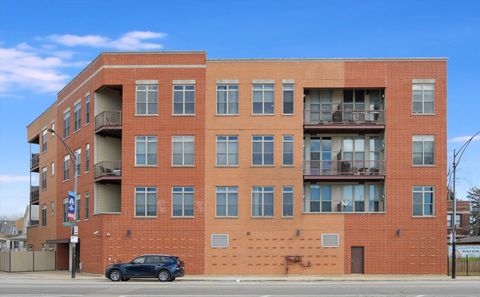
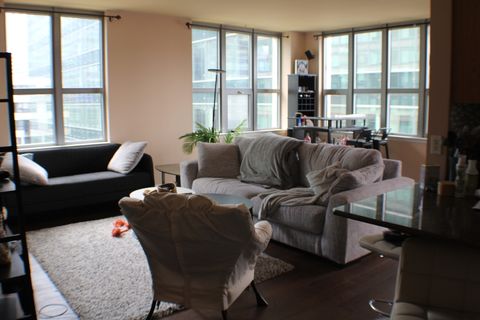
Active
$264,500
1
bds
|
1
ba
|
0
sqft
|
built
1920
2310 S Canal St, Chicago, IL 60616
$-674
Cash flow
-13.3%
Cash-on-Cash Return
3.2%
Cap rate
0.8%
Rent to Value Ratio
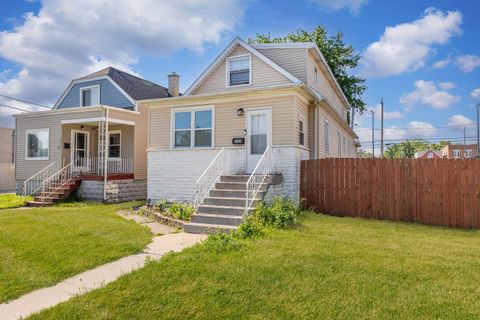
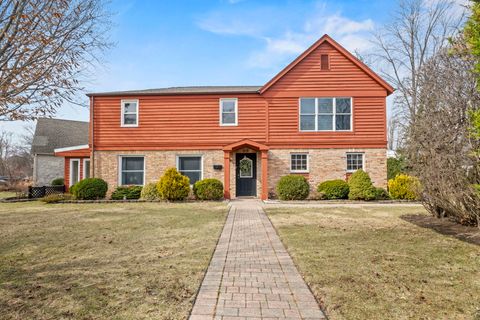
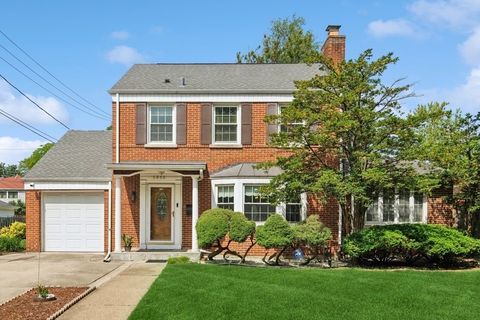
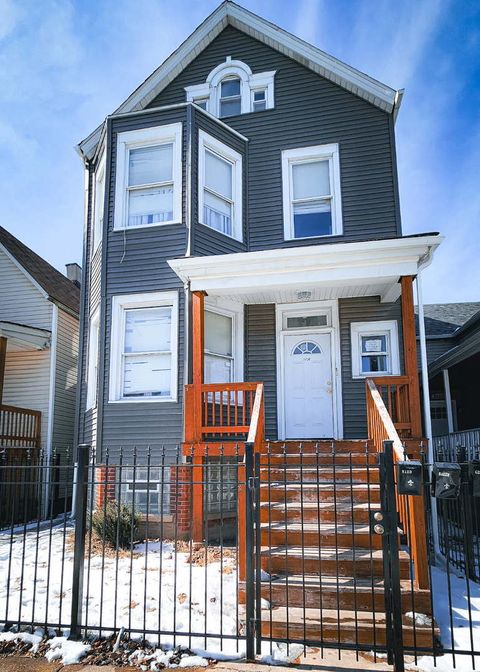
Active
$164,900
3
bds
|
2
ba
|
1,781
sqft
|
built
1919
213 153rd Pl, Calumet City, IL 60409
$83
Cash flow
2.6%
Cash-on-Cash Return
6.9%
Cap rate
1.3%
Rent to Value Ratio
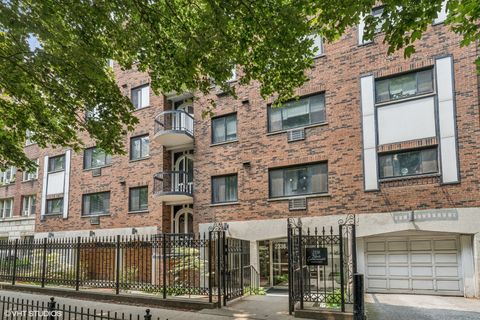
Active
$229,700
3
bds
|
2
ba
|
1,500
sqft
|
built
1960
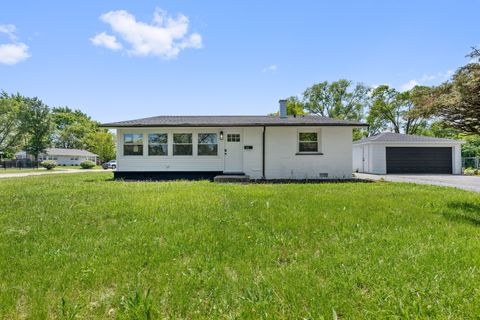
2711 Lancaster Dr, Markham, IL 60428
$-562
Cash flow
-12.8%
Cash-on-Cash Return
3.3%
Cap rate
0.8%
Rent to Value Ratio
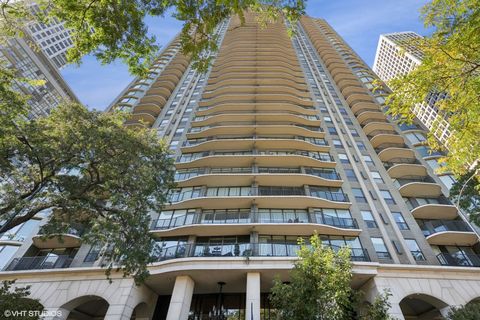
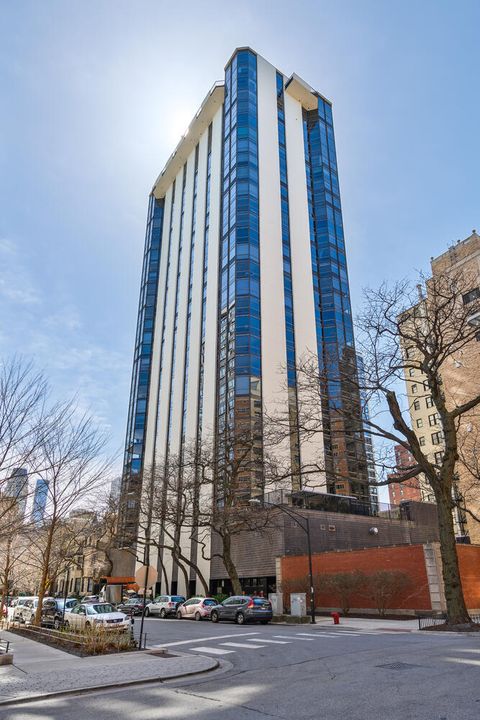
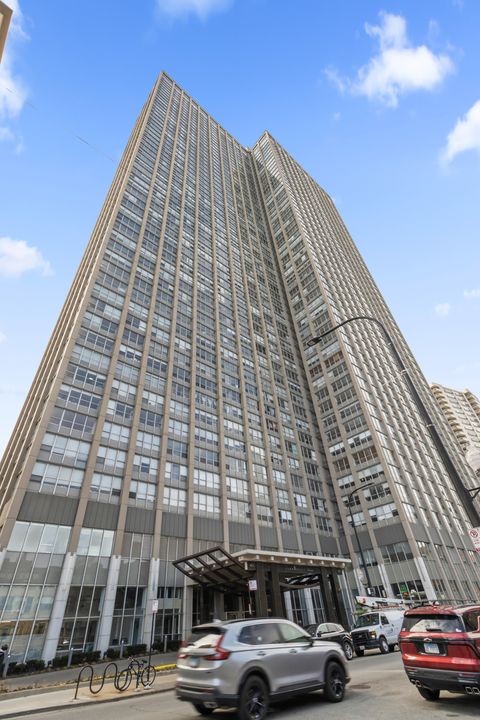
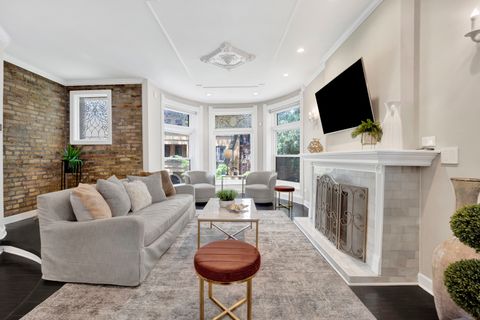
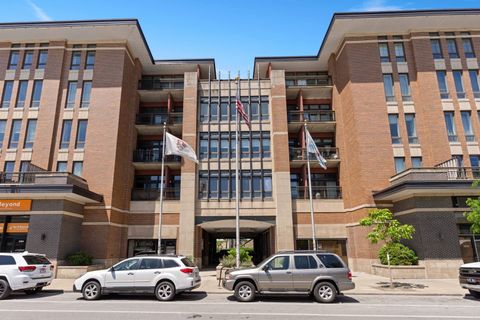
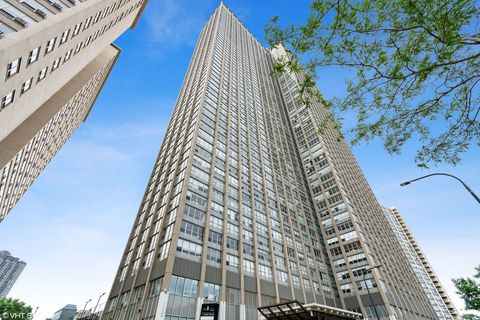
Active
$1,000,000
2
bds
|
2
ba
|
0
sqft
|
built
1964
1040 N Lake Shore Dr, Chicago, IL 60611
$-4,672
Cash flow
-24.4%
Cash-on-Cash Return
0.7%
Cap rate
0.6%
Rent to Value Ratio
Active
$749,900
3
bds
|
4
ba
|
0
sqft
|
built
1921
3739 W Addison St, Chicago, IL 60618
$-1,261
Cash flow
-8.8%
Cash-on-Cash Return
4.2%
Cap rate
0.7%
Rent to Value Ratio
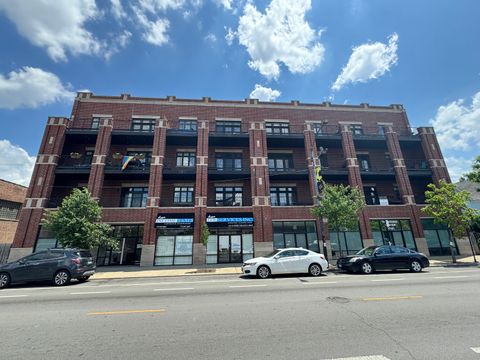
Active
$259,000
7
bds
|
2
ba
|
0
sqft
|
built
1906
6132 S Justine St, Chicago, IL 60636
$390
Cash flow
7.9%
Cash-on-Cash Return
8.1%
Cap rate
1.0%
Rent to Value Ratio
Active
$375,000
1
bds
|
1
ba
|
1,100
sqft
|
built
1910
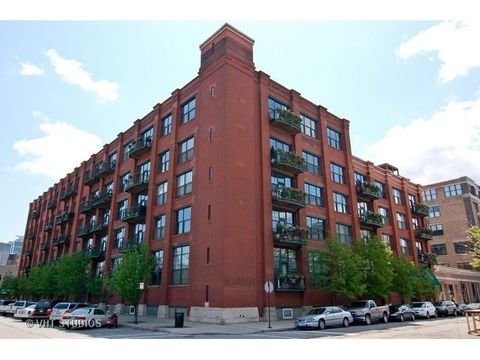
1000 W Washington Blvd, Chicago, IL 60607
$-1,344
Cash flow
-18.7%
Cash-on-Cash Return
2.0%
Cap rate
0.9%
Rent to Value Ratio
Active
$70,000
2
bds
|
1
ba
|
504
sqft
|
built
1924
2620 Orchard St, Blue Island, IL 60406
$713
Cash flow
11.9%
Cash-on-Cash Return
12.2%
Cap rate
1.9%
Rent to Value Ratio
Active
$799,900
3
bds
|
2
ba
|
0
sqft
|
built
1963
1310 N Ritchie Ct, Chicago, IL 60610
$-3,914
Cash flow
-25.5%
Cash-on-Cash Return
0.4%
Cap rate
0.5%
Rent to Value Ratio
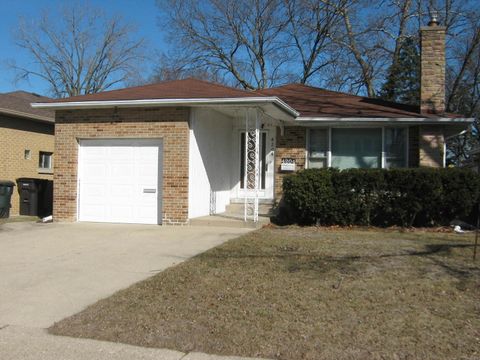
Active
$444,900
3
bds
|
3
ba
|
1,467
sqft
|
built
1953
4204 Main St, Skokie, IL 60076
$-1,078
Cash flow
-12.6%
Cash-on-Cash Return
3.4%
Cap rate
0.7%
Rent to Value Ratio
Active
$499,900
3
bds
|
2
ba
|
1,500
sqft
|
built
2001
506 W Oakdale Ave, Chicago, IL 60657
$-825
Cash flow
-8.6%
Cash-on-Cash Return
4.3%
Cap rate
0.8%
Rent to Value Ratio
Active
$549,913
3
bds
|
3
ba
|
1,992
sqft
|
built
1954
3207 Knollwood Ln, Glenview, IL 60025
$-771
Cash flow
-7.3%
Cash-on-Cash Return
4.6%
Cap rate
0.7%
Rent to Value Ratio
Active
$649,900
4
bds
|
3
ba
|
3,016
sqft
|
built
1927
2640 N 76th Ct, Elmwood Park, IL 60707
$-2,537
Cash flow
-20.4%
Cash-on-Cash Return
1.6%
Cap rate
0.4%
Rent to Value Ratio
Active
$279,999
4
bds
|
2
ba
|
1,543
sqft
|
built
1914
1531 Harvey Ave, Berwyn, IL 60402
$-29
Cash flow
-0.5%
Cash-on-Cash Return
6.1%
Cap rate
1.0%
Rent to Value Ratio
Active
$179,900
1
bds
|
1
ba
|
900
sqft
|
built
1962
4250 N Marine Dr, Chicago, IL 60613
$-480
Cash flow
-13.9%
Cash-on-Cash Return
3.1%
Cap rate
1.2%
Rent to Value Ratio
Active
$214,900
1
bds
|
1
ba
|
850
sqft
|
built
1973
655 W Irving Park Rd, Chicago, IL 60613
$-891
Cash flow
-21.6%
Cash-on-Cash Return
1.3%
Cap rate
1.1%
Rent to Value Ratio
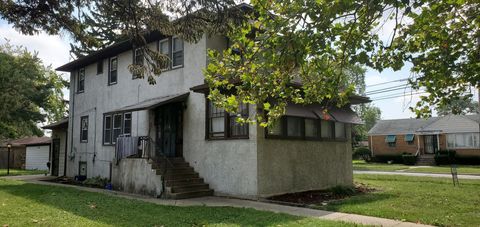
Active
$240,000
3
bds
|
2
ba
|
1,760
sqft
|
built
1922
1835 S 24th Ave, Maywood, IL 60153
$-119
Cash flow
-2.6%
Cash-on-Cash Return
5.7%
Cap rate
1.2%
Rent to Value Ratio
Active
$370,000
6
bds
|
2
ba
|
0
sqft
|
built
1926
7353 S King Dr, Chicago, IL 60619
$-710
Cash flow
-10.0%
Cash-on-Cash Return
4.0%
Cap rate
0.5%
Rent to Value Ratio
Active
$359,900
3
bds
|
2
ba
|
1,200
sqft
|
built
1951
3415 Adams St, Bellwood, IL 60104
$-782
Cash flow
-11.3%
Cash-on-Cash Return
3.7%
Cap rate
0.7%
Rent to Value Ratio
Active
$519,000
3
bds
|
3
ba
|
1,817
sqft
|
built
1929
6229 W Waveland Ave, Chicago, IL 60634
$-841
Cash flow
-8.5%
Cash-on-Cash Return
4.3%
Cap rate
0.7%
Rent to Value Ratio
Active
$579,900
4
bds
|
3
ba
|
2,538
sqft
|
built
1953
816 E Mayfair Rd, Arlington Heights, IL 60005
$-1,569
Cash flow
-14.1%
Cash-on-Cash Return
3.0%
Cap rate
0.7%
Rent to Value Ratio
Active
$449,000
2
bds
|
1
ba
|
1,150
sqft
|
built
1916
360 W Illinois St, Chicago, IL 60654
$-1,575
Cash flow
-18.3%
Cash-on-Cash Return
2.1%
Cap rate
0.7%
Rent to Value Ratio
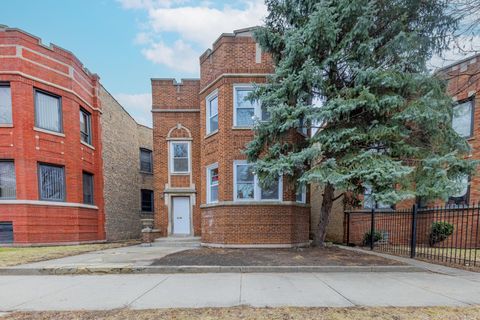
Active
$425,000
3
bds
|
2
ba
|
1,448
sqft
|
built
2008
4141 N Kedzie Ave, Chicago, IL 60618
$-1,241
Cash flow
-15.2%
Cash-on-Cash Return
2.8%
Cap rate
0.7%
Rent to Value Ratio
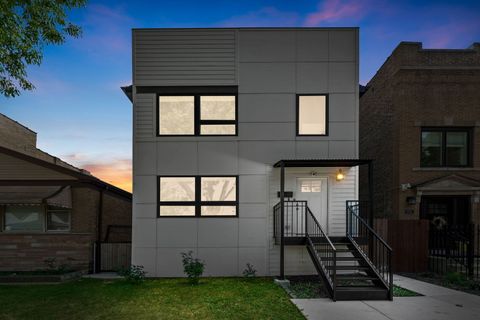
Active
$382,900
2
bds
|
2
ba
|
1,375
sqft
|
built
2007
3637 N Spaulding Ave, Chicago, IL 60618
$-1,013
Cash flow
-13.8%
Cash-on-Cash Return
2.5%
Cap rate
0.7%
Rent to Value Ratio
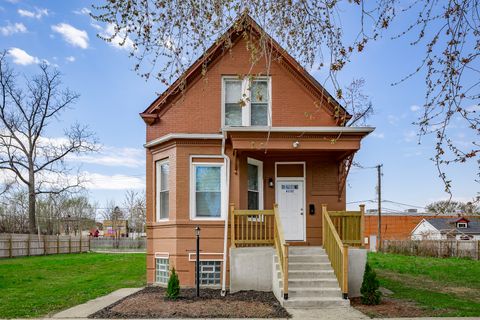
Active
$199,900
6
bds
|
3
ba
|
2,972
sqft
|
built
1875
311 W Garfield Blvd, Chicago, IL 60621
$1,212
Cash flow
31.6%
Cash-on-Cash Return
13.5%
Cap rate
1.8%
Rent to Value Ratio
Active
$749,900
4
bds
|
3
ba
|
2,706
sqft
|
built
1942
5950 N Kostner Ave, Chicago, IL 60646
$-2,043
Cash flow
-14.2%
Cash-on-Cash Return
3.0%
Cap rate
0.6%
Rent to Value Ratio
Active
$215,000
1
bds
|
1
ba
|
700
sqft
|
built
1967
2336 N Commonwealth Ave, Chicago, IL 60614
$-251
Cash flow
-6.1%
Cash-on-Cash Return
4.3%
Cap rate
0.9%
Rent to Value Ratio

Active
$624,900
3
bds
|
4
ba
|
2,688
sqft
|
built
1940
5443 S Rutherford Ave, Chicago, IL 60638
$-1,777
Cash flow
-14.8%
Cash-on-Cash Return
2.3%
Cap rate
0.4%
Rent to Value Ratio
Active
$949,900
3
bds
|
2
ba
|
0
sqft
|
built
1925
435 W Roslyn Pl, Chicago, IL 60614
$-3,618
Cash flow
-19.9%
Cash-on-Cash Return
1.7%
Cap rate
0.5%
Rent to Value Ratio
Active
$995,000
3
bds
|
3
ba
|
0
sqft
|
built
1890
3724 N Bosworth Ave, Chicago, IL 60613
$-3,926
Cash flow
-20.6%
Cash-on-Cash Return
1.5%
Cap rate
0.4%
Rent to Value Ratio
Active
$450,000
2
bds
|
2
ba
|
1,370
sqft
|
built
2003
125 S Jefferson St, Chicago, IL 60661
$-1,400
Cash flow
-16.2%
Cash-on-Cash Return
2.5%
Cap rate
0.8%
Rent to Value Ratio
Active
$325,000
2
bds
|
2
ba
|
1,290
sqft
|
built
2006
3450 S Halsted St, Chicago, IL 60608
$-833
Cash flow
-13.4%
Cash-on-Cash Return
3.2%
Cap rate
0.9%
Rent to Value Ratio
Active
$325,000
5
bds
|
3
ba
|
0
sqft
|
built
1898
7250 S Morgan St, Chicago, IL 60621
$-361
Cash flow
-5.8%
Cash-on-Cash Return
4.9%
Cap rate
0.6%
Rent to Value Ratio
Active
$679,000
3
bds
|
3
ba
|
0
sqft
|
built
1959
5660 N Rogers Ave, Chicago, IL 60646
$-1,720
Cash flow
-13.2%
Cash-on-Cash Return
3.2%
Cap rate
0.6%
Rent to Value Ratio
Active
$330,000
2
bds
|
2
ba
|
1,150
sqft
|
built
1973
655 W Irving Park Rd, Chicago, IL 60613
$-1,532
Cash flow
-24.2%
Cash-on-Cash Return
0.7%
Cap rate
0.8%
Rent to Value Ratio
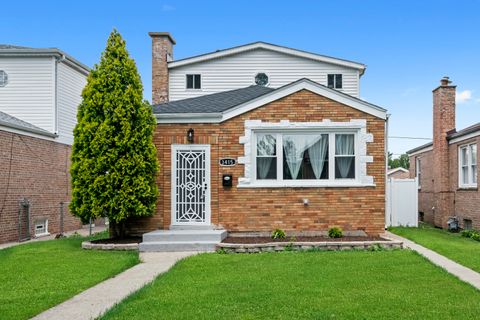
Active
$333,000
4
bds
|
3
ba
|
2,314
sqft
|
built
1893
11258 S Church St, Chicago, IL 60643
$368
Cash flow
5.8%
Cash-on-Cash Return
7.0%
Cap rate
1.0%
Rent to Value Ratio

Active
$239,900
2
bds
|
2
ba
|
1,400
sqft
|
built
1981
9386 Landings Ln, Des Plaines, IL 60016
$-227
Cash flow
-4.9%
Cash-on-Cash Return
4.5%
Cap rate
1.0%
Rent to Value Ratio
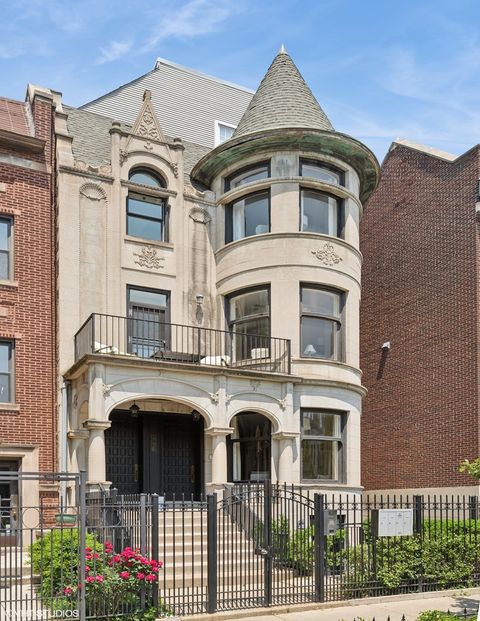
Active
$759,900
3
bds
|
3
ba
|
1,921
sqft
|
built
1907
1513 W Highland Ave, Chicago, IL 60660
$-1,910
Cash flow
-13.1%
Cash-on-Cash Return
3.2%
Cap rate
0.5%
Rent to Value Ratio
Active
$200,000
2
bds
|
1
ba
|
1,250
sqft
|
built
1974
5100 N Sheridan Rd, Chicago, IL 60640
$-79
Cash flow
-2.1%
Cash-on-Cash Return
5.8%
Cap rate
1.1%
Rent to Value Ratio
Active
$469,000
3
bds
|
2
ba
|
2,160
sqft
|
built
1965
3331 W Belle Plaine Ave, Chicago, IL 60618
$-507
Cash flow
-5.6%
Cash-on-Cash Return
5.0%
Cap rate
0.7%
Rent to Value Ratio