Cook County Investment Properties for Sale
Browse homes for sale and investment properties in Cook County. Refine your search by price, property type, or more.
Best cash flowing properties in Cook County
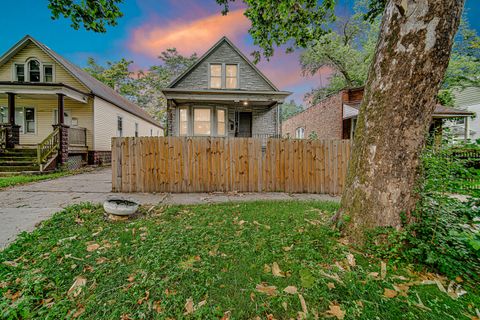
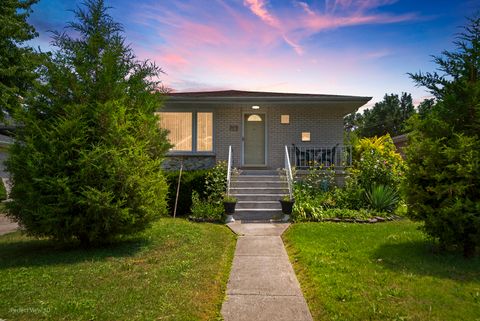
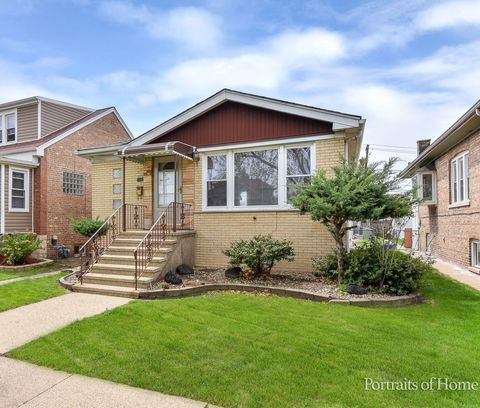
Active
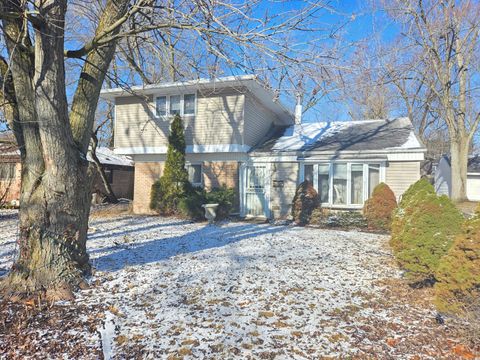
$115,000
6
bds
|
2
ba
|
1,714
sqft
|
built
1918
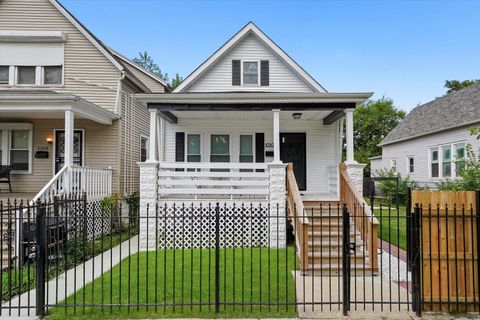
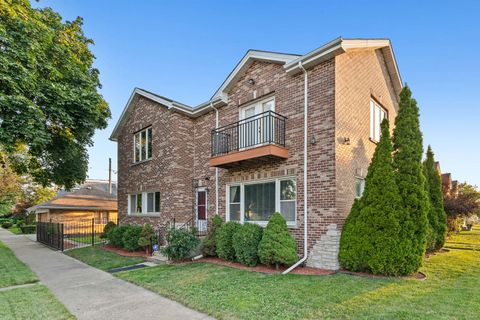
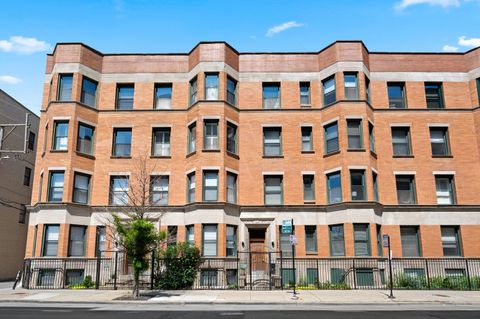
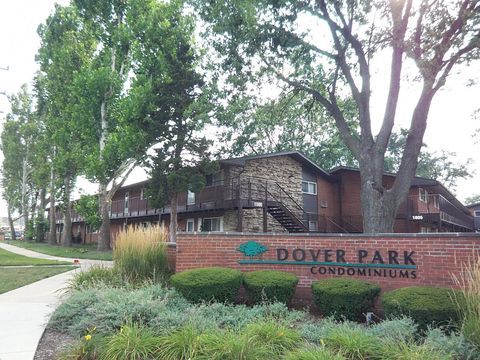
12220 S Normal Ave, Chicago, IL 60628
$974
Cash flow
44.2%
Cash-on-Cash Return
15.8%
Cap rate
1.9%
Rent to Value Ratio
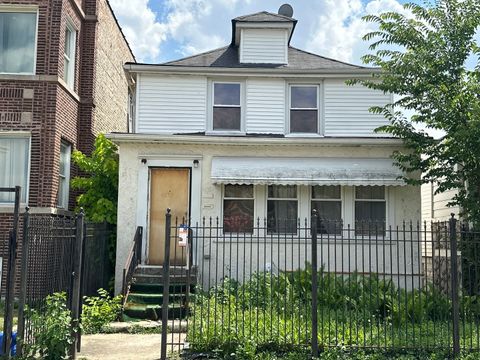
Active
$119,999
3
bds
|
1
ba
|
1,408
sqft
|
built
1898
5257 W Gladys Ave, Chicago, IL 60644
$686
Cash flow
29.8%
Cash-on-Cash Return
12.5%
Cap rate
1.8%
Rent to Value Ratio
5,087 out of 5,893 properties for sale in Cook County
Limited Results Shown
Create a free account, or log in to reveal all property listings and enjoy the complete experience.
Active
$250,000
2
bds
|
3
ba
|
1,900
sqft
|
built
1921
5725 S Troy St, Chicago, IL 60629
$52
Cash flow
1.1%
Cash-on-Cash Return
5.9%
Cap rate
0.9%
Rent to Value Ratio
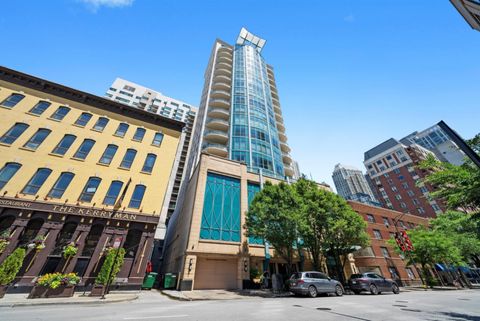
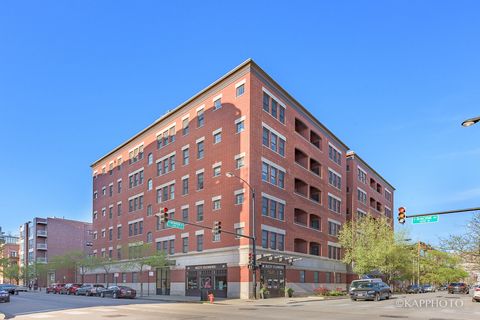
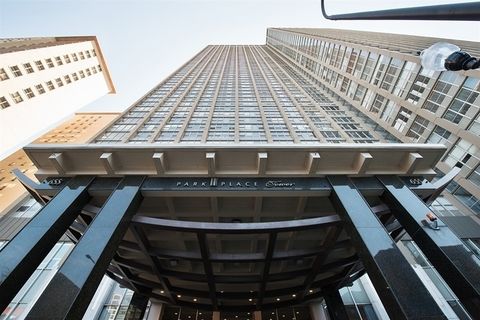
Active
$310,000
1
bds
|
1
ba
|
0
sqft
|
built
2006
849 N Franklin St, Chicago, IL 60610
$-799
Cash flow
-13.4%
Cash-on-Cash Return
2.6%
Cap rate
0.8%
Rent to Value Ratio
Active
$339,900
3
bds
|
2
ba
|
1,248
sqft
|
built
1975
9829 Oak Park Ave, Oak Lawn, IL 60453
$-114
Cash flow
-1.7%
Cash-on-Cash Return
5.3%
Cap rate
0.8%
Rent to Value Ratio
Active
$799,000
3
bds
|
3
ba
|
2,406
sqft
|
built
2002
60 W Erie St, Chicago, IL 60654
$-5,585
Cash flow
-36.5%
Cash-on-Cash Return
-2.7%
Cap rate
0.4%
Rent to Value Ratio

Active
$375,000
1
bds
|
2
ba
|
0
sqft
|
built
2004
437 W North Ave, Chicago, IL 60610
$-864
Cash flow
-12.0%
Cash-on-Cash Return
2.9%
Cap rate
0.7%
Rent to Value Ratio
Active
$655,000
3
bds
|
2
ba
|
1,875
sqft
|
built
1888
368 W Huron St, Chicago, IL 60654
$-2,456
Cash flow
-19.6%
Cash-on-Cash Return
1.2%
Cap rate
0.4%
Rent to Value Ratio
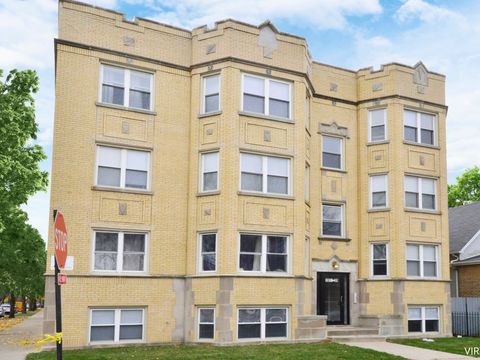
Active
$158,000
4
bds
|
2
ba
|
1,728
sqft
|
built
1898
14625 Martin Luther King Jr Dr, Dolton, IL 60419
$236
Cash flow
7.8%
Cash-on-Cash Return
7.5%
Cap rate
1.5%
Rent to Value Ratio
Active
$275,000
3
bds
|
3
ba
|
1,100
sqft
|
built
1886
10506 S Edbrooke Ave, Chicago, IL 60628
$219
Cash flow
4.2%
Cash-on-Cash Return
6.6%
Cap rate
0.8%
Rent to Value Ratio
Active
$635,000
4
bds
|
3
ba
|
2,420
sqft
|
built
1912
4505 N Harding Ave, Chicago, IL 60625
$-1,686
Cash flow
-13.9%
Cash-on-Cash Return
2.5%
Cap rate
0.4%
Rent to Value Ratio
Active
$799,900
6
bds
|
3
ba
|
0
sqft
|
built
1916
1922 N Richmond St, Chicago, IL 60647
$-2,365
Cash flow
-15.4%
Cash-on-Cash Return
2.1%
Cap rate
0.4%
Rent to Value Ratio
Active
$590,000
2
bds
|
2
ba
|
1,485
sqft
|
built
2003
125 E 13th St, Chicago, IL 60605
$-2,363
Cash flow
-20.9%
Cash-on-Cash Return
0.9%
Cap rate
0.5%
Rent to Value Ratio
Active
$729,900
6
bds
|
4
ba
|
3,605
sqft
|
built
1954
5901 W Foster Ave, Chicago, IL 60630
$-1,222
Cash flow
-8.7%
Cash-on-Cash Return
3.7%
Cap rate
0.6%
Rent to Value Ratio
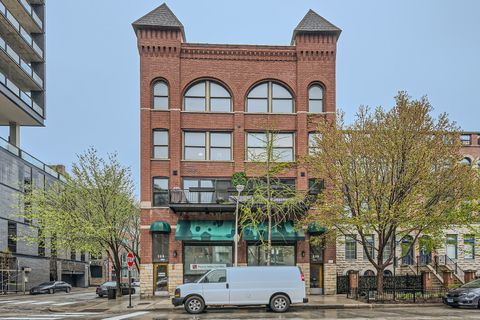
Active
$295,000
1
bds
|
1
ba
|
728
sqft
|
built
2002
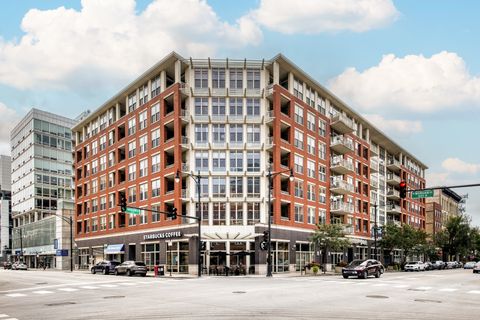
222 N Columbus Dr, Chicago, IL 60601
$-1,030
Cash flow
-18.2%
Cash-on-Cash Return
1.5%
Cap rate
0.7%
Rent to Value Ratio
Active
$249,900
1
bds
|
1
ba
|
800
sqft
|
built
1988
33 W Delaware Pl, Chicago, IL 60610
$-694
Cash flow
-14.5%
Cash-on-Cash Return
2.3%
Cap rate
1.0%
Rent to Value Ratio
Active
$389,900
6
bds
|
3
ba
|
0
sqft
|
built
1908
1759 E 72nd Pl, Chicago, IL 60649
$-1,144
Cash flow
-15.3%
Cash-on-Cash Return
2.2%
Cap rate
0.4%
Rent to Value Ratio
Active
$325,000
2
bds
|
1
ba
|
0
sqft
|
built
1890
1044 W Lawrence Ave, Chicago, IL 60640
$-692
Cash flow
-11.1%
Cash-on-Cash Return
3.1%
Cap rate
0.7%
Rent to Value Ratio
Active
$259,000
1
bds
|
1
ba
|
800
sqft
|
built
1905
1727 S Indiana Ave, Chicago, IL 60616
$-639
Cash flow
-12.9%
Cash-on-Cash Return
2.7%
Cap rate
0.8%
Rent to Value Ratio
Active
$975,000
3
bds
|
3
ba
|
2,340
sqft
|
built
1980
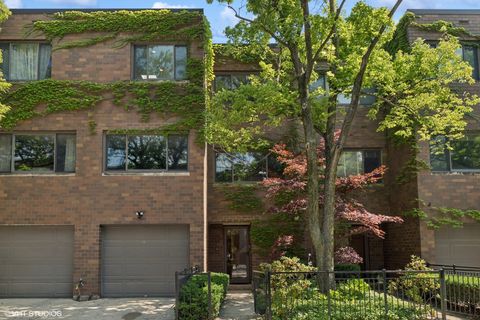
1713 N Vine St, Chicago, IL 60614
$-2,198
Cash flow
-11.8%
Cash-on-Cash Return
3.0%
Cap rate
0.6%
Rent to Value Ratio
Active
$525,000
2
bds
|
2
ba
|
1,255
sqft
|
built
2001
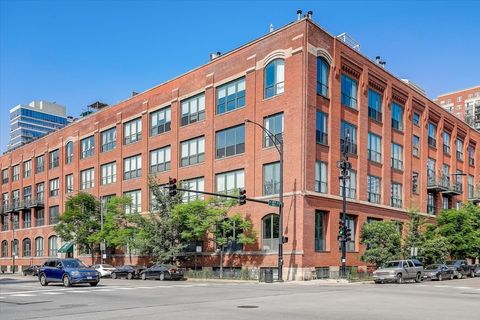
1001 W Madison St, Chicago, IL 60607
$-1,853
Cash flow
-18.4%
Cash-on-Cash Return
1.4%
Cap rate
0.5%
Rent to Value Ratio
Active
$379,900
3
bds
|
2
ba
|
1,827
sqft
|
built
1960
3834 Wisconsin Ave, Berwyn, IL 60402
$-472
Cash flow
-6.5%
Cash-on-Cash Return
4.2%
Cap rate
0.7%
Rent to Value Ratio
Active
$725,000
3
bds
|
2
ba
|
1,500
sqft
|
built
2003
35 S Racine Ave, Chicago, IL 60607
$-1,825
Cash flow
-13.1%
Cash-on-Cash Return
2.7%
Cap rate
0.6%
Rent to Value Ratio
Active
$749,000
4
bds
|
4
ba
|
2,903
sqft
|
built
1996
1342 N Wellington Ct, Palatine, IL 60067
$-1,976
Cash flow
-13.8%
Cash-on-Cash Return
2.5%
Cap rate
0.5%
Rent to Value Ratio
Active
$219,900
2
bds
|
2
ba
|
1,200
sqft
|
built
2003
14145 Kedvale Ave, Crestwood, IL 60418
$-134
Cash flow
-3.2%
Cash-on-Cash Return
4.9%
Cap rate
0.9%
Rent to Value Ratio
Active
$157,000
1
bds
|
1
ba
|
800
sqft
|
built
1965
1500 S Busse Rd, Mount Prospect, IL 60056
$-99
Cash flow
-3.3%
Cash-on-Cash Return
4.9%
Cap rate
1.0%
Rent to Value Ratio
Active
$285,000
2
bds
|
2
ba
|
1,250
sqft
|
built
1915
40 E 9th St, Chicago, IL 60605
$-1,015
Cash flow
-18.6%
Cash-on-Cash Return
1.4%
Cap rate
0.9%
Rent to Value Ratio
Active
$599,900
4
bds
|
3
ba
|
2,800
sqft
|
built
1966
9825 S Kilbourn Ave, Oak Lawn, IL 60453
$-1,389
Cash flow
-12.1%
Cash-on-Cash Return
2.9%
Cap rate
0.5%
Rent to Value Ratio
Active
$169,900
3
bds
|
1
ba
|
1,040
sqft
|
built
1961
15417 Cherry Ln, Markham, IL 60428
$576
Cash flow
17.7%
Cash-on-Cash Return
9.7%
Cap rate
1.2%
Rent to Value Ratio
Active
$325,000
3
bds
|
2
ba
|
1,800
sqft
|
built
1971
200 Lake Blvd, Buffalo Grove, IL 60089
$-962
Cash flow
-15.4%
Cash-on-Cash Return
2.1%
Cap rate
0.6%
Rent to Value Ratio
Active
$425,000
2
bds
|
2
ba
|
1,400
sqft
|
built
1983
2000 Chestnut Ave, Glenview, IL 60025
$-1,273
Cash flow
-15.6%
Cash-on-Cash Return
2.1%
Cap rate
0.6%
Rent to Value Ratio
Active
$324,900
3
bds
|
3
ba
|
2,600
sqft
|
built
1922
1890 182nd Pl, Lansing, IL 60438
$-958
Cash flow
-15.4%
Cash-on-Cash Return
2.1%
Cap rate
0.5%
Rent to Value Ratio
Active
$780,000
3
bds
|
2
ba
|
1,895
sqft
|
built
2005
1250 S Indiana Ave, Chicago, IL 60605
$-3,806
Cash flow
-25.5%
Cash-on-Cash Return
-0.2%
Cap rate
0.6%
Rent to Value Ratio
Active
$89,000
4
bds
|
2
ba
|
1,822
sqft
|
built
1951
340 Nassau St, Park Forest, IL 60466
$408
Cash flow
23.9%
Cash-on-Cash Return
11.2%
Cap rate
2.8%
Rent to Value Ratio
Active
$519,000
5
bds
|
3
ba
|
3,022
sqft
|
built
1950
1740 N 74th Ave, Elmwood Park, IL 60707
$-878
Cash flow
-8.8%
Cash-on-Cash Return
3.6%
Cap rate
0.7%
Rent to Value Ratio
Active
$575,000
2
bds
|
3
ba
|
1,650
sqft
|
built
1988
1443 W Wrightwood Ave, Chicago, IL 60614
$-984
Cash flow
-8.9%
Cash-on-Cash Return
3.6%
Cap rate
0.7%
Rent to Value Ratio
Active
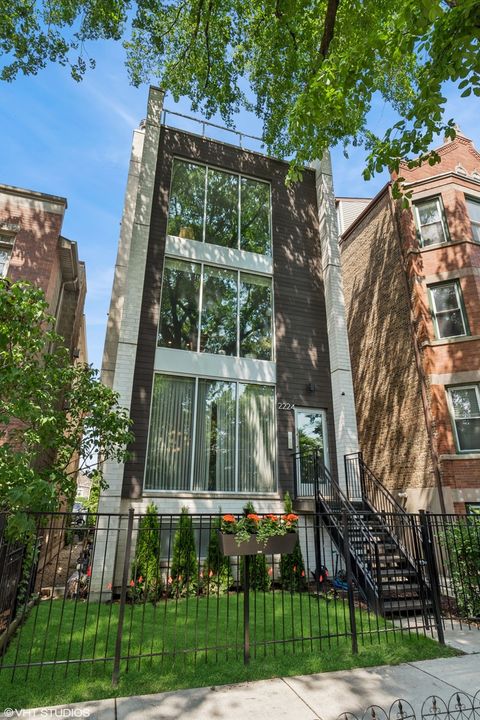
$599,000
2
bds
|
2
ba
|
0
sqft
|
built
2018
2224 N Seeley Ave, Chicago, IL 60647
$-1,637
Cash flow
-14.3%
Cash-on-Cash Return
2.4%
Cap rate
0.5%
Rent to Value Ratio
Active
$229,900
1
bds
|
1
ba
|
840
sqft
|
built
1973
655 W Irving Park Rd, Chicago, IL 60613
$-963
Cash flow
-21.9%
Cash-on-Cash Return
0.7%
Cap rate
1.0%
Rent to Value Ratio

Active
$259,000
1
bds
|
1
ba
|
0
sqft
|
built
1987
3660 N Lake Shore Dr, Chicago, IL 60613
$-600
Cash flow
-12.1%
Cash-on-Cash Return
2.9%
Cap rate
0.8%
Rent to Value Ratio
Active
$149,900
1
bds
|
1
ba
|
950
sqft
|
built
1925
1939 W Granville Ave, Chicago, IL 60660
$-128
Cash flow
-4.5%
Cash-on-Cash Return
4.7%
Cap rate
1.1%
Rent to Value Ratio